Visual acuity examination with images
Reading File
Finding Sources
Searching the Web
visual acuity examination Snellen chart techniques ophthalmology
Reading File
Reading File
Loading Image
Loading Image
Loading Image
Loading Image
Reading File
Reading File
Loading Image
Loading Image
Finding Sources
Reading File
Reading File
Loading Image
I now have comprehensive content and images. Let me compose the full response.
Visual Acuity Examination
Visual acuity (VA) is the most fundamental measurement in any eye examination. It quantifies the eye's ability to resolve fine spatial detail - specifically, the minimum angle of separation between two points that allows them to be perceived as distinct.
1. Physiological Basis
Distance VA is directly related to the minimum angle of resolution (MAR) subtended at the nodal point of the eye. The fovea centralis, packed with cone photoreceptors, provides the highest spatial resolution. Normal foveal resolution requires distinguishing 1 minute of arc between adjacent points.
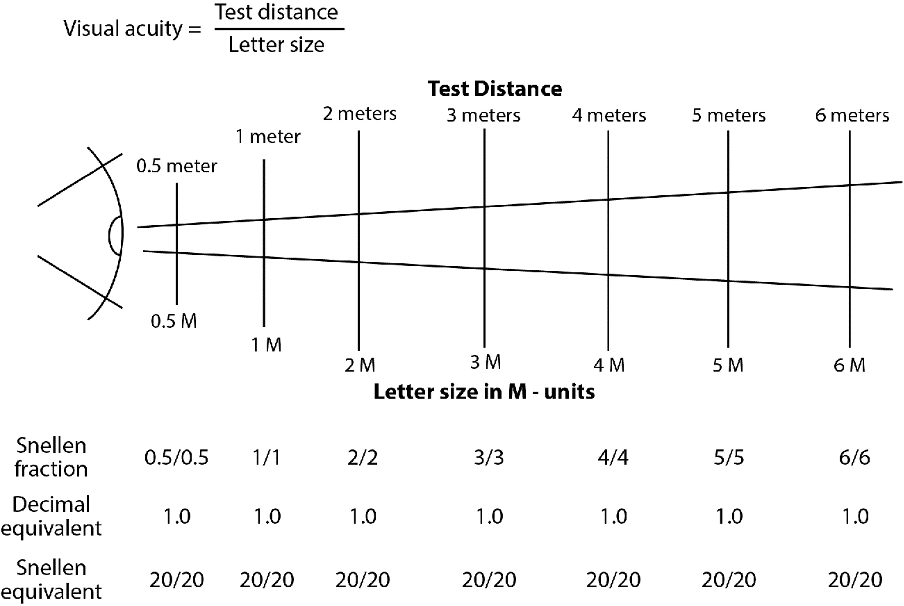
The formula shows: Visual Acuity = Test Distance / Letter Size. Regardless of the absolute test distance, a 6/6 (20/20) result means the patient reads the letter size that a normal observer reads at the same distance.
2. The Snellen Chart (Distance Vision)
Invented in 1862 by Herman Snellen, this remains the most widely used clinical tool.
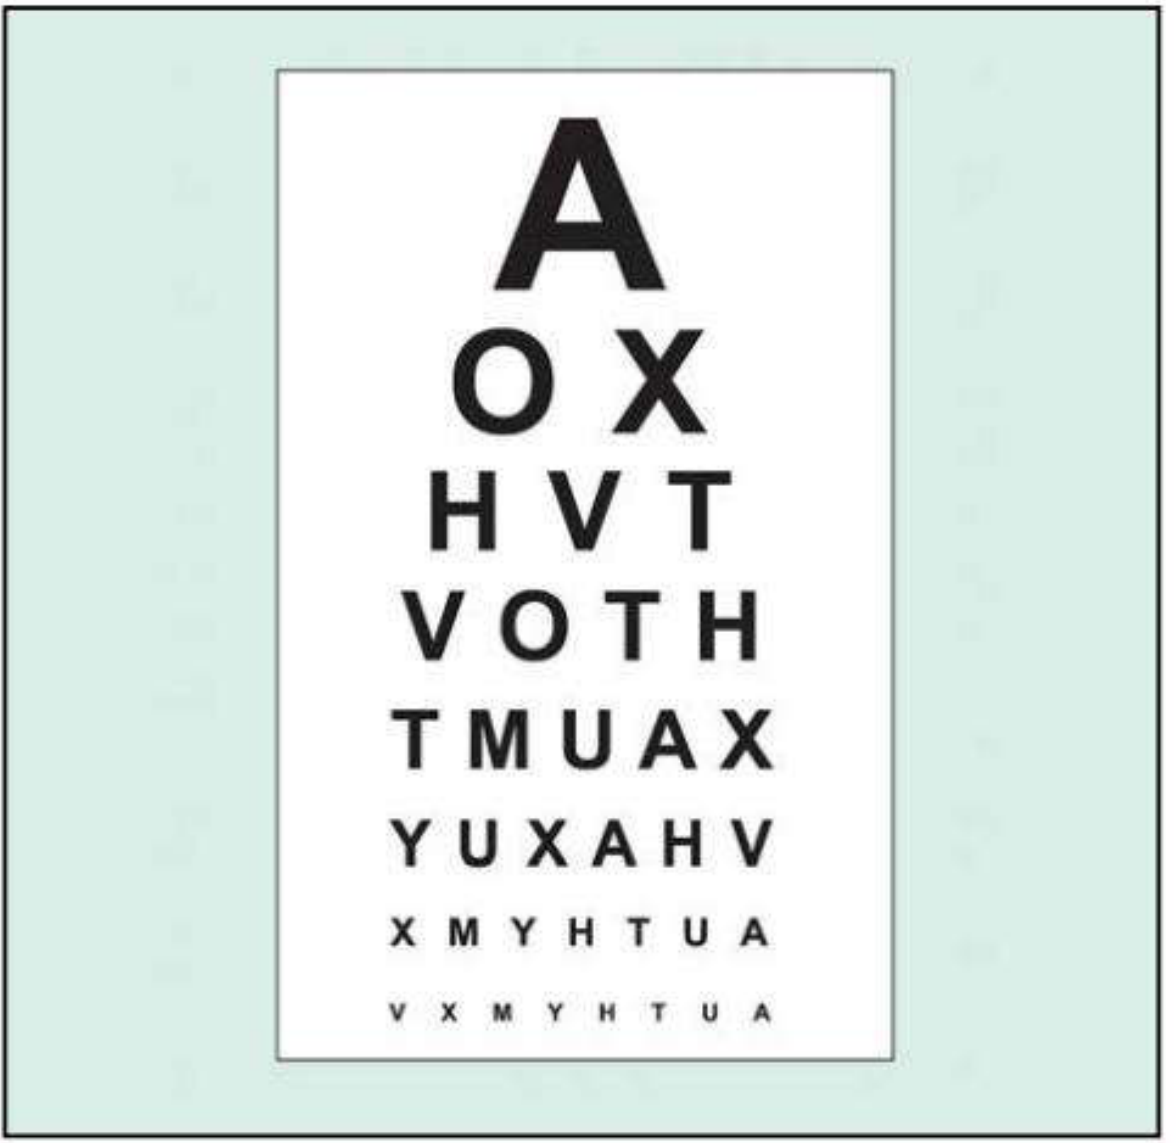
Fig. 1.1 - Standard Snellen chart (from Kanski's Clinical Ophthalmology 10th ed.)
How to read the notation:
- 6/6 (metric) = 20/20 (feet) - Normal vision
- The numerator = the patient's test distance (6 m or 20 ft)
- The denominator = the distance at which a person with normal vision can read the same letter
- Example: 6/60 (20/200) means the patient can only read at 6 m what a normal eye sees from 60 m
Procedure:
- Correct one eye with the occluder - test the worse eye first
- Use the patient's habitual refractive correction (glasses/contact lenses) first
- Record corrected VA, then unaided VA if needed
- Push the patient to read every letter possible on the line being tested
- Normal corrected VA in young adults is often better than 6/6
- Kanski's Clinical Ophthalmology 10th, p. 17
- Adams and Victor's Principles of Neurology 12th, p. 251
3. Snellen + Jaeger Charts - Combined View
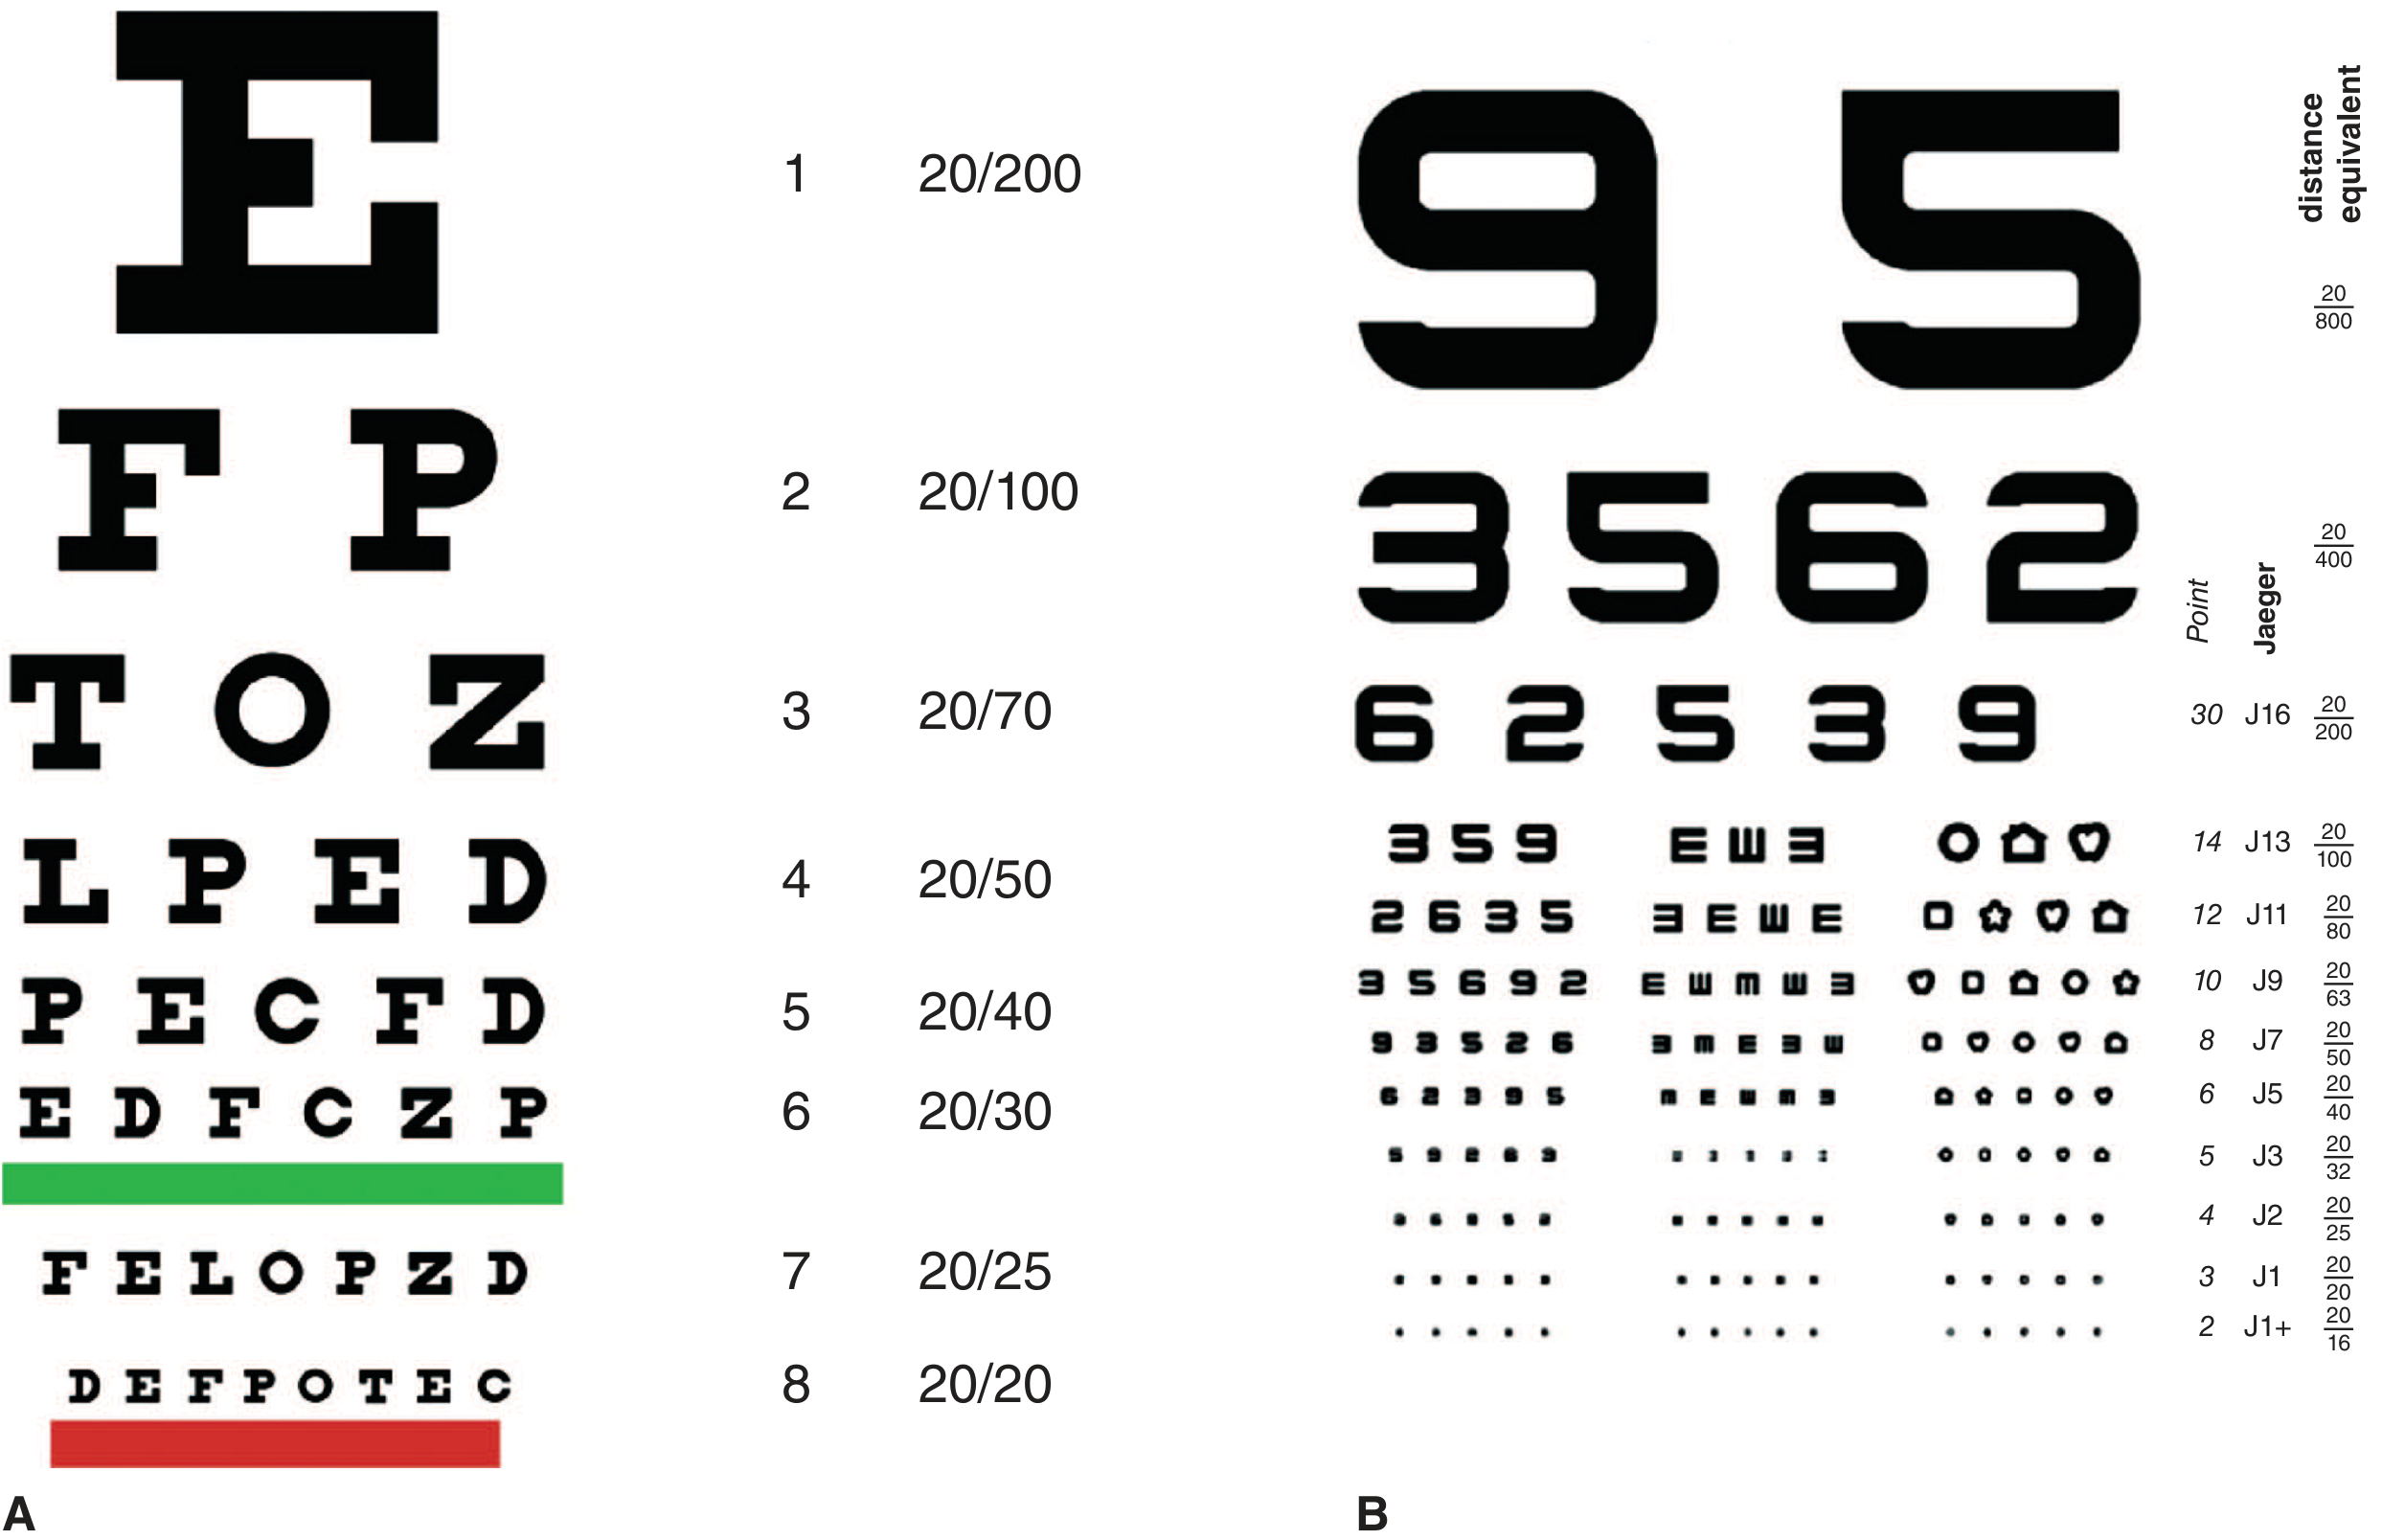
Fig. 12-1. A - Conventional Snellen chart (placed 20 ft from subject). B - Jaeger near card (used at 14-16 inches). From Adams and Victor's Principles of Neurology 12th ed.
Near Vision - Jaeger Card:
For bedside testing, the Jaeger near card is held 14 inches (35 cm) from the eye:
- J1 = 20/20 (normal near vision)
- J7 ≈ 20/50
- J13 ≈ 20/100
- J16 ≈ 20/200
Better near acuity than distance acuity suggests myopia or congenital nystagmus (convergence dampens nystagmus). Better distance than near acuity suggests uncorrected presbyopia.
4. Pinhole Test
When VA is less than 6/6, the pinhole aperture is used. It compensates for refractive error by admitting only the central, parallel rays of light - eliminating the need for accurate optical focusing.
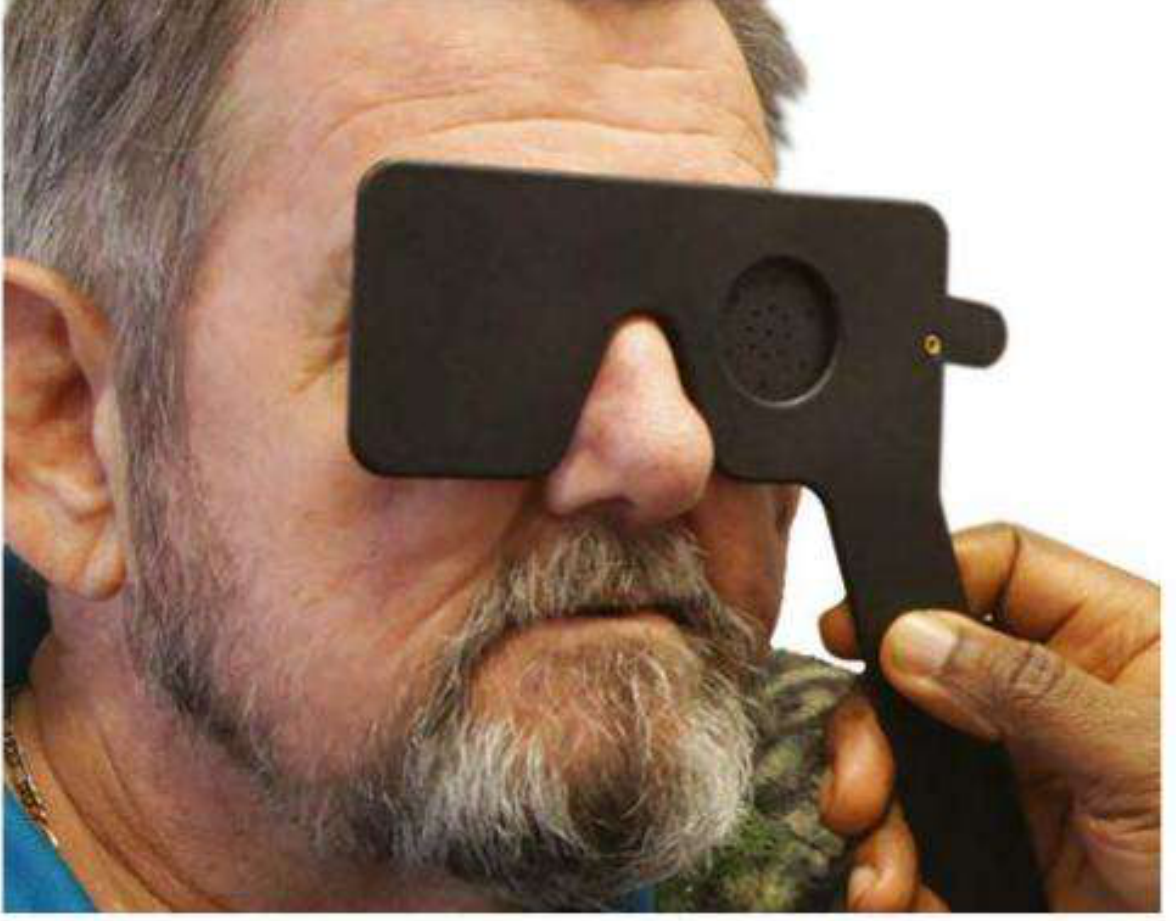
Fig. 1.2 - Pinhole occluder in use (from Kanski's Clinical Ophthalmology 10th ed.)
Interpretation:
- VA improves with pinhole → refractive error or media opacity (cornea, lens, vitreous) is responsible
- VA does not improve → likely retinal or neurological cause
- Note: pinhole VA may be worse than spectacle correction in macular disease and posterior lens opacities
5. Very Poor Visual Acuity - Qualitative Scale
When a patient cannot read any line on the Snellen chart, qualitative assessments are used in order:
| Level | Notation | Description |
|---|---|---|
| Counting Fingers | CF | Patient counts fingers held at a specified distance (usually 1 m) |
| Hand Movements | HM | Patient detects whether the examiner's hand is moving |
| Perception of Light | PL | Patient detects only light from a pen torch |
| No Perception of Light | NPL | Complete blindness |
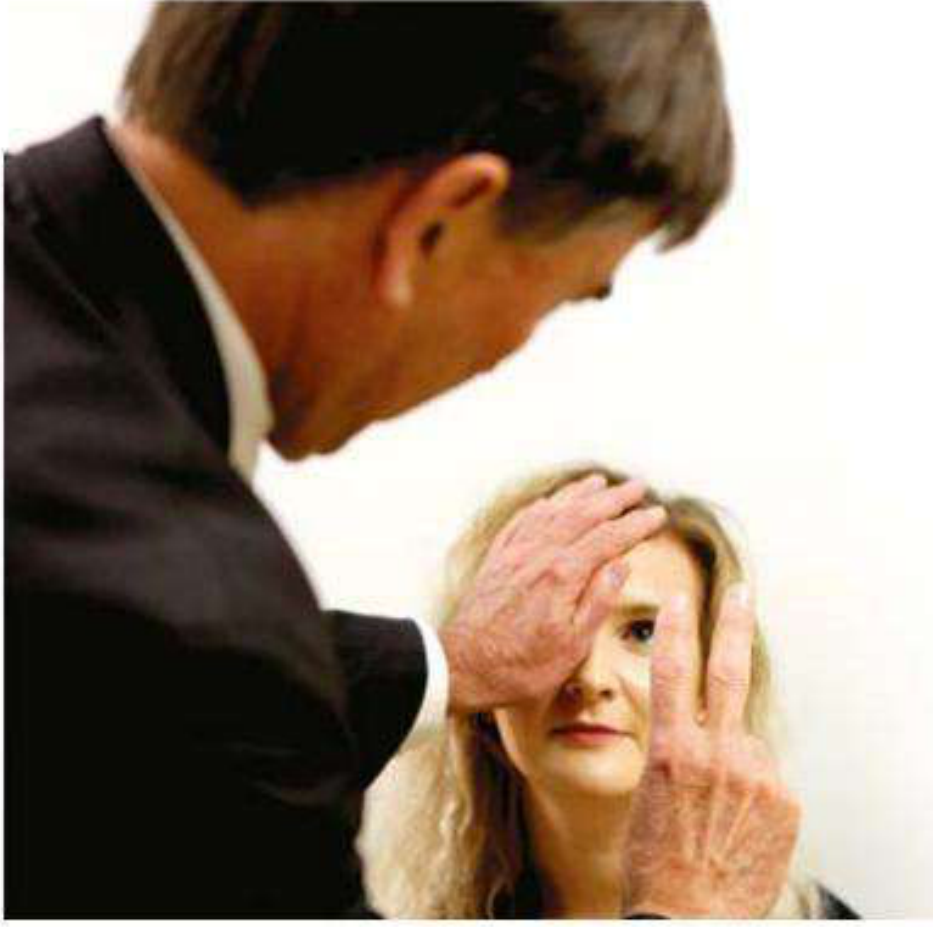
Fig. 1.3 - Testing "counting fingers" vision (from Kanski's Clinical Ophthalmology 10th ed.)
For light perception, the patient should also be tested for projection of light - the ability to identify which quadrant light is coming from. This is relevant when dense media opacity (e.g., mature cataract) is present.
6. LogMAR Charts (Research Standard)
LogMAR = log of the Minimum Angle of Resolution. These charts address key limitations of the Snellen chart.
| Feature | Snellen | LogMAR |
|---|---|---|
| Letters per line | Variable (unbalanced crowding) | Equal (5 letters per line) |
| Letter spacing | Irregular | Systematic, related to letter size |
| Testing distance | 6 m (needs long lane or mirror) | 4 m on many charts |
| Accuracy/consistency | Lower | Higher |
| Scoring | Straightforward | More complex |
| Suitability for research | Less suitable | Standard for research |
| Ease of use | Easy | Less user-friendly |
Key LogMAR conversions:
- 6/6 = logMAR 0.00
- 6/12 = logMAR 0.30
- 6/60 = logMAR 1.00
- Scores better than 6/6 are negative (e.g., 6/4 ≈ logMAR -0.18)
Each letter scored individually: 5 letters per row × 0.02 per letter = 0.1 logMAR per row. Testing continues until the patient misses half the letters on a line.
Common LogMAR charts:
- Bailey-Lovie chart - 6 m distance
- ETDRS chart (Early Treatment of Diabetic Retinopathy Study) - research gold standard, used at 4 m
- Kanski's Clinical Ophthalmology 10th, pp. 17-18
7. Visual Acuity Testing in Children
Preverbal children:
- Fixation and following - uses bright targets (a face is often best); assesses if the infant is visually alert
- Occlusion test - strong objection to covering one eye indicates poorer acuity in the other
- Rotation test - rapid rotation induces vestibulo-ocular nystagmus; if post-rotational nystagmus persists longer than 1-2 seconds after stopping, this suggests severely impaired vision (fixation not suppressing it)
- Preferential looking tests (Teller acuity cards, Keeler cards, Cardiff acuity cards) - infants prefer patterned over uniform stimuli; examiner records the finest grating or picture the infant tracks
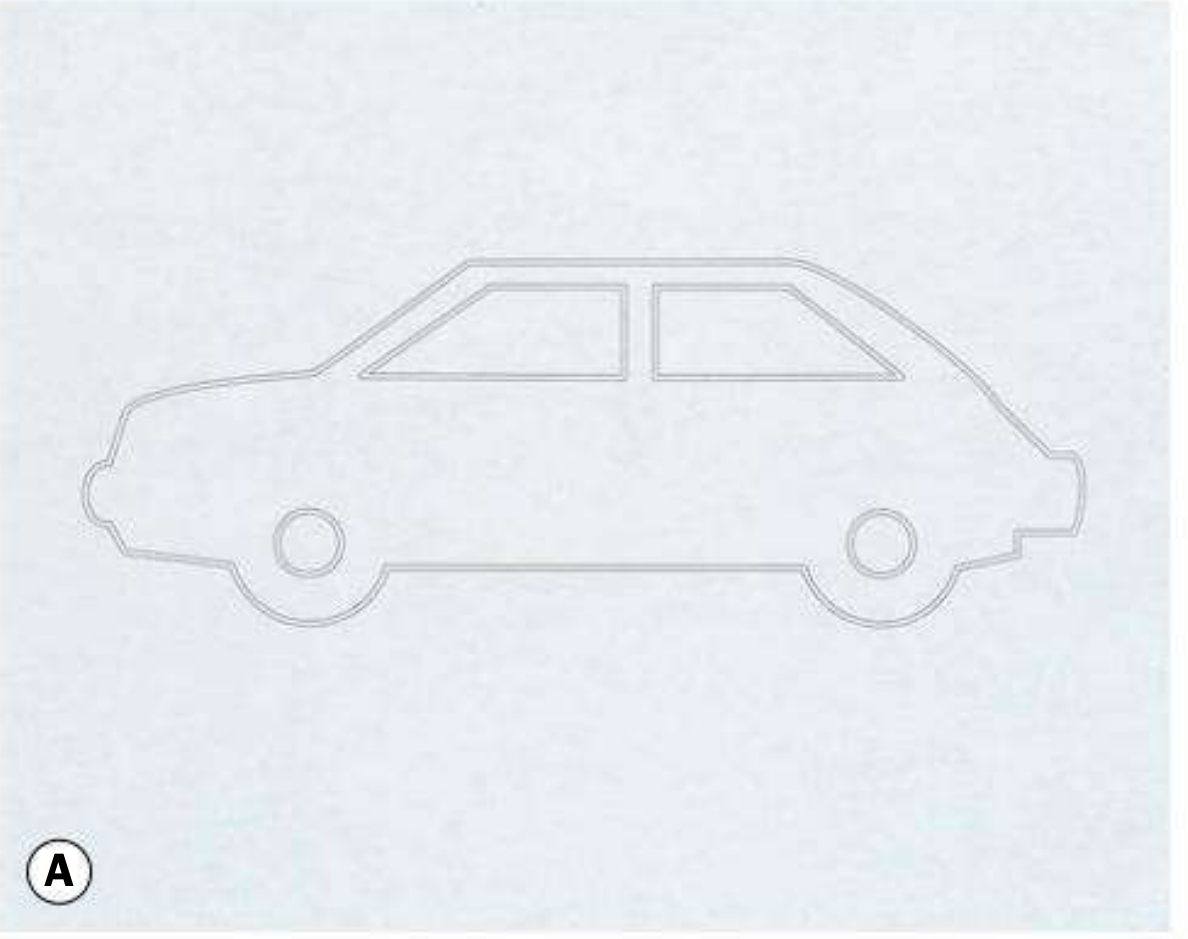
Fig. 18.18A - Cardiff acuity card (car, thin outline = 6/7.5) at 100 cm distance (from Kanski's Clinical Ophthalmology 10th ed.)
Verbal children:
- Age ~2 years: Picture naming tests (crowded Kay pictures)
- Age ~3 years: Letter matching (Keeler logMAR, Sonksen, Otago crowded tests)
- Always use crowded tests when amblyopia is suspected - single optotype tests overestimate acuity in amblyopia
- LogMAR tests preferred over Snellen for all children at risk of amblyopia
- Kanski's Clinical Ophthalmology 10th, pp. 734-736
8. Summary: VA Recording Convention
| Result | Meaning |
|---|---|
| 6/6 or 20/20 | Normal distance vision |
| 6/60 or 20/200 | Legal blindness threshold (in most countries) |
| CF 1 m | Can count fingers at 1 metre |
| HM | Hand movement only |
| PL | Light perception only |
| NPL | No perception of light |
Always record: corrected VA, which eye, test used, and whether pinhole was used.
Sources: Kanski's Clinical Ophthalmology 10th ed.; Adams and Victor's Principles of Neurology 12th ed.; Roberts and Hedges' Clinical Procedures in Emergency Medicine; StatPearls - Snellen Chart
Create a quick reference PDF on VA notation and conversion for clinical use
Reading File
Running Command
Running Command
Writing File
Your credits are exhausted. You can purchase a top-up or subscribe to a plan to continue using Orris. If you're already subscribed, your daily credits will reset tomorrow.
This is a shared conversation. Sign in to Orris to start your own chat.