
teach me full important concept of antianginal drugs pharmacology with easy and short notes which covers all important concepts with basic physiology which is must known to understand the concept
angina pectoris pathophysiology coronary artery diagram
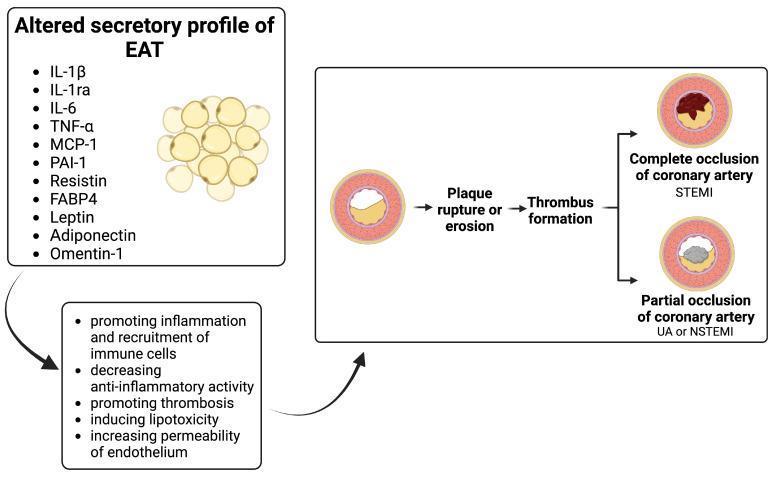
This pathophysiology diagram illustrates the link between the altered secretory profile of epicardial adipose tissue (EAT) and the pathogenesis of acute coronary syndrome (ACS). The left panel lists inflammatory cytokines and adipokines secreted by EAT, including IL-1β, IL-6, TNF-α, MCP-1, Resistin, FABP4, and Leptin, alongside anti-inflammatory factors like Adiponectin and Omentin-1. An arrow indicates how these secretions promote inflammation, immune cell recruitment, thrombosis, lipotoxicity, and increased endothelial permeability. The right panel depicts the progression of coronary artery disease: starting from an artery with a stable atherosclerotic plaque, the process advances through plaque rupture or erosion to thrombus formation. This culminates in two clinical outcomes: complete coronary artery occlusion, leading to ST-elevation myocardial infarction (STEMI), and partial occlusion, leading to unstable angina (UA) or non-ST-elevation myocardial infarction (NSTEMI). The diagram utilizes cross-sectional anatomical illustrations of coronary arteries to show varying degrees of luminal narrowing and thrombus size.
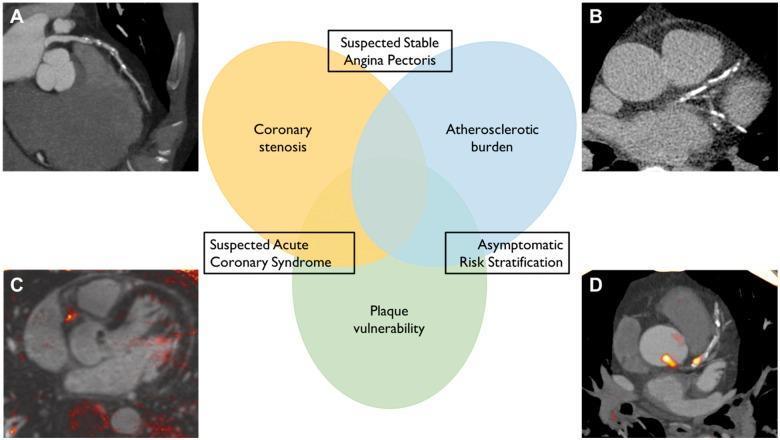
A multi-panel medical infographic and diagnostic imaging collage illustrating non-invasive coronary imaging modalities. The central feature is a Venn diagram highlighting three clinical objectives: coronary stenosis assessment (yellow), atherosclerotic burden quantification (blue), and plaque vulnerability identification (green). Overlapping regions link these objectives to clinical scenarios such as suspected stable angina pectoris, suspected acute coronary syndrome, and asymptomatic risk stratification. Surrounding the diagram are four diagnostic images: (A) a computed tomography angiography (CTA) showing coronary vessel morphology; (B) a coronary artery calcium (CAC) scan highlighting high-density calcified plaques; (C) a T1-weighted magnetic resonance coronary angiography showing potential intracoronary thrombus or intraplaque hemorrhage; and (D) a positron emission tomography (PET) scan utilizing radioactive tracers to map metabolic markers of plaque instability, indicated by focal orange/red hotspots. This educational visual demonstrates the complementary roles of CT, MRI, and PET in cardiology for evaluating ischemic heart disease and vascular health.
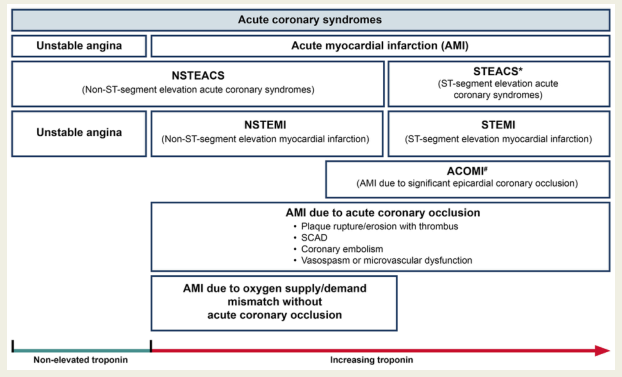
Summary : This diagram classifies acute coronary syndromes (ACS) based on clinical presentation, ECG findings, and troponin levels, distinguishing between unstable angina, non-ST-segment elevation, and ST-segment elevation myocardial infarction, and further subdividing by underlying pathophysiology. flowchart: # Main Categories : • Acute coronary syndromes (top-level box). • Two main branches: Unstable angina and Acute myocardial infarction (AMI). # Subcategories : • Under Acute myocardial infarction (AMI): – NSTEACS (Non-ST-segment elevation acute coronary syndromes) – STEACS* (ST-segment elevation acute coronary syndromes) • Under NSTEACS: – Unstable angina – NSTEMI (Non-ST-segment elevation myocardial infarction) • Under STEACS*: – STEMI (ST-segment elevation myocardial infarction) – ACOMI# (AMI due to significant epicardial coronary occlusion) # Pathophysiological Mechanisms : • AMI due to acute coronary occlusion: – Plaque rupture/erosion with thrombus – SCAD (Spontaneous coronary artery dissection) – Coronary embolism – Vasospasm or microvascular dysfunction • AMI due to oxygen supply/demand mismatch without acute coronary occlusion # Troponin Gradient : • A horizontal arrow at the bottom labeled from "Non-elevated troponin" (left, green) to "Increasing troponin" (right, red), indicating the spectrum of troponin elevation across the syndromes. # Layout : • Hierarchical, left-to-right and top-to-bottom arrangement. • Boxes are nested to show relationships (e.g., NSTEMI is under both NSTEACS and AMI). • Pathophysiological mechanisms are shown as underlying causes for AMI. Analysis : • The diagram visually organizes ACS into unstable angina and AMI, with further division by ECG findings (ST-segment elevation or not) and underlying cause (occlusion vs. supply/demand mismatch). • Troponin levels increase from unstable angina (non-elevated) to STEMI/ACOMI (markedly elevated). • The flowchart clarifies that not all AMI is due to acute coronary occlusion, and highlights the importance of both clinical and biochemical markers in diagnosis.
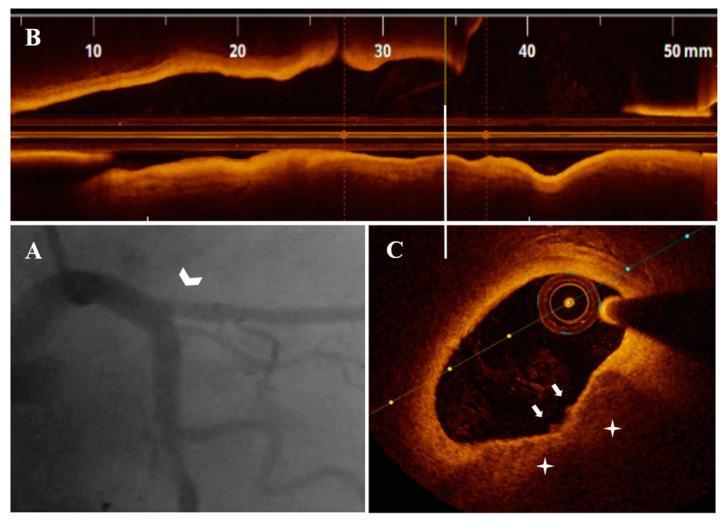
This composite figure demonstrates diagnostic imaging of the coronary arteries in a patient with unstable angina pectoris (UAP). Figure A is a coronary angiography (CA) frame showing the left coronary system, with a white arrowhead identifying a hazy, eccentric plaque at the ostium of the left anterior descending (LAD) artery. Figure B and C provide high-resolution intravascular imaging using optical coherence tomography (OCT). Figure B displays a longitudinal reconstructed view of the LAD plaque over a 50mm segment. Figure C shows a cross-sectional OCT view of the ostial LAD, revealing a plaque with an area stenosis of 38%. The image highlights plaque erosion with superficial calcific plaque (PE-SCP), marked by white stars, which is overlaid by white thrombi, indicated by white arrows. An OCT imaging catheter is centered within the vessel lumen. This set of images illustrates the clinical utility of combining luminal angiography with intravascular OCT to characterize vulnerable plaque morphology, such as calcific erosion and associated thrombosis, in acute coronary syndromes.
nitroglycerin mechanism of action nitric oxide cGMP smooth muscle relaxation
![A medical infographic and signaling pathway diagram illustrating the clinical uses and mechanism of phosphodiesterase 5 inhibitors (PDE5-Is). The central panel depicts the cellular NO/cGMP pathway: Nitric Oxide (NO) stimulates soluble guanylyl cyclase (sGC) to convert GTP into cGMP. cGMP then activates Protein Kinase G (PKG), leading to decreased intracellular calcium [Ca2+] and subsequent smooth muscle relaxation. PDE5-Is are shown inhibiting the degradation of cGMP into inactive 5' GMP. The diagram branches into three primary clinical applications: 1) Lower Urinary Tract (LUT), showing relaxation of prostate/bladder muscles and increased oxygen perfusion for treating LUTS secondary to Benign Prostatic Hyperplasia (BPH); 2) Penis, illustrating increased arterial inflow resulting in erection for treating Erectile Dysfunction; and 3) Lungs, detailing vasodilation and cellular changes (decreased DNA synthesis/proliferation, increased apoptosis) in pulmonary artery smooth cells for treating Pulmonary Arterial Hypertension (PAH). The illustration uses anatomical icons and flow arrows to connect molecular signaling to systemic physiological outcomes.](https://cdn.orris.care/cdss_images/pmc_clinical_VQA_bbd5a168e816825f18e6358b1adf67e917376b9f48aa4bbc0fd21c8cb511013e.jpg)
A medical infographic and signaling pathway diagram illustrating the clinical uses and mechanism of phosphodiesterase 5 inhibitors (PDE5-Is). The central panel depicts the cellular NO/cGMP pathway: Nitric Oxide (NO) stimulates soluble guanylyl cyclase (sGC) to convert GTP into cGMP. cGMP then activates Protein Kinase G (PKG), leading to decreased intracellular calcium [Ca2+] and subsequent smooth muscle relaxation. PDE5-Is are shown inhibiting the degradation of cGMP into inactive 5' GMP. The diagram branches into three primary clinical applications: 1) Lower Urinary Tract (LUT), showing relaxation of prostate/bladder muscles and increased oxygen perfusion for treating LUTS secondary to Benign Prostatic Hyperplasia (BPH); 2) Penis, illustrating increased arterial inflow resulting in erection for treating Erectile Dysfunction; and 3) Lungs, detailing vasodilation and cellular changes (decreased DNA synthesis/proliferation, increased apoptosis) in pulmonary artery smooth cells for treating Pulmonary Arterial Hypertension (PAH). The illustration uses anatomical icons and flow arrows to connect molecular signaling to systemic physiological outcomes.
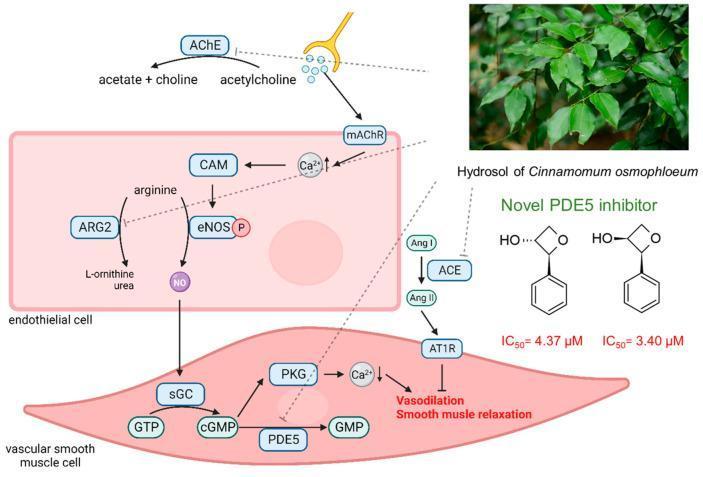
This pathophysiology diagram illustrates the biochemical mechanism by which Cinnamomum osmophloeum hydrosol influences erectile function through multi-pathway enzymatic inhibition within endothelial and vascular smooth muscle cells (VSMCs). The flowchart highlights four primary inhibitory targets: AChE (acetylcholinesterase), which breaks down acetylcholine into acetate and choline; ARG2 (arginase 2), which competes for arginine to produce L-ornithine and urea; ACE (angiotensin-converting enzyme), which converts Angiotensin I to the vasoconstrictor Angiotensin II; and PDE5 (phosphodiesterase type 5), which degrades cGMP. The diagram depicts the positive signaling cascade where acetylcholine activates muscarinic receptors (mAChR), increasing calcium and calmodulin (CAM) to activate phosphorylated eNOS (eNOS-P). This results in nitric oxide (NO) production, which diffuses to VSMCs to stimulate soluble guanylate cyclase (sGC). The sGC converts GTP to cGMP, activating protein kinase G (PKG) and leading to smooth muscle relaxation and vasodilation. Two novel PDE5 inhibitor isomers (trans- and cis-phenyloxetan-3-ol) are shown with their respective IC50 values (4.37 µM and 3.40 µM), demonstrating their structural role in maintaining cGMP levels to treat erectile dysfunction.
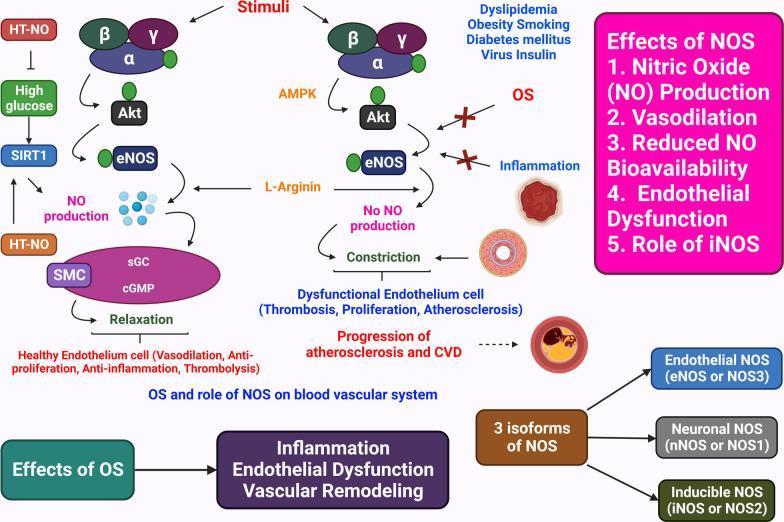
This pathophysiology diagram illustrates the impact of oxidative stress (OS) and nitric oxide synthase (NOS) on the blood vascular system, contrasting healthy and dysfunctional endothelial pathways. The 'Healthy Endothelium' branch (left) shows stimuli activating the alpha/beta/gamma complex, Akt, and eNOS, leading to nitric oxide (NO) production via SIRT1 mediation. This triggers the sGC-cGMP pathway in smooth muscle cells (SMC), resulting in relaxation, vasodilation, anti-proliferation, anti-inflammation, and thrombolysis. In contrast, the 'Dysfunctional Endothelium' branch (right) shows how risk factors like dyslipidemia, obesity, and diabetes, alongside OS and inflammation, inhibit eNOS activity despite L-Arginine availability. This lack of NO leads to vasoconstriction, thrombosis, and atherosclerosis. The diagram includes a cross-sectional illustration of a narrowed artery showing the progression of cardiovascular disease (CVD). Supplemental boxes list the three isoforms of NOS (eNOS/NOS3, nNOS/NOS1, and iNOS/NOS2) and summarize the effects of OS, including inflammation and vascular remodeling. This visual serves as an educational tool for understanding molecular mechanisms of hypertension and endothelial health.
antianginal drugs beta blocker mechanism heart rate oxygen demand
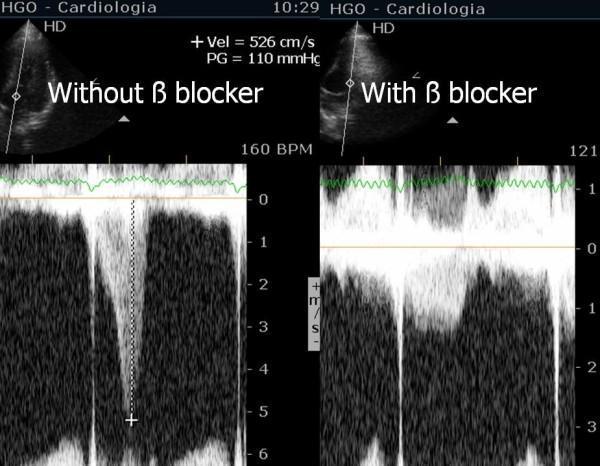
This Comparison Chart displays two side-by-side Doppler echocardiography panels illustrating the hemodynamic effects of beta-blocker therapy on intraventricular gradients (IVG). Each panel contains a B-mode ultrasound image at the top (parasternal long-axis view) and a continuous-wave Doppler spectral waveform below. The left panel ('Without beta blocker') shows a high-velocity, late-systolic peaking envelope reaching a peak velocity (Vel) of 526 cm/s and a pressure gradient (PG) of 110 mmHg, characteristic of dynamic left ventricular outflow tract obstruction. The recorded heart rate is 160 BPM. The right panel ('With beta blocker') demonstrates a significant reduction in the Doppler envelope's depth and intensity, reflecting a lower flow velocity and decreased pressure gradient, with a corresponding heart rate reduction to 121 BPM. This comparison illustrates the clinical use of beta-blockers to manage exertional intraventricular gradients and systolic anterior motion (SAM) of the mitral valve by reducing contractility and heart rate. The educational focus is on pharmacological intervention for dynamic cardiac obstruction and the interpretation of Doppler spectral displays in sports cardiology and hemodynamics.
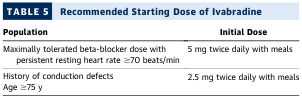
<table> <tr> <th></th> <th>Population</th> <th>Initial Dose</th> </tr> <tr> <td></td> <td>Maximally tolerated beta-blocker dose with persistent resting heart rate ≥70 beats/min</td> <td>5 mg twice daily with meals</td> </tr> <tr> <td></td> <td>History of conduction defects<br>Age ≥75 y</td> <td>2.5 mg twice daily with meals</td> </tr> </table>
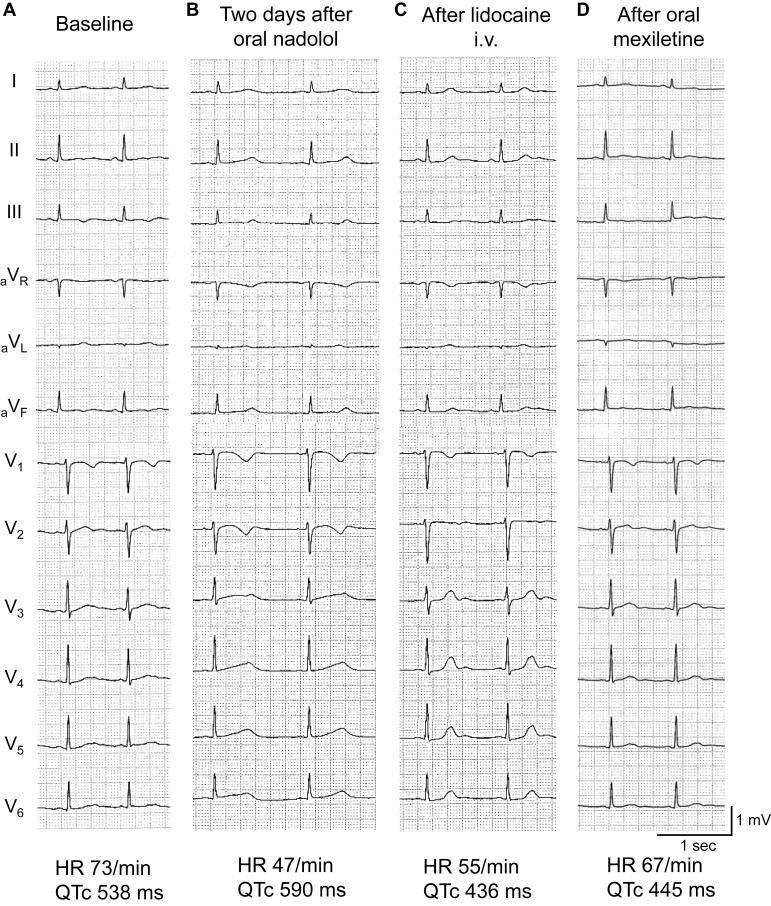
This Comparison Chart displays a 12-lead electrocardiogram (ECG) series from a patient with Long QT Syndrome Type 2 (LQT2), demonstrating the pharmacological effects of different agents on cardiac repolarization. The image is divided into four panels (A-D) representing sequential clinical states. Panel A (Baseline) shows a heart rate (HR) of 73 bpm and a markedly prolonged QTc of 538 ms, with notched T-waves characteristic of LQT2. Panel B (Two days after oral nadolol) illustrates drug-induced bradycardia (HR 47 bpm) and further QTc prolongation to 590 ms, highlighting the risk of beta-blocker-induced bradycardia in certain LQT2 phenotypes. Panel C (After lidocaine i.v.) shows a dramatic shortening of the QTc to 436 ms, demonstrating the efficacy of Class Ib antiarrhythmic agents in blocking late sodium currents (INaL). Panel D (After oral mexiletine) confirms a sustained near-normal QTc of 445 ms at a HR of 67 bpm. This visual sequence serves as an educational tool for identifying LQT2 morphology, understanding the Bazett-corrected QT interval relationship with heart rate, and evaluating the paradoxical response to beta-blockers versus the therapeutic benefit of sodium channel blockers.
🫀 Antianginal Drugs - Complete Pharmacology Notes
PART 1: BASIC PHYSIOLOGY YOU MUST KNOW FIRST
What is Angina Pectoris?
The Core Equation
Angina occurs when: O₂ Demand > O₂ Supply
| Determinant | What increases it | Drug strategy |
|---|---|---|
| Heart Rate | Exercise, stress | Beta-blockers, CCBs, ivabradine |
| Contractility | Sympathetic activation | Beta-blockers, CCBs |
| Wall Tension | Preload (filling pressure) + Afterload (resistance) | Nitrates (preload), CCBs (afterload) |
Key memory trick: MVO₂ (myocardial oxygen consumption) = Heart Rate × Contractility × Wall Tension. All antianginal drugs reduce at least one of these.
Myocardial O₂ Supply depends on:
- Coronary blood flow (duration of diastole matters - the heart fills coronaries mainly during diastole)
- O₂ carrying capacity of blood
- Coronary vessel diameter (vasospasm reduces it)
PART 2: TYPES OF ANGINA
| Type | Cause | Key Feature | Drug of Choice |
|---|---|---|---|
| Stable (Classic/Effort) | Fixed atherosclerotic obstruction | Triggered by exertion, relieved by rest | Beta-blockers + Nitrates |
| Unstable (ACS) | Plaque rupture + thrombus | Rest pain, increasing frequency/severity | Antiplatelet + Anticoagulant + Nitrates |
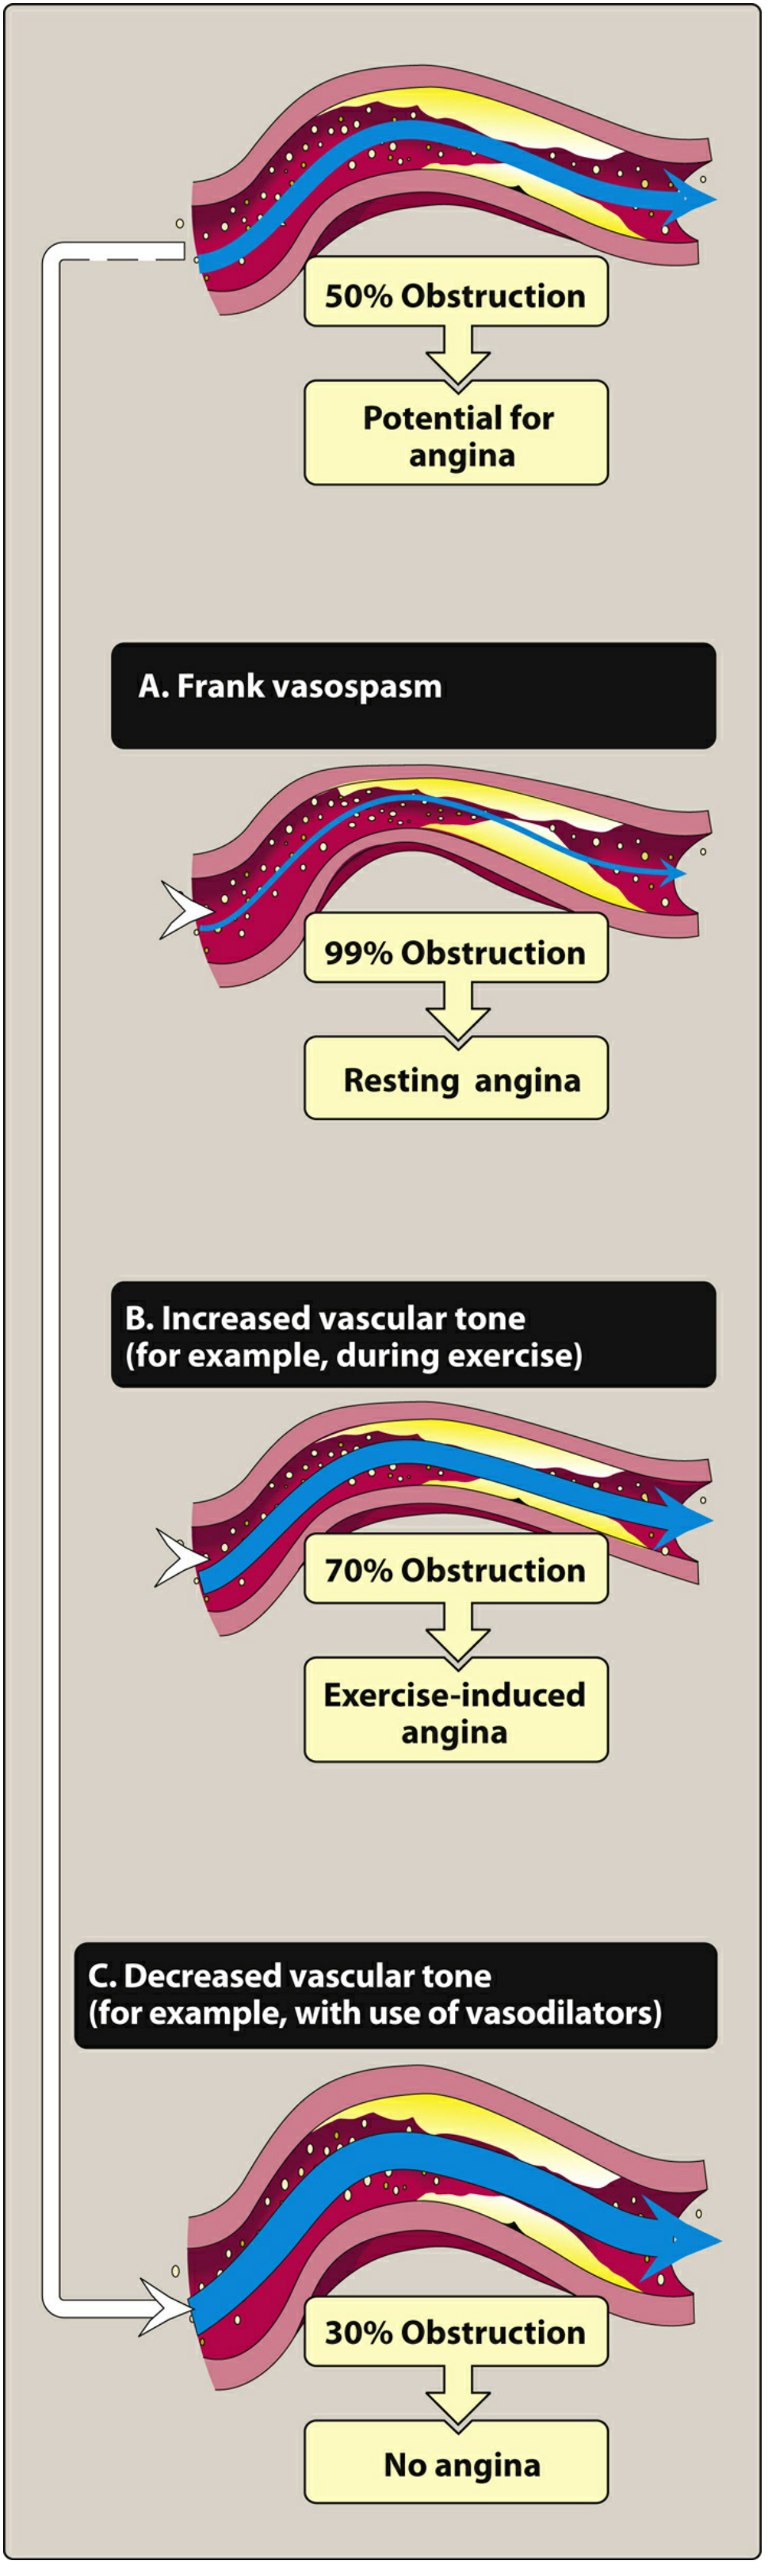
| Variant (Prinzmetal's) | Coronary vasospasm | Occurs at rest, often at night/early morning | CCBs + Nitrates (NO beta-blockers) |
Exam tip: Beta-blockers are CONTRAINDICATED in Prinzmetal's (vasospastic) angina because blocking beta-2 receptors leaves alpha-mediated vasoconstriction unopposed, worsening spasm.
PART 3: ANTIANGINAL DRUG CLASSES
- Organic Nitrates
- Beta-Blockers
- Calcium Channel Blockers (CCBs)
- Newer agents (Ranolazine, Ivabradine, Nicorandil, Trimetazidine)
CLASS 1: ORGANIC NITRATES
Examples
- Nitroglycerin (GTN)
- Isosorbide dinitrate (ISDN)
- Isosorbide mononitrate (ISMN)
- Amyl nitrite
Mechanism of Action

- Nitrate enters smooth muscle cell
- Converted to nitric oxide (NO) (requires thiol groups - sulfhydryl -SH)
- NO activates guanylate cyclase
- GTP → cGMP (increases)
- cGMP activates protein kinase G
- Dephosphorylation of myosin light chain → smooth muscle RELAXATION
Hemodynamic Effects
| Vessel | Effect | Clinical Result |
|---|---|---|
| Veins (capacitance) - PRIMARY | Dilation | ↓ venous return → ↓ preload → ↓ wall tension → ↓ MVO₂ |
| Arterioles - at high dose | Dilation | ↓ afterload → ↓ MVO₂ |
| Coronary arteries | Dilation | ↑ blood supply, relieves vasospasm |
| Large conductance arteries | ↑ compliance | Further preload reduction |
Key point from Goodman & Gilman: The PRIMARY antianginal benefit of nitrates is preload reduction (venodilation), NOT direct coronary dilation. This was proven by studies showing nitroglycerin injected directly into coronary arteries did NOT abort angina, but sublingual administration did.
Pharmacokinetics & Preparations
| Drug | Route | Onset | Duration | Key Use |
|---|---|---|---|---|
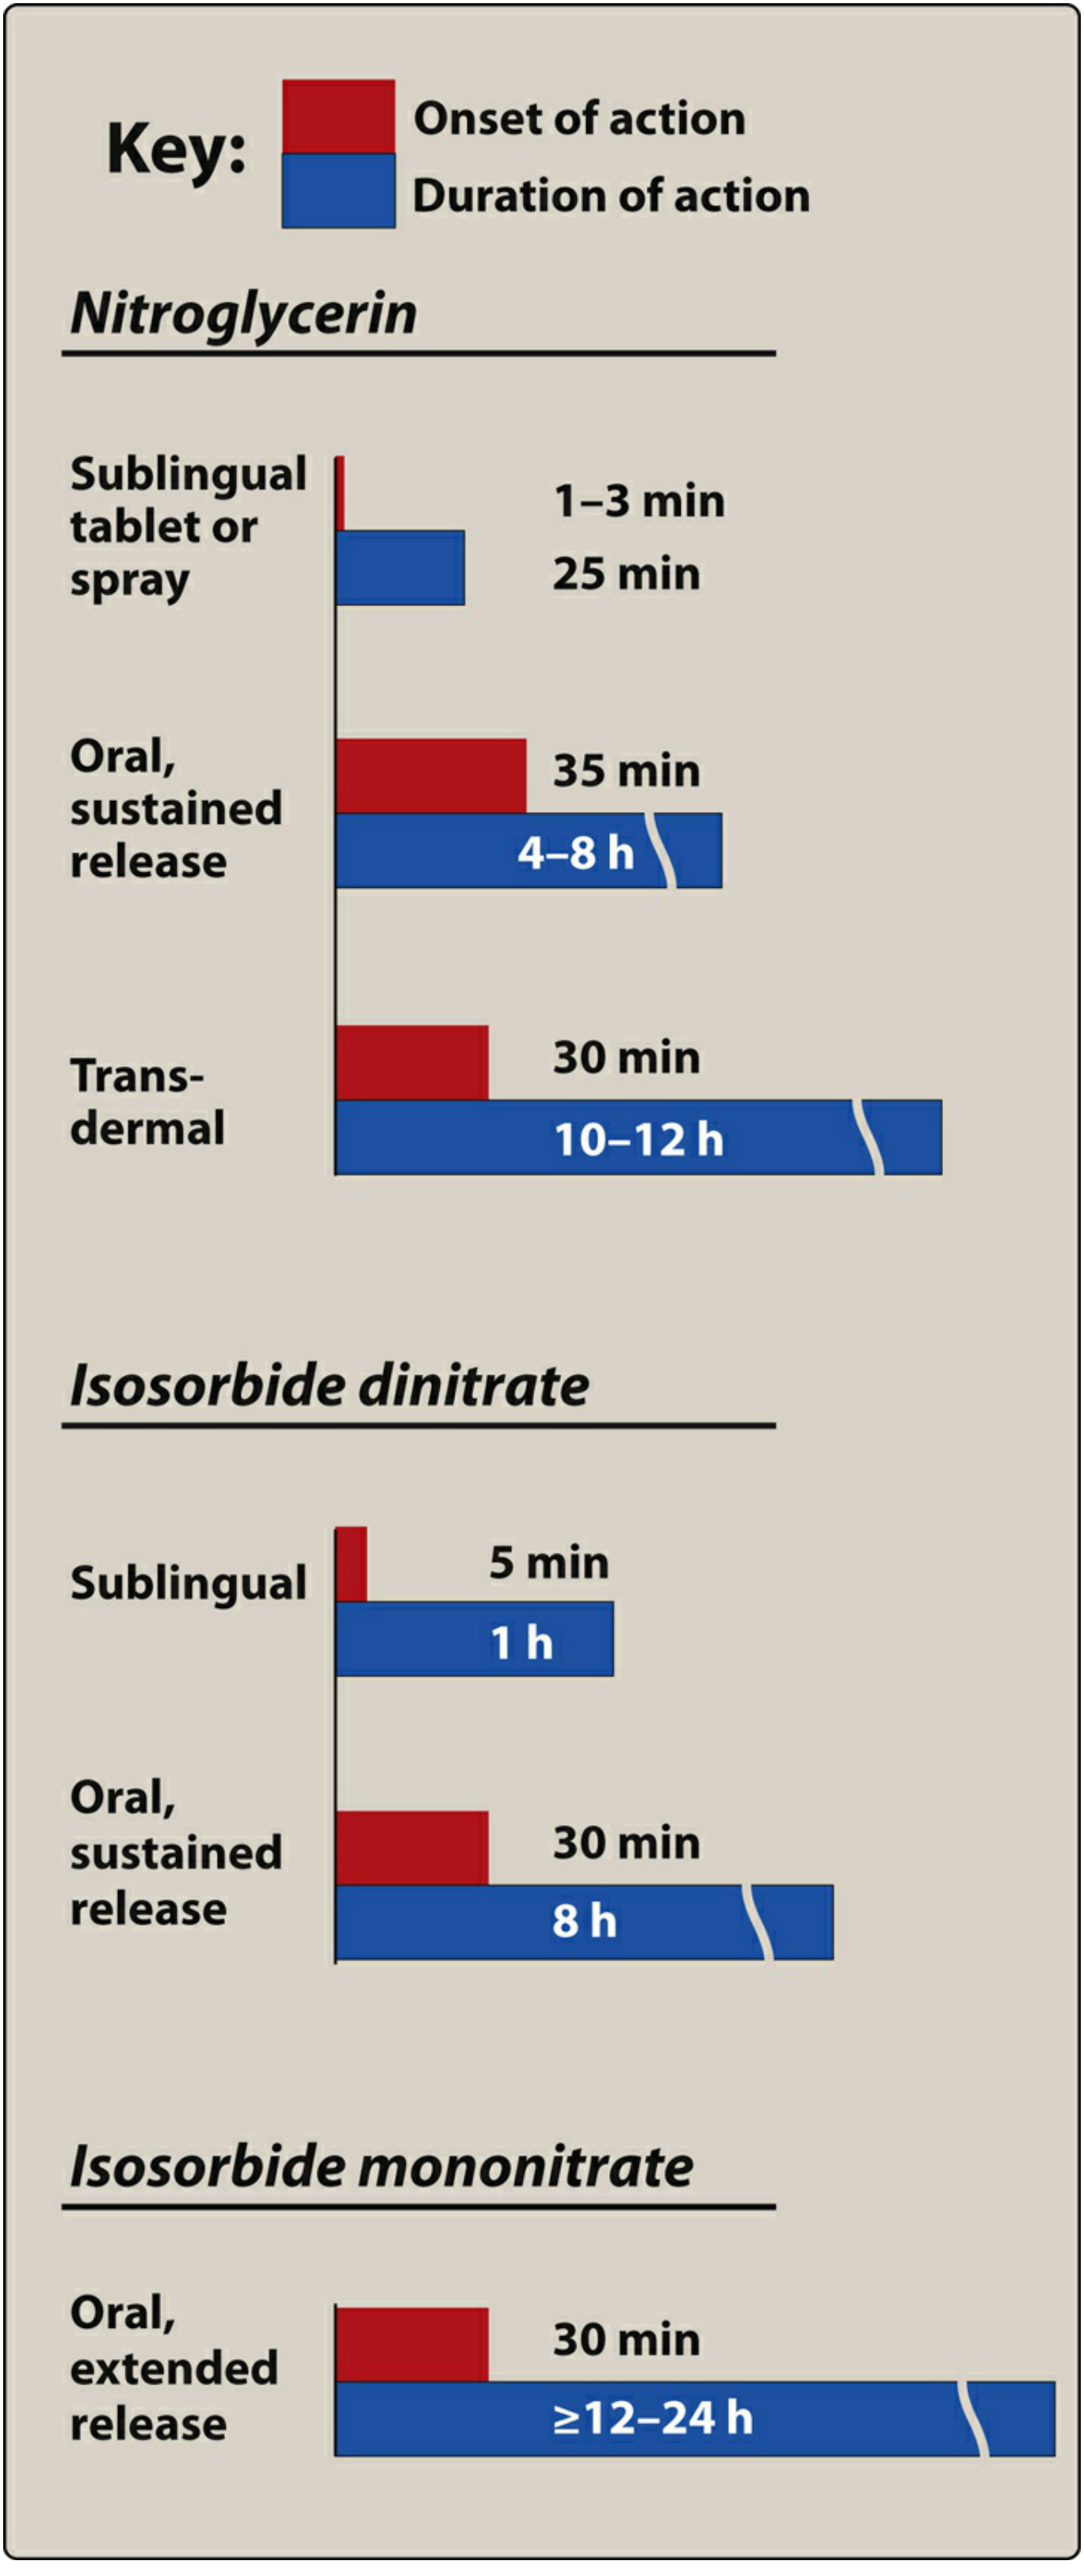
| GTN sublingual tablet/spray | SL | 1-3 min | 25 min | Acute attack |
| GTN transdermal patch | Skin | 30 min | 10-12 h | Prophylaxis |
| GTN oral SR | Oral | 35 min | 4-8 h | Prophylaxis |
| ISDN sublingual | SL | 5 min | 1 h | Acute / short prophylaxis |
| ISDN oral SR | Oral | 30 min | 8 h | Prophylaxis |
| ISMN oral extended-release | Oral | 30 min | ≥12-24 h | Prophylaxis |
Why is GTN given sublingually? It undergoes extensive first-pass metabolism in the liver. SL route bypasses the liver and allows direct entry into systemic circulation. ISMN does NOT have significant first-pass metabolism, so it has good oral bioavailability.
Adverse Effects
- Headache (most common) - throbbing, due to meningeal vessel dilation
- Postural hypotension + reflex tachycardia (high doses)
- Facial flushing
- Methemoglobinemia (with large doses of amyl nitrite)
Tolerance
- Develops rapidly ("tachyphylaxis") due to depletion of sulfhydryl groups needed for NO generation
- Prevention: Provide a 10-12 hour nitrate-free interval (usually overnight, when demand is low)
- Exception: Variant angina worsens early morning (circadian catecholamine surge) → nitrate-free interval should be in the AFTERNOON, not overnight
Critical Drug Interaction
CONTRAINDICATED with PDE-5 inhibitors (sildenafil, tadalafil, vardenafil): Both increase cGMP → additive severe hypotension and myocardial infarction risk. Wait at least 6 hours after nitrate before taking a PDE-5 inhibitor.
CLASS 2: BETA-BLOCKERS
Examples
- Cardioselective (β₁): Atenolol, Metoprolol, Bisoprolol ← preferred
- Non-selective (β₁+β₂): Propranolol, Nadolol
- Avoid agents with ISA (intrinsic sympathomimetic activity) like pindolol in angina
Mechanism
| Effect | Result | Benefit |
|---|---|---|
| ↓ Heart rate (negative chronotropy) | ↓ MVO₂ | Reduces angina episodes |
| ↓ Contractility (negative inotropy) | ↓ MVO₂ | Reduces oxygen demand |
| ↓ Blood pressure | ↓ afterload | Further ↓ MVO₂ |
| Longer diastole | ↑ coronary filling time | ↑ O₂ supply |
The diastole trick: Slower heart rate = longer diastole = more time for coronary filling (since coronary perfusion happens in diastole). This is an EXTRA benefit unique to beta-blockers.
Best Use Cases
- Stable effort angina: FIRST-LINE (most important class for long-term prophylaxis)
- Post-MI patients (reduces reinfarction + mortality)
- Angina + hypertension + tachycardia
Contraindications in Angina
- Vasospastic (Prinzmetal's) angina - can worsen coronary spasm
- Severe asthma (use cardioselective if must use)
- Decompensated heart failure
- Severe bradycardia or AV block
Clinical Warning: Rebound Effect
CLASS 3: CALCIUM CHANNEL BLOCKERS (CCBs)
Basic Physiology
- Cardiac muscle contraction (SA node, AV node, ventricles)
- Vascular smooth muscle contraction
Two Subclasses
A. Dihydropyridines (DHP) - "Vascular selective"
| Drug | Main Effect | Use in Angina |
|---|---|---|
| Amlodipine | Arteriolar vasodilation | Stable + Variant angina |
| Nifedipine (extended release) | Potent vasodilation | Variant angina, stable angina |
- Mainly affect vascular smooth muscle
- Minimal cardiac conduction effects
- Reflex tachycardia possible (especially with short-acting nifedipine) - use extended-release only
- Short-acting dihydropyridines (immediate-release nifedipine) are AVOIDED in CAD - associated with increased mortality after MI
B. Non-Dihydropyridines (Non-DHP) - "Cardioselective"
| Drug | Key Actions | Special Uses |
|---|---|---|
| Verapamil | ↓ HR, ↓ AV conduction, ↓ contractility, vasodilation | Stable + Variant angina; also arrhythmias |
| Diltiazem | ↓ HR, ↓ AV conduction, coronary dilation | Stable + Variant angina (especially vasospasm) |
Memory trick: Verapamil = Very cardiac (heart effects dominant). Amlodipine = Arteries only.
CCBs in Different Angina Types
| Angina Type | Best CCB |
|---|---|
| Stable effort angina | Amlodipine or diltiazem |
| Variant (vasospastic) | All CCBs work - amlodipine, diltiazem, verapamil |
| Angina + arrhythmia | Verapamil or diltiazem |
| Angina + heart failure (reduced EF) | Amlodipine only (non-DHPs worsen HF) |
Adverse Effects
| Drug | Key Adverse Effects |
|---|---|
| All CCBs | Hypotension, peripheral edema |
| Dihydropyridines | Reflex tachycardia, flushing, headache |
| Verapamil | Constipation (most common), bradycardia, AV block, gingival hyperplasia |
| Diltiazem | Bradycardia, edema |
Contraindications
- Non-DHPs contraindicated in: HF with reduced EF, severe bradycardia, AV block
- Verapamil + Beta-blocker combination: dangerous additive bradycardia/AV block
CLASS 4: NEWER ANTIANGINAL AGENTS
A. Ranolazine
- Mechanism: Inhibits late sodium current (I_Na_late) → reduces intracellular Na⁺ → reduces Ca²⁺ overload via Na⁺/Ca²⁺ exchanger → ↓ diastolic tension, ↓ cardiac work
- Key advantage: Does NOT affect heart rate or blood pressure - can be used when hemodynamic effects are not desirable
- Use: Add-on therapy for stable angina refractory to standard treatment
- Adverse effects: QT prolongation, constipation, headache, dizziness, edema
- Drug interactions: Avoid with strong CYP3A4 inducers/inhibitors; can increase digoxin and simvastatin levels
B. Ivabradine
- Mechanism: Selectively blocks the I_f (funny) current (hyperpolarization-activated Na⁺ channel) in the SA node only → reduces heart rate (bradycardic effect) WITHOUT affecting contractility or conduction
- Use: Stable angina when beta-blockers are contraindicated or not tolerated; heart failure with preserved HR
- Advantage: Pure rate reduction with no negative inotropy
- Adverse effects: Visual disturbances (phosphenes/flashes of light), bradycardia
C. Nicorandil
- Mechanism: Dual action:
- Nitrate component → NO release → cGMP → vasodilation (venodilation + coronary dilation)
- Potassium channel (K_ATP) activator → hyperpolarization → smooth muscle relaxation
- Use: Stable angina (especially in Europe/Asia; not FDA-approved in USA)
- Adverse effects: Headache, hypotension, oral/GI ulcers
D. Trimetazidine
- Mechanism: Metabolic modulator - pFOX inhibitor (partially inhibits fatty acid oxidation via LC-3KAT inhibition) → shifts metabolism from fatty acid oxidation to glucose oxidation → more ATP per O₂ consumed → better ischemia tolerance
- Use: Stable angina (approved in Europe, NOT in USA)
- Key point: Does NOT affect hemodynamics (heart rate, BP unchanged)
PART 4: SELECTION OF THERAPY BY ANGINA TYPE
Stable (Effort) Angina
Acute attack → Sublingual GTN (always prescribe to ALL angina patients)
Prophylaxis →
  Step 1: Beta-blocker (FIRST-LINE, reduces mortality post-MI)
  Step 2: Add long-acting nitrate OR CCB (amlodipine/diltiazem)
  Step 3: Add ranolazine (third-line add-on)
Vasospastic (Prinzmetal's) Angina
AVOID beta-blockers
USE: CCBs (first-line) + Long-acting nitrates
Nitrate-free interval: afternoon (NOT overnight, as spasm peaks at night/early AM)
Unstable Angina / ACS
Immediate: Aspirin + Heparin + Nitrates (IV for pain) + Beta-blockers
Add: Statin, ACE inhibitor
Refer for revascularization evaluation
PART 5: QUICK COMPARISON TABLE
| Feature | Nitrates | Beta-Blockers | CCBs (DHP) | CCBs (Non-DHP) | Ranolazine |
|---|---|---|---|---|---|
| ↓ Heart rate | ✗ (reflex ↑) | ✓✓ | ✗ (reflex ↑) | ✓✓ | ✗ |
| ↓ Contractility | ✗ | ✓✓ | ✗ | ✓ | ✗ |
| ↓ Preload | ✓✓ | ✗ | ✗ | ✗ | ✗ |
| ↓ Afterload | ✓ (high dose) | ✓ | ✓✓ | ✓ | ✗ |
| Coronary dilation | ✓✓ | ✗ | ✓✓ | ✓✓ | ✗ |
| Useful in vasospasm | ✓✓ | ✗ (contraindicated) | ✓✓ | ✓✓ | ✗ |
| Post-MI mortality ↓ | ✗ | ✓✓ | ✗ | ✗ | ✗ |
PART 6: HIGH-YIELD EXAM FACTS
- Drug of choice for ACUTE angina attack → Sublingual nitroglycerin (onset 1-3 min)
- First-line prophylaxis for stable angina → Beta-blocker
- Contraindicated in Prinzmetal's angina → Beta-blockers
- Nitrate-free interval → 10-12 hours to prevent tolerance
- Never combine nitrates with → PDE-5 inhibitors (sildenafil etc.)
- Never combine verapamil/diltiazem with → Beta-blockers (risk of complete AV block)
- Short-acting nifedipine is avoided in CAD → Increases mortality after MI
- Ranolazine does NOT → Affect heart rate or blood pressure
- Ivabradine inhibits → I_f (funny) current in SA node only
- Nitrates major benefit is → Preload reduction (venodilation), not direct coronary dilation
- Tolerance to nitrates due to → Depletion of sulfhydryl (-SH) groups
- Agents with ISA (pindolol) are AVOIDED → ISA causes background beta-stimulation, negating the heart rate-lowering benefit
- Reflex tachycardia from nitrates → Can be countered by co-prescribing a beta-blocker
- Why is beta-blocker the BEST prophylactic? → Only class that reduces post-MI mortality; also lengthens diastole, improving coronary perfusion