
Etiopathology and risk factor of peptic ulcer
peptic ulcer pathogenesis H pylori mechanism diagram
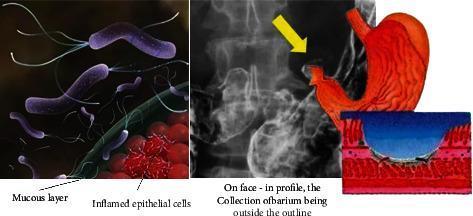
This composite educational illustration details the pathogenesis and clinical imaging of a peptic ulcer. The left panel features a pathophysiology diagram showing purple, flagellated Helicobacter pylori bacteria penetrating a green mucous layer to reach red, inflamed epithelial cells, representing the primary infectious cause of gastric irritation. The center-right panel integrates diagnostic and anatomical content, featuring a grayscale barium swallow X-ray alongside a red anatomical diagram of the stomach. A yellow arrow on the X-ray identifies a barium collection outside the normal gastric outline, characteristic of an ulcer crater (ulcer niche). A supplementary cross-sectional illustration provides a microscopic view of the ulcer, depicting a blue-shaded crater penetrating through the mucosal and submucosal layers into the underlying tissue. This graphic is intended for medical students to understand the transition from microbial infection to macroscopic tissue damage and its subsequent appearance in radiological imaging.
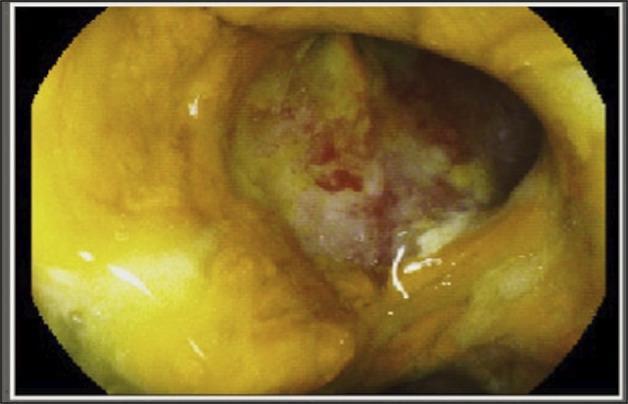
This endoscopic image shows a large, 'punched-out' peptic ulcer located at the junction of the first and second portions of the duodenum. The ulcer is approximately 2 cm in diameter and features sharply demarcated, well-defined borders. The base of the ulcer is covered with a heterogeneous layer of yellowish-white necrotic debris and fibrin, interspersed with multiple erythematous spots and punctate stigmata of recent hemorrhage, suggesting active inflammation or recent bleeding. The surrounding duodenal mucosa appears edematous and mildly hyperemic compared to healthy tissue, with a loss of clear vascular architecture near the ulcer's edge. This clinical finding is characteristic of H. pylori-induced duodenal ulceration. The image serves as a diagnostic tool for identifying gastrointestinal bleeding sources and assessing the severity of mucosal damage in the upper digestive tract.
![Summary : This flowchart outlines treatment pathways for upper gastrointestinal symptoms in regions with high prevalence of H. pylori and limited health-care resources, focusing on decision points for alarm symptoms, peptic ulcer disease suspicion, and H. pylori testing and eradication.
flowchart:
# Nodes :
• Alarm symptoms? (rectangle)
• Investigate (endoscopy or other tests) as indicated and if available (rectangle)
• Symptoms suggestive of peptic ulcer disease? (rectangle, vertical orientation)
• Empirical H. pylori eradication therapy (rectangle)
– Avoid clarithromycin and levofloxacin if prior use
– Ensure full duration and dose
– Compliance support
• H. pylori test if available and affordable (noninvasive or invasive) (rectangle)
• Investigate as indicated and if available (endoscopy or other tests) (rectangle)
• Clinical assessment of outcome (rectangle)
• Case-by-case evaluation (rectangle)
– Empirical H. pylori eradication therapy
– H. pylori test
– Other strategies
# Connectors :
• Alarm symptoms? → YES → Investigate (endoscopy or other tests)
• Symptoms suggestive of peptic ulcer disease? → YES → Empirical H. pylori eradication therapy
• Empirical H. pylori eradication therapy → Clinical assessment of outcome
• Clinical assessment of outcome → BETTER → [end]
• Clinical assessment of outcome → NOT BETTER → Case-by-case evaluation
• Symptoms suggestive of peptic ulcer disease? → YES → H. pylori test if available and affordable
• H. pylori test if available and affordable → Investigate as indicated and if available
• Case-by-case evaluation → Empirical H. pylori eradication therapy / H. pylori test / Other strategies
# Layout :
• The flowchart is organized in a left-to-right and top-to-bottom manner.
• The leftmost column contains the initial decision nodes (Alarm symptoms? and Symptoms suggestive of peptic ulcer disease?).
• The central column contains investigation and therapy nodes.
• The rightmost column contains outcome assessment and further evaluation nodes.
• Arrows indicate YES branches and outcome-based directions (BETTER, NOT BETTER).
# Analysis :
• The flowchart prioritizes investigation for alarm symptoms and empirical H. pylori eradication therapy for suspected peptic ulcer disease.
• H. pylori testing is recommended if available and affordable, otherwise empirical therapy is used.
• Clinical assessment determines if further case-by-case evaluation is needed, with options to repeat therapy, test, or consider other strategies.
• The process is designed for resource-limited settings, emphasizing flexibility and stepwise escalation based on availability and patient response.](https://cdn.orris.care/cdss_images/GLGCA_341298_1763892024765_5546ba68-0923-4775-acb7-6dccd77f8981.png)
Summary : This flowchart outlines treatment pathways for upper gastrointestinal symptoms in regions with high prevalence of H. pylori and limited health-care resources, focusing on decision points for alarm symptoms, peptic ulcer disease suspicion, and H. pylori testing and eradication. flowchart: # Nodes : • Alarm symptoms? (rectangle) • Investigate (endoscopy or other tests) as indicated and if available (rectangle) • Symptoms suggestive of peptic ulcer disease? (rectangle, vertical orientation) • Empirical H. pylori eradication therapy (rectangle) – Avoid clarithromycin and levofloxacin if prior use – Ensure full duration and dose – Compliance support • H. pylori test if available and affordable (noninvasive or invasive) (rectangle) • Investigate as indicated and if available (endoscopy or other tests) (rectangle) • Clinical assessment of outcome (rectangle) • Case-by-case evaluation (rectangle) – Empirical H. pylori eradication therapy – H. pylori test – Other strategies # Connectors : • Alarm symptoms? → YES → Investigate (endoscopy or other tests) • Symptoms suggestive of peptic ulcer disease? → YES → Empirical H. pylori eradication therapy • Empirical H. pylori eradication therapy → Clinical assessment of outcome • Clinical assessment of outcome → BETTER → [end] • Clinical assessment of outcome → NOT BETTER → Case-by-case evaluation • Symptoms suggestive of peptic ulcer disease? → YES → H. pylori test if available and affordable • H. pylori test if available and affordable → Investigate as indicated and if available • Case-by-case evaluation → Empirical H. pylori eradication therapy / H. pylori test / Other strategies # Layout : • The flowchart is organized in a left-to-right and top-to-bottom manner. • The leftmost column contains the initial decision nodes (Alarm symptoms? and Symptoms suggestive of peptic ulcer disease?). • The central column contains investigation and therapy nodes. • The rightmost column contains outcome assessment and further evaluation nodes. • Arrows indicate YES branches and outcome-based directions (BETTER, NOT BETTER). # Analysis : • The flowchart prioritizes investigation for alarm symptoms and empirical H. pylori eradication therapy for suspected peptic ulcer disease. • H. pylori testing is recommended if available and affordable, otherwise empirical therapy is used. • Clinical assessment determines if further case-by-case evaluation is needed, with options to repeat therapy, test, or consider other strategies. • The process is designed for resource-limited settings, emphasizing flexibility and stepwise escalation based on availability and patient response.
Etiopathology and Risk Factors of Peptic Ulcer Disease
Definition
Common Sites
- First part of the duodenum (most common overall)
- Gastric antrum and lesser curve
- Stoma after gastric surgery
- Esophagus (GERD-related acid injury)
- Meckel's diverticulum (ectopic gastric epithelium)
- Ulcers characteristically occur at the junction between different epithelial types - in the epithelium least resistant to acid damage.
Etiopathology
1. Helicobacter pylori Infection
- ~70% of duodenal ulcers and ~50% of gastric ulcers worldwide are associated with H. pylori colonization
- Only 5-10% of infected individuals actually develop ulcers, indicating that host factors and strain virulence both matter
- H. pylori is neither necessary nor sufficient for PUD, but is a very strong risk factor; eradication virtually abolishes long-term ulcer relapse
- H. pylori colonizes the gastric antrum and reduces somatostatin-producing D cells
- Loss of somatostatin removes the inhibition on gastrin release → hypergastrinemia
- Elevated gastrin stimulates parietal cells → increased acid secretion (elevated BAO and MAO)
- Excess acid causes gastric metaplasia in the duodenum, which H. pylori then colonizes → inflammation → ulceration
- Damage to corpus mucosa reduces acid secretion (hypochlorhydria despite hypergastrinemia)
- Gastric ulcers form at the antral-corpus junction, where inflammation is most intense
- Disruption of the mucus-bicarbonate barrier exposes epithelium to peptic injury
- CagA (cytotoxin-associated gene A): Injected into host cells via type IV secretion system; disrupts tight junctions and cell signaling; stimulates NF-κB, TNF-α, and IL-8 → intense neutrophilic inflammation
- VacA (vacuolating cytotoxin A): Causes epithelial cell vacuolation and apoptosis; impairs mucosal integrity
- LPS and urease: Provoke innate immune responses; urease generates ammonia, which is directly toxic to epithelium
2. NSAIDs and Aspirin
- Systemic (COX inhibition): NSAIDs inhibit cyclooxygenase (COX-1 and COX-2), reducing prostaglandin synthesis. Prostaglandins are cytoprotective - they stimulate mucus and bicarbonate secretion, maintain mucosal blood flow, and promote epithelial restitution
- Local (topical injury): NSAIDs, being weak acids, become non-ionized in the acidic gastric lumen, enter epithelial cells, re-ionize ("ion trapping"), and cause direct mitochondrial damage and cell death
- NSAIDs impair platelet aggregation, promoting bleeding from any mucosal erosion
- The overall risk of serious GI events in NSAID users is >3 times that of controls, rising to 5x in patients over 60
- Age >60
- Prior GI event (ulcer or bleeding)
- High NSAID dose or multiple NSAIDs
- Concurrent corticosteroid use
- Concurrent anticoagulant use
- Concomitant H. pylori infection
3. Acid Hypersecretion
| Cause | Mechanism |
|---|---|
| H. pylori | Increases gastrin, reduces somatostatin |
| Zollinger-Ellison Syndrome | Gastrin-secreting tumor (gastrinoma) → massive, uncontrolled acid output; causes multiple ulcers in stomach, duodenum, and even jejunum |
| Antral G-cell hyperplasia | Primary hypergastrinemia |
| Systemic mastocytosis | Histamine from mast cells stimulates H2 receptors |
| Hyperparathyroidism / CRF | Hypercalcemia stimulates gastrin production |
| Parietal cell hyperplasia | Intrinsic increase in acid-secreting mass |
4. Impaired Mucosal Defense
- Mucus-bicarbonate barrier: Traps bicarbonate to neutralize acid at the epithelial surface; reduced by NSAIDs, H. pylori, smoking
- Epithelial tight junctions: Prevent back-diffusion of H⁺; disrupted by CagA, NSAIDs, bile acids
- Mucosal blood flow: Supplies nutrients and removes toxins; impaired by smoking, shock, NSAIDs
- Prostaglandins (PGE2, PGI2): Stimulate mucus/bicarbonate, maintain microcirculation; suppressed by NSAIDs and corticosteroids
- Epithelial restitution and growth factors (EGF, TGF-α): Allow rapid repair of superficial injury
Risk Factors Summary
Major / Established Risk Factors
| Risk Factor | Mechanism |
|---|---|
| H. pylori infection | Inflammation, acid hypersecretion, mucosal barrier disruption |
| NSAID / Aspirin use | Prostaglandin suppression, direct epithelial injury |
| Cigarette smoking | ↑ acid secretion; ↓ mucosal blood flow; ↓ prostaglandin production; ↓ pancreaticoduodenal bicarbonate; smokers have ~2x the PUD risk of non-smokers |
| Zollinger-Ellison Syndrome | Uncontrolled gastrin → massive acid |
| Stress (physiologic) | Curling's ulcer (burns), Cushing's ulcer (head trauma/raised ICP) |
Significant Contributing Risk Factors
| Risk Factor | Notes |
|---|---|
| Age > 60 | Reduced mucosal prostaglandins; polypharmacy; higher NSAID use |
| Male sex | Lifetime risk ~10% in males vs ~4% in females |
| Corticosteroids | Suppress prostaglandin synthesis; impair healing (especially in combination with NSAIDs) |
| Alcohol-related cirrhosis | Increased PUD risk; exact mechanism unclear |
| Chronic renal failure | Hypercalcemia → ↑ gastrin → ↑ acid |
| Hyperparathyroidism | Hypercalcemia → ↑ gastrin |
| COPD | Associated with increased PUD; mechanisms not fully clear |
| Crack cocaine use | Linked to juxtapyloric ulcers with propensity to perforate |
| Blood group O | H. pylori uses blood group O antigens as adhesion receptors |
| Psychological stress | Probable role, difficult to quantify |
Factors Often Cited but Not Confirmed
| Factor | Evidence |
|---|---|
| Alcohol | May exacerbate mucosal damage with NSAIDs, but is not an independent risk factor for PUD |
| Spicy foods / coffee | No strong confirmatory data; may worsen symptoms |
| Dietary factors | Diet high in salt/preserved foods increases H. pylori-related gastric cancer risk, but direct PUD link is weak |
Gastric vs. Duodenal Ulcer: Pathophysiologic Distinction
| Feature | Duodenal Ulcer | Gastric Ulcer |
|---|---|---|
| Acid secretion | Elevated (high BAO/MAO) | Normal or low |
| H. pylori pattern | Antral-predominant gastritis | Pan-gastritis or corpus-predominant |
| Gastrin | Elevated | Elevated (but acid output is low) |
| Mucosal defense | Relatively preserved | Significantly impaired |
| Malignant risk | Very low | Must exclude cancer (biopsy required) |
| Johnson classification | - | Type I (lesser curve), II (body + DU), III (prepyloric), IV (near GEJ), V (NSAID-induced) |
Key Takeaways
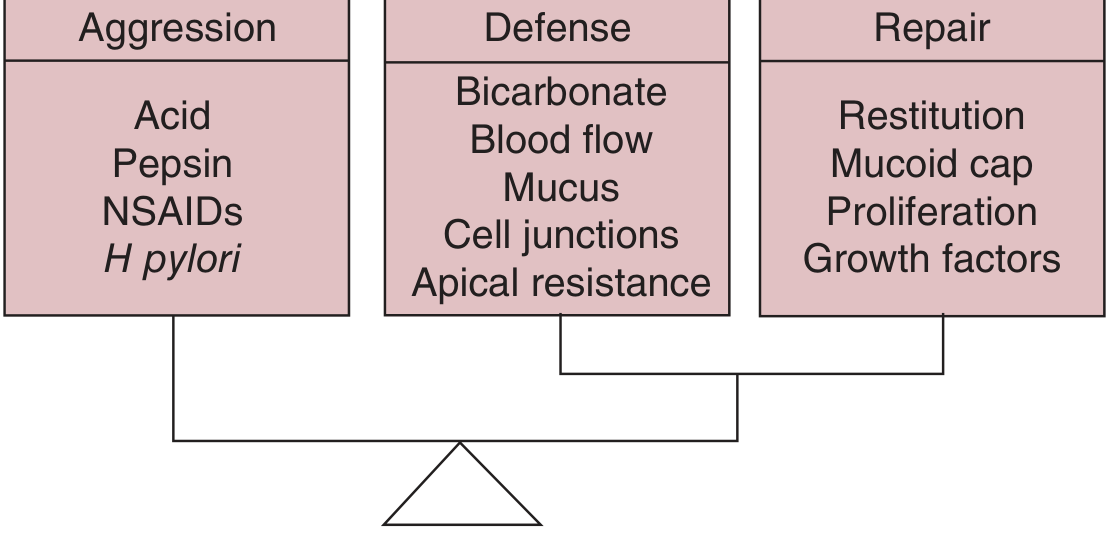
- The central pathophysiologic event is an imbalance between aggressive forces (acid, pepsin, H. pylori, NSAIDs) and mucosal defenses (mucus, bicarbonate, blood flow, prostaglandins, repair).
- H. pylori + NSAIDs account for the vast majority of peptic ulcers; addressing these is the cornerstone of treatment.
- Acid is necessary but often not solely sufficient; mucosal defense failure is equally important.
- Risk stratification should consider age, NSAID use, H. pylori status, smoking, and concomitant medications.
- Schwartz's Principles of Surgery, 11th Ed. (Chapter 26 - Stomach)
- Harrison's Principles of Internal Medicine, 22nd Ed. (Chapters 168 & 335)
- Robbins & Kumar Basic Pathology (Chapter 13)
- Bailey & Love's Short Practice of Surgery, 28th Ed. (Chapter 67)