
Difference bw an infection of bacterial and viral ethiology
bacterial vs viral infection clinical differences diagnosis laboratory
bacterial vs viral infection comparison diagram CBC blood smear
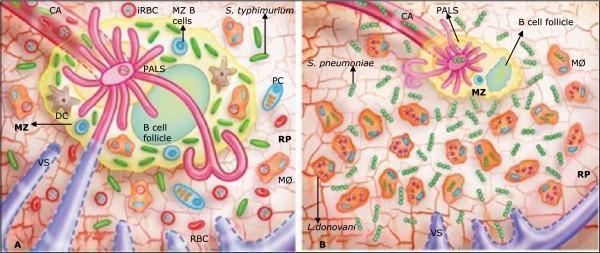
Educational pathophysiology diagram comparing splenic tissue responses during dual parasitic and bacterial co-infections in a rodent model. Panel A illustrates Plasmodium chabaudi and Salmonella typhimurium co-infection, showing preserved splenic architecture. Key features include an intact white pulp (WP) with visible periarteriolar lymphoid sheaths (PALS) and B cell follicles, a functional marginal zone (MZ) containing MZ B cells and dendritic cells (DC), and infected red blood cells (iRBC) localized in the red pulp (RP). Panel B depicts Leishmania donovani and Streptococcus pneumoniae co-infection characterized by significant atrophy of the white pulp and marginal zone. In this state, L. donovani amastigotes are seen phagocytosed within large numbers of red pulp macrophages (MØ). Due to the lack of a functional marginal zone, S. pneumoniae bacteria are redistributed to the red pulp. Anatomical landmarks labeled include the central arteriole (CA) and venous sinuses (VS). This comparison demonstrates how different parasitic infections can either preserve or disrupt the spleen's immunological compartments and its subsequent capacity to manage secondary bacterial invasions.
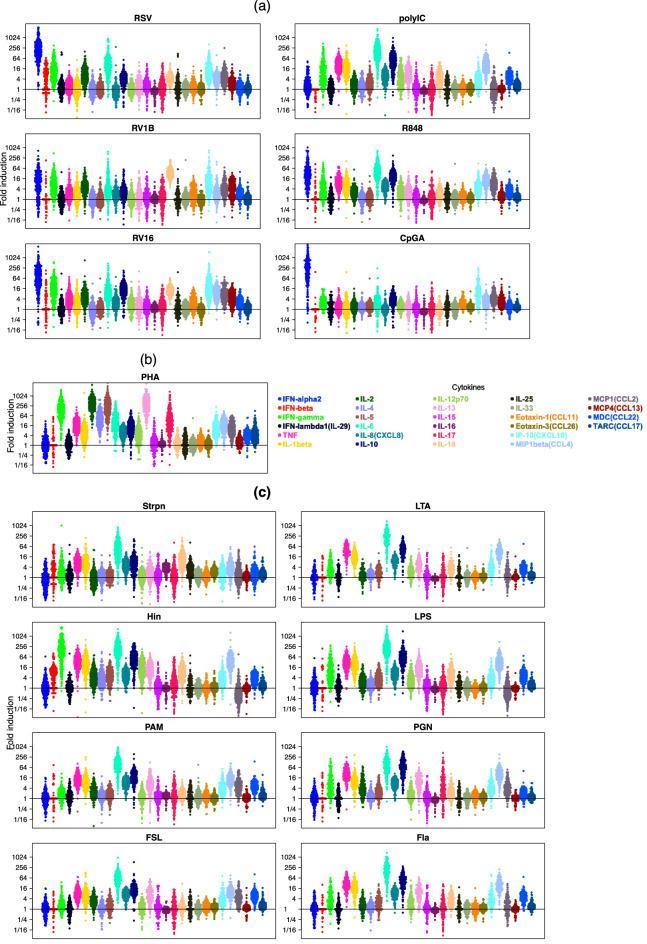
This Comparison Chart illustrates cytokine response patterns in human peripheral blood mononuclear cells (PBMCs) across various stimuli. The data is presented in three panels of beeswarm plots: (a) Viral stimuli including RSV, RV1B, RV16, polyIC, R848, and CpGA; (b) T-cell stimulus PHA; and (c) Bacterial stimuli including Strpn, LTA, Hin, LPS, PAM, PGN, FSL, and Fla. The y-axis represents 'Fold induction' (response/media) on a logarithmic scale from 1/16 to 1024, with a horizontal reference line at 1. The chart tracks 28 distinct cytokines, color-coded and labeled (e.g., IFN-alpha2, IL-6, TNF, IFN-gamma, and CXCL10/IP-10). Each dot represents an individual subject (child), revealing inter-individual variability. Viral stimuli demonstrate strong induction of interferon-alpha2 and IP-10, while bacterial stimuli show potent induction of pro-inflammatory cytokines like IL-6 and TNF. PHA exhibits a distinct signature favoring T-cell cytokines like IL-2 and IFN-gamma. The diagram serves as an educational tool for comparing innate and adaptive immune signaling pathways and understanding the specificity of pathogen-associated molecular patterns (PAMPs).
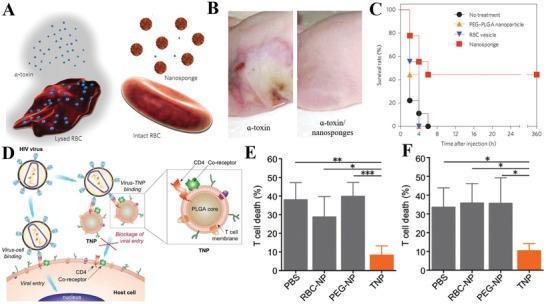
A multi-panel medical illustration and data graphic exploring cell membrane-coated nanoplatforms for detoxification and viral neutralization. Panel A is a pathophysiology diagram showing a comparison between a lysed red blood cell (RBC) under alpha-toxin attack and an intact RBC protected by nanosponges. Panel B contains clinical photographs of skin lesions in a murine model, contrasting severe necrosis and discoloration from alpha-toxin against significantly reduced damage with alpha-toxin/nanosponge treatment. Panel C is a Kaplan-Meier survival plot showing improved survival rates for the nanosponge group over 360 hours. Panel D is a schematic of T-cell membrane-coated nanoparticles (TNPs) acting as decoys to intercept HIV viruses, preventing binding to host CD4 receptors. Panels E and F are bar charts showing T-cell death percentages across various treatments (PBS, RBC-NP, PEG-NP, and TNP), with TNP demonstrating a statistically significant reduction in cell death (p < 0.05 to p < 0.001). The content illustrates advanced nanomedicine strategies for treating inflammation, bacterial toxins, and viral infections.
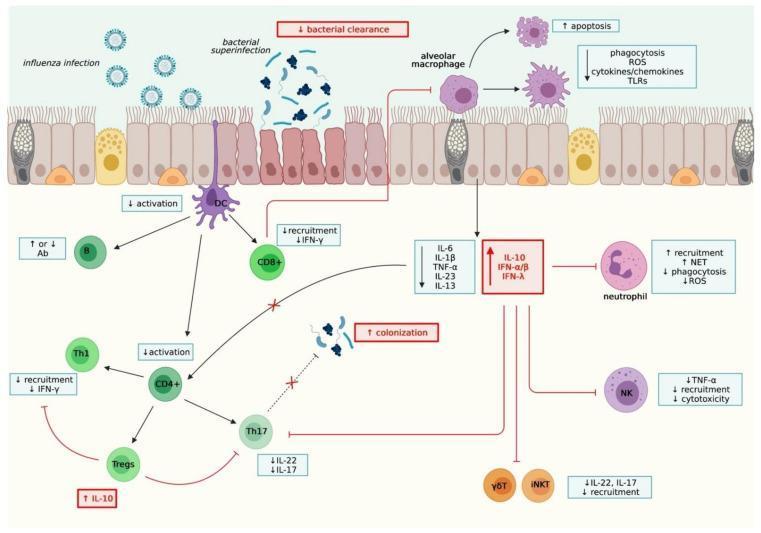
This pathophysiology diagram illustrates the immunological mechanisms of viral-bacterial co-infection in the respiratory epithelium, specifically detailing how influenza infection predisposes the host to bacterial superinfection. The schematic shows a ciliated epithelial layer undergoing damage from influenza virions and subsequent bacterial colonization. Key innate immune responses include alveolar macrophages exhibiting increased apoptosis and decreased phagocytosis, ROS, and TLR signaling. Neutrophils show increased recruitment and NET production but impaired phagocytic capacity. The adaptive immune response is depicted with decreased activation of dendritic cells (DCs), leading to suppressed CD8+ T cell recruitment and IFN-γ production. Cytokine signaling pathways highlight a shift toward an anti-inflammatory state, characterized by increased IL-10, IFN-α/β, and IFN-λ, which inhibit Th17, γδT, and iNKT cell recruitment and their production of IL-17 and IL-22. NK cell recruitment and cytotoxicity are also downregulated. The overall pedagogical focus is on how virus-induced immune dysregulation leads to decreased bacterial clearance and increased colonization, demonstrating the complex interplay between innate and adaptive immunity during secondary infections.
Bacterial vs. Viral Infection: Key Differences
1. Etiology & Structure
| Feature | Bacterial | Viral |
|---|---|---|
| Organism type | Prokaryote (cell wall, ribosomes, DNA+RNA) | Obligate intracellular parasite (protein coat + nucleic acid only) |
| Replication | Independent binary fission | Hijacks host cell machinery |
| Size | 1-10 micrometers | 0.02-0.3 micrometers |
| Treatable with antibiotics? | Yes | No |
2. Clinical Presentation
| Feature | Bacterial | Viral |
|---|---|---|
| Onset | Often sudden, abrupt | Usually gradual |
| Symptom pattern | Localized (e.g., pus, swelling, redness, warmth) | Diffuse/systemic (body aches, fatigue, widespread) |
| Fever | Typically high and sustained | Variable - can be low-grade or spiking; often self-limiting |
| Exudate | Purulent (yellowish/green pus) | Serous or clear (watery discharge) |
| Lymph nodes | Tender, localized adenopathy | Generalized lymphadenopathy common |
| Duration | Worsens without treatment | Often self-limiting (resolves in days to ~2 weeks) |
| Secondary spread | Can spread to bloodstream (bacteremia/sepsis) | Can allow secondary bacterial superinfection |
Examples of bacterial infections: strep throat (white patches + high fever), bacterial pneumonia, UTIs, skin abscesses. Examples of viral infections: influenza, common cold (rhinovirus), mononucleosis (EBV), measles.
3. Laboratory Differences (Crucial for Diagnosis)
CBC (Complete Blood Count)
| Parameter | Bacterial | Viral |
|---|---|---|
| WBC | Elevated (15,000-20,000+; leukemoid reaction up to 100,000/µL in severe cases) | Normal or mildly elevated |
| Predominant cell | Neutrophilia - PMNs dominate | Lymphocytosis - lymphocytes dominate |
| Band cells (left shift) | Present - immature neutrophils released from marrow | Absent |
| Toxic granulation | May be present in neutrophils | Absent |
| Atypical lymphocytes | Rare | Common (especially EBV - "reactive" lymphocytes) |
"Most bacterial infections induce an increase in the blood neutrophil count, called neutrophilia. Viral infections, such as infectious mononucleosis, mumps, and German measles, cause an absolute increase in the number of lymphocytes." - Robbins Pathology
"Pyogenic bacteria especially induce neutrophilia. More virulent agents result in higher neutrophil counts." - Henry's Clinical Diagnosis, p. 725
Inflammatory Markers
| Marker | Bacterial | Viral |
|---|---|---|
| CRP | Markedly elevated (>100 mg/L typical; >500 mg/L strongly suggests infection) | Mildly elevated or normal |
| Procalcitonin (PCT) | Elevated (>0.5 ng/mL) - highly specific for bacterial sepsis | Low or undetectable (usually <0.1 ng/mL) |
| ESR | Elevated | Mildly elevated or normal |
| IL-6 | Elevated | Elevated but different pattern |
"CRP had an estimated pooled sensitivity of 75% and specificity of 67% for differentiating bacterial infection from non-infected causes of inflammation... infection was present in 88% of cases with a CRP value greater than 500 mg/L." - Tietz Lab Medicine, p. 3205
Cytokine Signature
- Bacterial pathogens drive strong IL-6, TNF-alpha, IL-1 production via LPS/TLR-4 signaling
- Viral pathogens are characterized by strong interferon-alpha and IP-10 (CXCL10) responses - critical for antiviral defense
Cultures & Specific Tests
| Test | Bacterial | Viral |
|---|---|---|
| Blood/urine culture | Can grow organism | Negative |
| Gram stain | Positive | Negative |
| Sensitivity/resistance | Antibiogram available | N/A |
| PCR / serology | Less commonly needed | Essential (viral PCR, antigen tests, antibody titers) |
| Throat swab culture | GABHS grows on agar | Negative culture; need rapid antigen or PCR |
4. Pathophysiology
- Pathogens release toxins (exotoxins/endotoxins like LPS)
- Trigger massive neutrophil recruitment and pyogenic inflammation
- Can form abscesses (localized pus collections)
- Can invade bloodstream causing bacteremia and sepsis
- Stimulate acute-phase proteins (CRP, fibrinogen, complement)
- Virus replicates intracellularly - lyses host cells or causes immune-mediated damage
- Triggers innate immune response via interferons (IFN-alpha/beta) - inhibits viral replication in adjacent cells
- CD8+ cytotoxic T-cells kill infected cells
- Humoral (antibody) response develops over days-weeks
- Can downregulate host immune function and predispose to secondary bacterial infection (e.g., influenza -> S. pneumoniae pneumonia)
5. Treatment
| Approach | Bacterial | Viral |
|---|---|---|
| Antibiotics | Yes - targeted by culture/sensitivity | Absolutely not - no effect, promotes resistance |
| Antivirals | No (except for some co-infections) | Selected infections (oseltamivir for flu, acyclovir for HSV, antiretrovirals for HIV) |
| Supportive care | Often needed alongside antibiotics | Primary treatment (rest, fluids, antipyretics) |
| Corticosteroids | Occasionally used adjunctively (e.g., meningitis) | Sometimes (e.g., croup, severe COVID-19) |
6. Quick Summary Table
| Feature | Bacterial | Viral |
|---|---|---|
| Onset | Sudden | Gradual |
| Exudate | Purulent | Serous/clear |
| WBC | High neutrophils, left shift | Normal/lymphocytosis |
| CRP/PCT | High | Low/normal |
| Cultures | Positive | Negative |
| Fever | High, sustained | Variable, self-limiting |
| Antibiotics | Work | Don't work |
| Duration | Worsens untreated | Usually self-limiting |
Suggestion of c reactive protein and Alfa feto protein
C-reactive protein CRP acute phase reactant inflammation
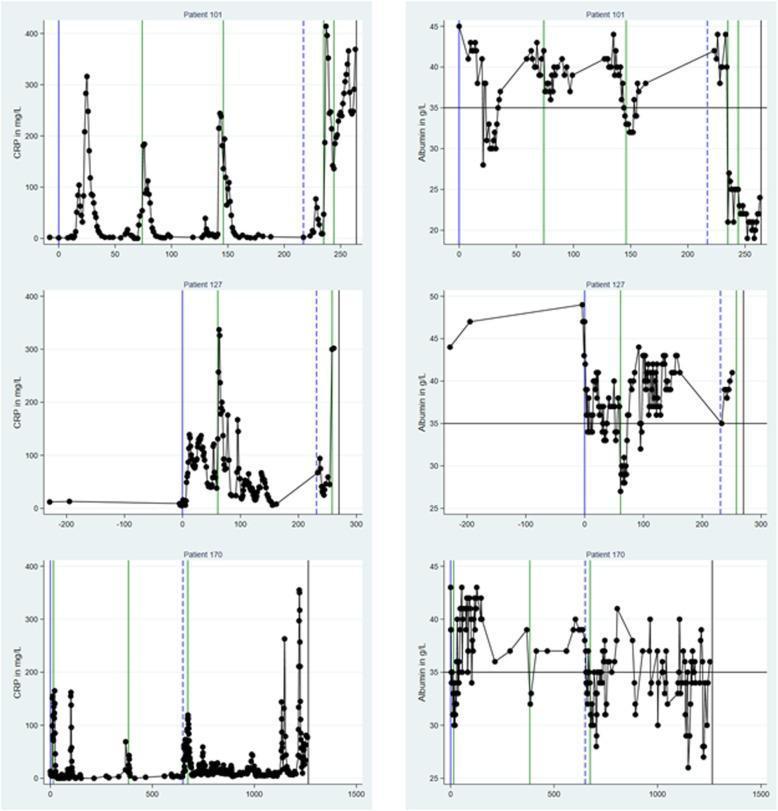
This Comparison Chart illustrates the longitudinal trajectories of C-reactive protein (CRP) and plasma albumin (PA) levels in three individual patients (101, 127, 170) following a diagnosis of acute myeloid leukemia (AML). The figure consists of six subplots arranged in a 3x2 grid. The left column measures CRP levels (mg/L), representing a positive acute-phase reactant, while the right column measures plasma albumin (g/L), representing a negative acute-phase reactant. The x-axis tracks time (days) relative to AML diagnosis (Day 0, solid blue line). Key clinical milestones are marked with vertical indicators: solid blue lines for diagnosis, solid green lines for bacteraemic episodes, dashed blue lines for AML relapse, and solid black lines for death. A horizontal reference line at 35 g/L in the albumin plots indicates the threshold for hypoalbuminemia. The graphs demonstrate a typical inverse relationship during inflammatory events, such as infections or disease progression, where sharp spikes in CRP correspond to significant drops in albumin. This data is relevant for hematology and oncology, highlighting the use of these biomarkers in monitoring disease activity, infection risk, and nutritional/prognostic status in leukemia patients.
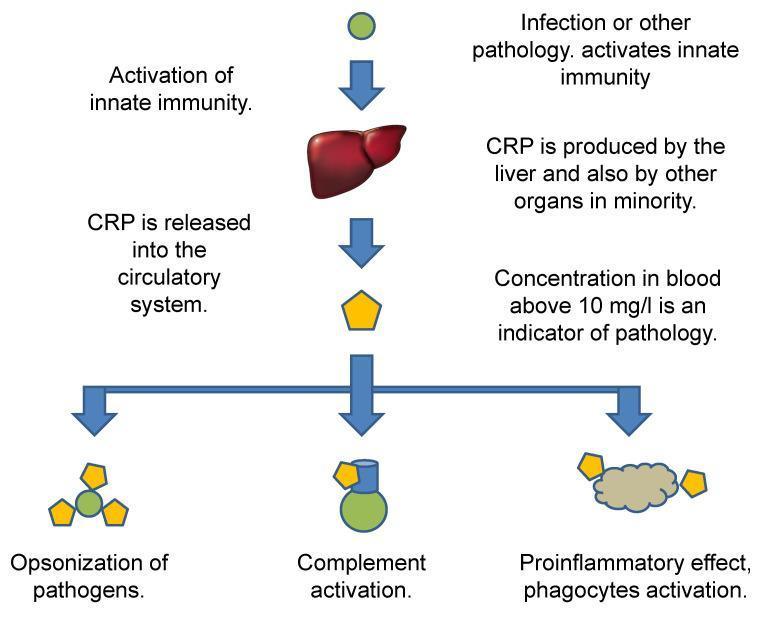
A pathophysiology flow diagram illustrating the synthesis, systemic release, and immunological functions of C-reactive protein (CRP). The pathway begins with an initial trigger, such as infection or other pathology, leading to the activation of innate immunity. The central vertical axis shows the liver as the primary site of CRP production, followed by the release of CRP (represented by a yellow pentagon) into the circulatory system. Text annotations specify that a blood concentration above 10 mg/L serves as a clinical indicator of pathology. The lower portion of the diagram branches into three distinct downstream effects: 1) Opsonization of pathogens, showing CRP bound to a green spherical target; 2) Complement activation, depicted by CRP interacting with a protein complex; and 3) Pro-inflammatory effects, specifically the activation of phagocytes (represented by a grey irregular cellular structure). This schematic summarizes CRP's role as an acute-phase reactant in human host defense and its diagnostic utility in clinical medicine.
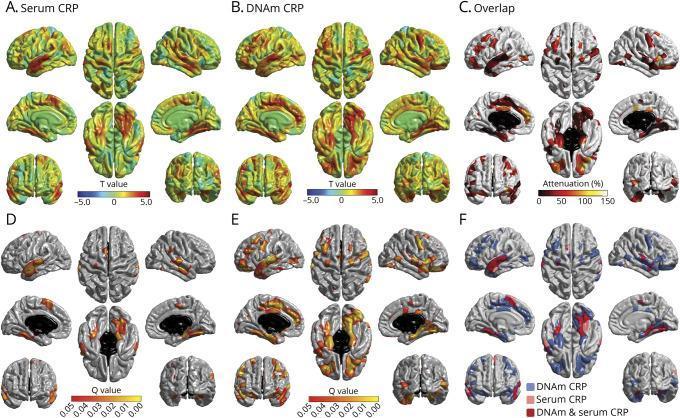
This composite diagnostic image presents neuroimaging data analyzing the association between C-reactive protein (CRP) measures and regional brain cortical volume. It features several panels of brain surface reconstructions in lateral, dorsal, ventral, and sagittal views. Panels A and B display T-maps for Serum CRP and DNA methylation (DNAm) CRP, respectively, with a color scale from blue (-5.0) to red (5.0) representing the magnitude of association; DNAm CRP shows more widespread and intense positive associations across the frontal and temporal lobes. Panels D and E show corresponding Q-value significance maps, highlighting regions where lower cortical volume significantly correlates with inflammation. Panel C illustrates percentage attenuation when controlling for serum CRP. Panel F is a conjunction plot demonstrating the spatial overlap: pink regions indicate unique associations with serum CRP, blue regions indicate unique associations with DNAm CRP (prominent in frontal and parietal regions), and red regions show areas of shared association between both measures. This visual serves to compare stable epigenetic inflammatory markers against acute serum protein levels in the context of neurodegenerative atrophy.
C-Reactive Protein (CRP) & Alpha-Fetoprotein (AFP): Clinical Guide
PART 1 - C-Reactive Protein (CRP)
What Is It?
- Tietz Textbook of Laboratory Medicine, p. 3205
Structure & Function
- Pentameric protein that migrates in the gamma region on serum protein electrophoresis (can produce a small pseudoparaprotein band)
- Acts as an opsonin - binds pathogens and damaged cells, then activates complement and promotes phagocytosis
- Amplifies the inflammatory cascade by inducing additional cytokines
Kinetics
| Event | Timing |
|---|---|
| Starts rising | 6-12 hours after insult |
| Peaks | 2-3 days |
| Falls with treatment | Proportional to resolution |
Reference Ranges
| Test | Normal | Elevated (Pathologic) |
|---|---|---|
| Standard CRP | < 8 mg/L | > 10 mg/L = pathology |
| High-sensitivity CRP (hsCRP) | < 1 mg/L (low CV risk) | 1-3 mg/L (intermediate); > 3 mg/L (high CV risk) |
Clinical Indications (When to Request CRP)
- Differentiates bacterial vs. viral infection: sensitivity 75%, specificity 67%
- CRP > 500 mg/L = infection present in 88% of cases
- Used to guide antibiotic duration (discontinue when CRP falls 75% from peak)
- Combined CRP + procalcitonin gives 90% NPV for ruling out bacterial infection in children
- Rheumatoid arthritis, SLE, IBD - monitors disease activity and response to therapy
- Useful when ESR is unreliable (e.g., anemia, hypergammaglobulinemia)
- hsCRP is an independent predictor of ischemic heart disease
- The JUPITER trial showed rosuvastatin reduces MACE in patients with low LDL but elevated hsCRP (>2 mg/L)
- The CANTOS trial confirmed that reducing inflammation (via canakinumab targeting IL-1β) reduces cardiovascular events
- Fuster and Hurst's The Heart, 15th Edition
- Guides step-down from IV to oral antibiotics in bone/joint infections
- Monitors surgical site infections, VAP, bloodstream infections
- Elevated CRP favors antibiotic prescribing in acute exacerbations (especially when sputum purulence is present)
Limitations
- Non-specific: any inflammation elevates it (trauma, malignancy, autoimmune disease)
- Affected by liver dysfunction (single-organ source - low CRP in liver failure may be falsely reassuring)
- Seasonal variation (highest in winter)
PART 2 - Alpha-Fetoprotein (AFP)
What Is It?
- Yolk sac (primary early source)
- Fetal hepatocytes
- Fetal GI tract and kidneys (minor)
- Peaks in the second trimester
- Falls sharply after birth; reaches adult normal range by ~1 year of age
- Henry's Clinical Diagnosis, p. 369
Normal Values
| Population | AFP Level |
|---|---|
| Adults (non-pregnant) | < 10 ng/mL (< 10 IU/mL) |
| Pregnancy (varies by gestational age) | Rises progressively; reference range is gestational-age specific |
| Newborn | Extremely high, falls over first year |
Clinical Indications (When to Request AFP)
- AFP is elevated in > 90% of HCC patients
- At levels > 400 ng/mL: high probability of HCC (but tumor is usually widespread at this point)
- Screening cutoff in cirrhosis: 20 ng/mL gives sensitivity 52.9%, specificity 93.3%, PPV 69.8%
- Combined AFP + ultrasound screening improves sensitivity from 75% to near 100% in hepatitis B/C patients
- Serial AFP monitoring post-resection detects recurrence
- AFP + DCP (des-gamma-carboxy prothrombin) together reliably predicts survival in recurrent HCC
- Henry's Clinical Diagnosis, p. 369
- Elevated in yolk sac tumors (endodermal sinus tumors) and embryonal carcinomas
- Used alongside hCG + LDH for:
- Staging
- Monitoring response to chemotherapy
- Detecting recurrence (surveillance every few months for 2 years)
- Tietz Lab Medicine; Berek & Novak's Gynecology
| Condition | Maternal Serum AFP |
|---|---|
| Neural tube defects (open spina bifida, anencephaly) | High (leaks through open defect) |
| Down syndrome (Trisomy 21) | Low AFP |
| Normal pregnancy | Progressively elevated (gestational-age dependent) |
| Multiple gestation | Elevated (more fetal tissue) |
- AFP is part of the Triple Test: AFP + unconjugated estriol + hCG (screens for Down syndrome and NTDs)
- Quad test adds inhibin A
- AFP may be immunosuppressive - thought to prevent fetal rejection by maternal immune system
- Henry's Clinical Diagnosis; Creasy & Resnik's Maternal-Fetal Medicine
- AFP transiently rises (typically 100-200 ng/mL) after acute hepatic injury due to regenerating hepatocytes
- Elevated in hepatitis, cirrhosis - this limits its specificity for HCC at lower thresholds
- Does NOT rise after surgical liver resection (regeneration alone is insufficient to cause elevation)
- Sertoli-Leydig cell tumors of the ovary
- Rare infantile liver tumors (hepatoblastoma)
Quick Comparison: CRP vs. AFP
| Feature | CRP | AFP |
|---|---|---|
| Type | Acute-phase reactant (inflammatory) | Tumor / fetal marker |
| Produced by | Liver (in response to IL-6) | Fetal liver, yolk sac |
| Primary use | Detect inflammation/infection | Screen/monitor HCC, germ cell tumors |
| Rises in | Infection, autoimmune, trauma, cancer | HCC, germ cell tumors, NTDs, liver disease |
| Falls with | Treatment of underlying cause | Successful cancer treatment |
| Pregnancy | Normal or slightly elevated | Normally elevated (gestational-age dependent) |
| Half-life | ~19 hours | ~5 days |
| Specificity | Low (many causes raise it) | Moderate (elevated in many liver diseases, not just HCC) |
| Combined utility | + Procalcitonin for infection | + hCG + LDH for testicular tumors |