
Low protein can cause pedal edema?
pedal edema hypoalbuminemia low protein mechanism
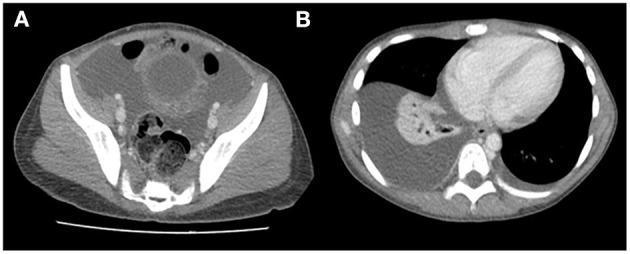
This clinical imaging figure consists of two axial CT scan slices (A and B) demonstrating systemic fluid overload manifestations. Image A is a cross-sectional view of the abdomen/pelvis showing significant ascites, characterized by low-density fluid collection surrounding the bowel loops and internal organs. Additionally, there is marked subcutaneous edema in the lumbar and abdominal wall regions, appearing as thickened, spongy tissue with increased density compared to normal fat. Image B is a thoracic CT slice showing bilateral pleural effusions. The right-sided effusion is more prominent, presenting as a large, crescent-shaped, low-density fluid accumulation in the posterior and lateral pleural space, resulting in compressive atelectasis of the adjacent lung parenchyma. The left side shows a smaller rim of pleural fluid. These findings are clinically significant for pathologies causing severe hypoalbuminemia or generalized edema, such as Menetrier's disease or protein-losing enteropathy. The content is suitable for medical students and radiologists to recognize the visual signs of polyserositis and soft tissue edema on computerized tomography.
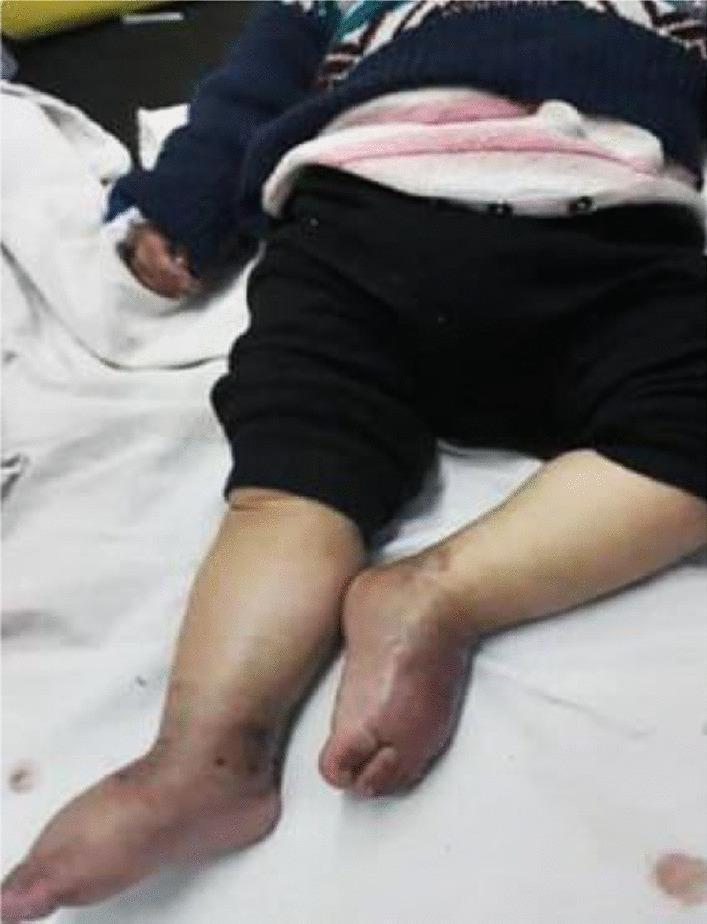
Clinical photograph of a pediatric patient (infant) demonstrating generalized pitting edema (Grade III) of the lower extremities. The photograph shows significant swelling of the bilateral legs and feet, with the skin appearing shiny, taut, and stretched. Distal skin discoloration is evident, particularly a reddish-purple hue on the dorsal surfaces of both feet. The left lower leg displays focal dark, hyperpigmented lesions near the ankle and lateral foot. These physical findings are associated with severe hypoalbuminemia (2.1 g/dl) and total protein deficiency, clinically linked to a protein-losing enteropathy in the context of ulcerative colitis. The image serves as an educational example of how systemic inflammatory bowel disease in infants can manifest with severe malnutrition and edema due to oncotic pressure changes.
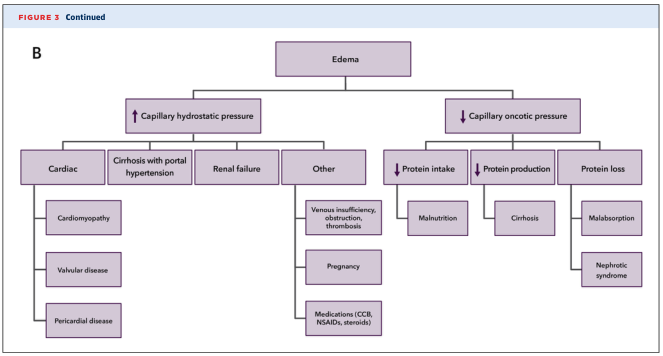
Summary : This flowchart outlines the major pathophysiological mechanisms and causes of edema, categorizing them by changes in capillary hydrostatic and oncotic pressures, and further subdividing by specific etiologies. flowchart: # Main Mechanisms : • Edema (top-level node) • Two primary branches: ↑ Capillary hydrostatic pressure, ↓ Capillary oncotic pressure ## ↑ Capillary hydrostatic pressure : • Cardiac – Cardiomyopathy – Valvular disease – Pericardial disease • Cirrhosis with portal hypertension • Renal failure • Other – Venous insufficiency, obstruction, thrombosis – Pregnancy – Medications (CCB, NSAIDs, steroids) ## ↓ Capillary oncotic pressure : • ↓ Protein intake – Malnutrition • ↓ Protein production – Cirrhosis • Protein loss – Malabsorption – Nephrotic syndrome # Nodes : • Edema (rectangle) • ↑ Capillary hydrostatic pressure (rectangle) • ↓ Capillary oncotic pressure (rectangle) • Cardiac (rectangle) • Cirrhosis with portal hypertension (rectangle) • Renal failure (rectangle) • Other (rectangle) • Cardiomyopathy (rectangle) • Valvular disease (rectangle) • Pericardial disease (rectangle) • Venous insufficiency, obstruction, thrombosis (rectangle) • Pregnancy (rectangle) • Medications (CCB, NSAIDs, steroids) (rectangle) • ↓ Protein intake (rectangle) • ↓ Protein production (rectangle) • Protein loss (rectangle) • Malnutrition (rectangle) • Cirrhosis (rectangle) • Malabsorption (rectangle) • Nephrotic syndrome (rectangle) # Connectors : • All nodes are connected hierarchically with straight lines, branching from the central "Edema" node. • Each main mechanism branches to its respective causes and sub-causes. # Layout : • Top-down hierarchical tree. • "Edema" at the top, splitting into two main branches (hydrostatic and oncotic pressure), each further subdivided. # Analysis : • The flowchart visually organizes the etiologies of edema into two main pathophysiological categories: increased capillary hydrostatic pressure and decreased capillary oncotic pressure. • Cardiac, hepatic, renal, and other systemic causes are grouped under increased hydrostatic pressure, while nutritional, hepatic, gastrointestinal, and renal protein loss are grouped under decreased oncotic pressure. • Cirrhosis appears as a cause in both main branches, highlighting its multifactorial role in edema formation. • The diagram emphasizes the importance of distinguishing between these mechanisms for clinical evaluation and management of edema.
How Low Protein Causes Pedal Edema
The Mechanism: Oncotic Pressure
- Oncotic (colloid osmotic) pressure drops
- The balance of Starling forces is disrupted
- Fluid leaks out of capillaries into the interstitial (tissue) spaces
- Due to gravity, this fluid accumulates preferentially in the feet and ankles (pedal edema)
"Because of the decrease in the plasma oncotic pressure, edema tends to develop."
Common Causes of Low Protein Leading to Pedal Edema
| Cause | Mechanism |
|---|---|
| Malnutrition / Prolonged starvation | Reduced protein intake depletes body protein stores |
| Malabsorption syndromes (e.g., celiac disease, Crohn's) | Proteins not absorbed from gut |
| Liver disease (cirrhosis) | Hepatic albumin synthesis is depressed |
| Nephrotic syndrome | Large amounts of albumin lost in urine (proteinuria) |
| Protein-losing enteropathy | Protein lost through the GI tract |
| Kwashiorkor (protein-energy malnutrition in children) | Severe protein deficiency |
Visual Summary - Pathophysiology of Edema
Clinical Note
- The albumin level threshold at which edema typically appears is serum albumin < 2.5 g/dL (normal: 3.5-5.0 g/dL)
- The edema from hypoproteinemia is characteristically bilateral, pitting, and dependent (worse in feet/ankles when standing, reduces when the legs are elevated)
- In severe cases, it can progress to anasarca (generalized body edema) or ascites