
Interpretation of ecg based on ecg made easy
ECG waveform components P wave QRS T wave labeled diagram
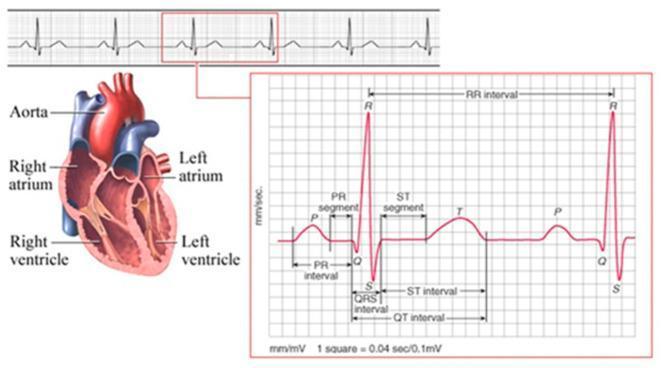
This composite educational illustration combines an anatomical diagram of the human heart with a diagnostic Electrocardiogram (ECG) tracing to demonstrate cardiac physiology. On the left, a coronal cross-section of the heart identifies the Aorta, Right Atrium, Left Atrium, Right Ventricle, and Left Ventricle. The right side features a detailed ECG waveform analysis set against a standard measurement grid (1 square = 0.04 sec / 0.1 mV). The tracing identifies key electrophysiological components: the P wave (atrial depolarization), QRS complex (ventricular depolarization), and T wave (ventricular repolarization). Critical diagnostic intervals and segments are explicitly labeled, including the PR interval, PR segment, QRS interval, ST segment, ST interval, QT interval, and the RR interval (representing the heart rate). This comparison chart and pathophysiology diagram serve as an introductory resource for understanding the correlation between cardiac anatomy and the electrical signals recorded during a cardiac cycle, suitable for basic to intermediate medical education.
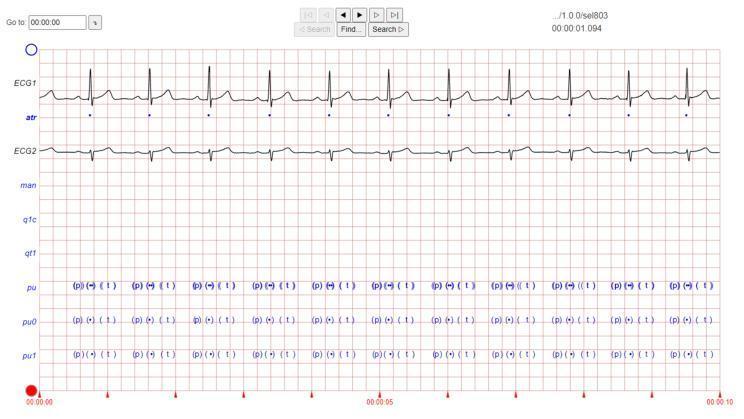
This diagnostic image displays a multi-channel electrocardiogram (ECG) tracing on a standard red-grid background, utilized for cardiac monitoring and arrhythmia analysis. The top channel, labeled 'ECG1', shows a regular sinus rhythm characterized by distinct P waves, narrow QRS complexes, and upright T waves. Below it, a marker line 'atr' indicates beat detections. The second tracing, 'ECG2', provides a different lead perspective with inverted QRS complexes. The bottom third of the image contains horizontal annotation rows labeled 'pu', 'pu0', and 'pu1', which feature repetitive textual markers like '(p)', '(+)', and '(t)' aligned with the cardiac cycles above. These annotations serve as algorithmic labels for specific components of the ECG waveform (P wave, QRS onset, and T wave termination). The overall display represents data extraction from a clinical database, likely the PhysioNet QT Database, often used for training machine learning models in automated supraventricular arrhythmia detection and cardiac signal classification.
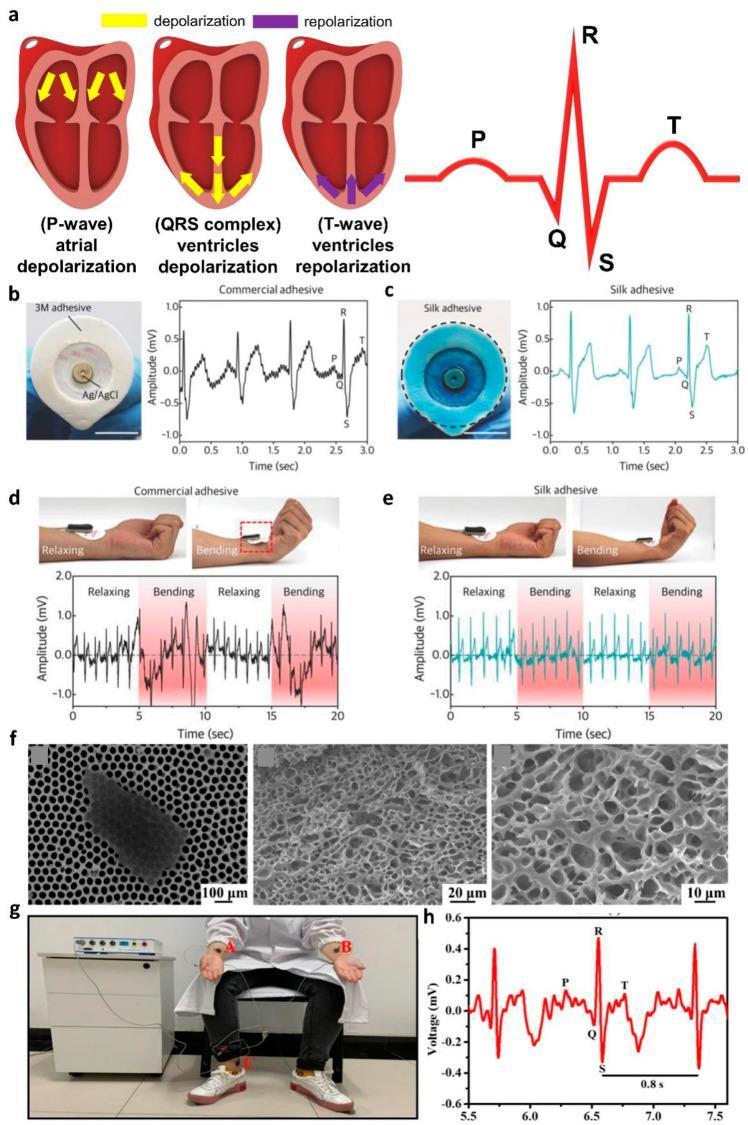
This composite educational graphic details the physiology of electrocardiography (ECG) and the performance of novel biodegradable electrodes. Section (a) provides an anatomical diagram showing the cardiac cycle stages: atrial depolarization (P-wave), ventricular depolarization (QRS complex), and ventricular repolarization (T-wave), alongside a standard labeled ECG waveform. Sections (b-e) compare commercial Ag/AgCl electrodes with novel silk fibroin adhesive electrodes, showcasing that the silk-based sensors provide higher signal-to-noise ratios and better stability during wrist movement (bending vs. relaxing). Section (f) presents Scanning Electron Microscopy (SEM) images illustrating the porous microstructure of MXene-PAA-ACC hydrogels, which facilitates water penetration and biodegradability. Section (g) displays a clinical photograph of a seated subject with electrodes placed in a standard limb lead configuration (wrists and ankles) connected to a medical monitoring console. Finally, (h) shows the resulting ECG waveform from the hydrogel electrode, demonstrating clear, distinguishable PQRST peaks suitable for clinical diagnosis.
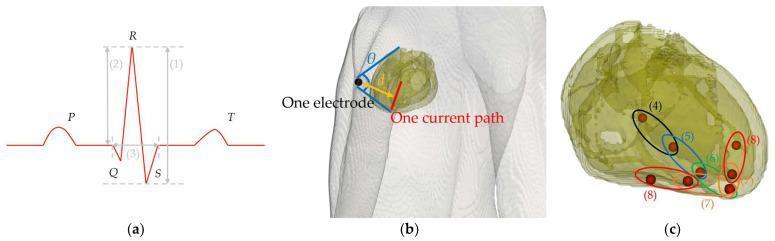
Educational diagram illustrating ECG waveform parameters and cardiac electrophysiological modeling. Panel (a) shows a standard ECG trace with labels for the P wave, QRS complex (Q, R, and S waves), and T wave. Numerical annotations indicate (1) signal amplitude (SA), (2) R-wave amplitude, and (3) QRS complex width. Panel (b) depicts a 3D anatomical thorax model showing the geometric relationship between a surface electrode and the heart's current path; it defines distance 'd' and the solid angle 'θ' subtended by the heart. Panel (c) provides an isolated view of the heart's conduction system, mapping sequential signal propagation from the A-V node and bundle of His (4-5) through the bundle branches (6) to the Purkinje fibers (7-8) using electric dipoles. This figure serves to bridge the gap between cardiac anatomy, the physics of volume conduction, and the resulting clinical electrocardiographic signals.
ECG leads placement chest limb leads diagram 12-lead
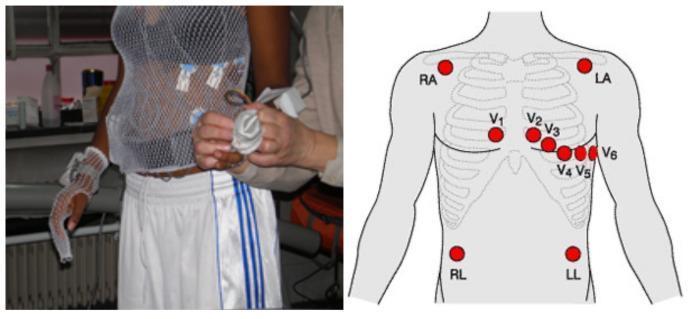
This composite educational material consists of a clinical photograph and a corresponding anatomical diagram illustrating the placement of a standard 12-lead electrocardiogram (ECG) for a cardiac stress test. On the left, a clinical photograph shows a female athlete wearing a white, see-through tubular mesh top designed to secure ECG electrodes and wiring against the skin during physical exertion. The electrodes are visible beneath the mesh, connected to thin leads. On the right, a schematic anatomical diagram of the human torso displays the precise locations for ten electrodes. The limb leads are labeled RA (Right Arm), LA (Left Arm), RL (Right Leg), and LL (Left Leg). The six precordial leads (V1–V6) are shown in their standard positions: V1 and V2 at the fourth intercostal space on either side of the sternum, V4 at the fifth intercostal space in the midclavicular line, and V3, V5, and V6 following the anatomical contour of the chest. This resource demonstrates the clinical preparation required for ergospirometry and cardiovascular monitoring.
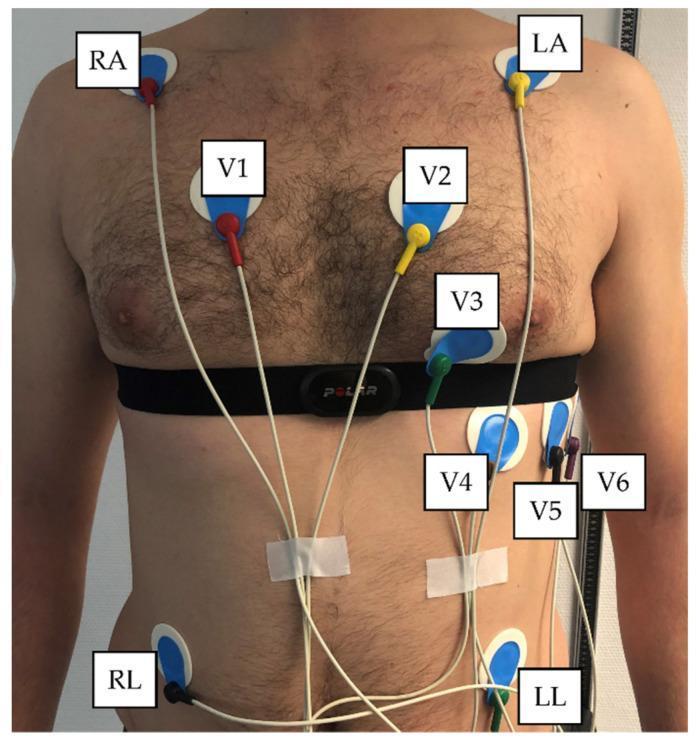
This procedural clinical photograph demonstrates the concurrent placement of a standard 12-lead electrocardiogram (ECG) and a Polar H10 heart rate sensor chest strap on a male subject. The image illustrates proper anatomical positioning for clinical and exercise physiology monitoring. The six precordial leads (V1-V6) are visible across the chest: V1 (4th intercostal space, right sternal border), V2 (4th intercostal space, left sternal border), V3 (midway between V2 and V4), V4 (5th intercostal space, mid-clavicular line), V5 (anterior axillary line), and V6 (mid-axillary line). The leads utilize standard color-coding (Red, Yellow, Green, Brown, Black, Violet). Limb leads are positioned at the shoulders (RA/LA) and the lower ribcage/abdominal area (RL/LL) to facilitate movement during testing. The Polar H10 chest strap is situated inferior to the pectoral muscles, intersecting the mid-precordial electrode line. This visual serves as an educational reference for electrode application in comparative heart rate variability (HRV) studies, highlighting the spatial relationship between traditional medical grade ECG sensors and wearable consumer fitness technology.
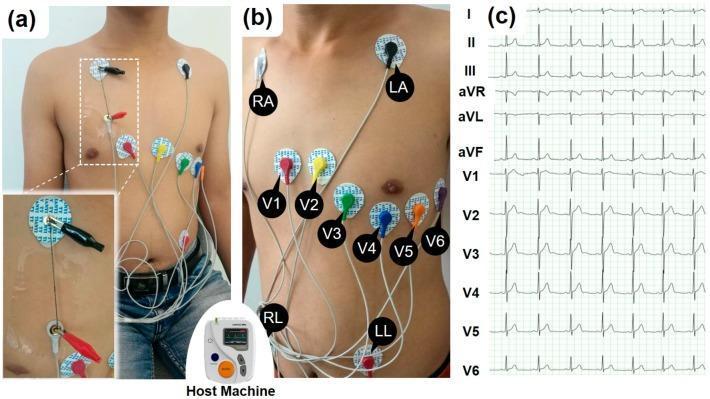
This composite educational graphic illustrates the procedural setup and resulting data for a standard 12-lead electrocardiogram (ECG/EKG). Panels (a) and (b) are clinical photographs demonstrating correct electrode placement on a male torso. The limb leads are positioned as RA (right arm/shoulder) and LA (left arm/shoulder) on the upper chest, with RL (right leg) and LL (left leg) on the lower abdomen. The precordial leads (V1-V6) follow the standard anatomical arc across the chest: V1 and V2 at the fourth intercostal space (right and left of the sternum), V4 at the fifth intercostal space (mid-clavicular line), and V3, V5, and V6 completing the transverse sequence toward the left axilla. Panel (a) includes an inset showing the experimental use of conductive carbon nanotube yarns (SWNT-CYs) connected via alligator clips to the electrodes. Panel (c) displays the resulting 12-lead ECG waveforms on a standard grid, labeled I, II, III, aVR, aVL, aVF, and V1-V6. Each lead shows distinct P-waves, QRS complexes, and T-waves, representing different electrical vectors of cardiac depolarization and repolarization.
ECG axis deviation left right normal hexaxial system
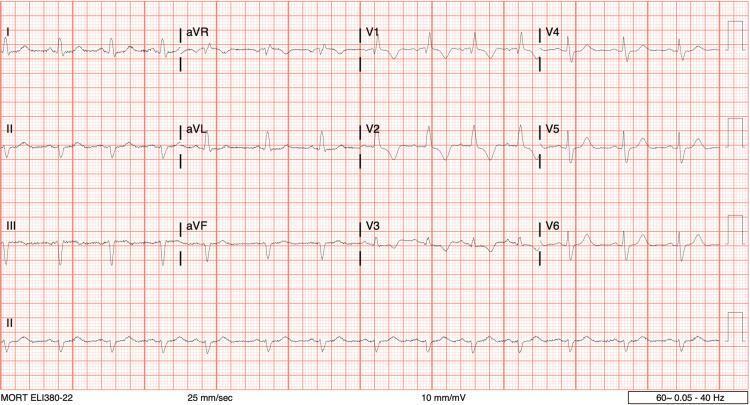
A standard 12-lead electrocardiogram (ECG) printed on red grid paper at 25 mm/sec. The tracing shows a normal sinus rhythm with a regular rate. Key conduction abnormalities are evident: a Right Bundle Branch Block (RBBB) is demonstrated by widened QRS complexes with a classic rSR' pattern and T-wave inversion in the right precordial leads (V1-V3), along with slurred S waves in leads I and V6. There is an associated Left Axis Deviation (LAD), suggested by the predominantly negative QRS complexes in leads II, III, and aVF, which may indicate a concomitant left anterior fascicular block (bifascicular block pattern). There is no significant ST-segment elevation (no STEMI), although minor non-specific ST-segment depression is visible in the inferior leads. The QT interval appears within normal limits. This ECG is representative of common conduction system disease used in cardiology education to identify fascicular and bundle branch blocks.
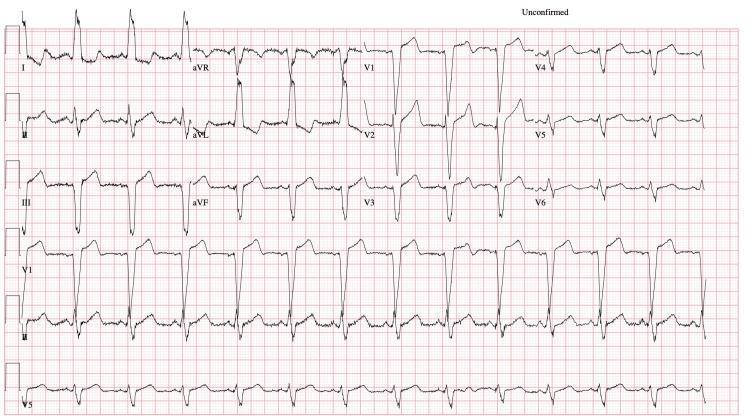
A 12-lead electrocardiogram (ECG) displayed on standard pink grid paper, demonstrating normal sinus rhythm with significant conduction abnormalities. The diagnostic hallmark is a Left Bundle Branch Block (LBBB), characterized by a markedly widened QRS complex exceeding 120ms (specifically 158ms per context). Notable morphology includes broad, notched, or 'M-shaped' R-waves in the lateral leads (I, aVL, V5, and V6) and deep S-waves in the right precordial leads (V1-V3). There is evidence of left axis deviation, with predominantly positive deflections in lead I and negative deflections in leads II and III. ST-segment and T-wave discordance is visible, where the ST-segments and T-waves shift in the opposite direction of the main QRS vector, a common secondary repolarization finding in LBBB. This diagnostic image is intended for medical education regarding cardiac conduction system delays and intraventricular blocks. The ventricular rate is approximately 78 bpm, and the QTc interval is prolonged at 533 ms.
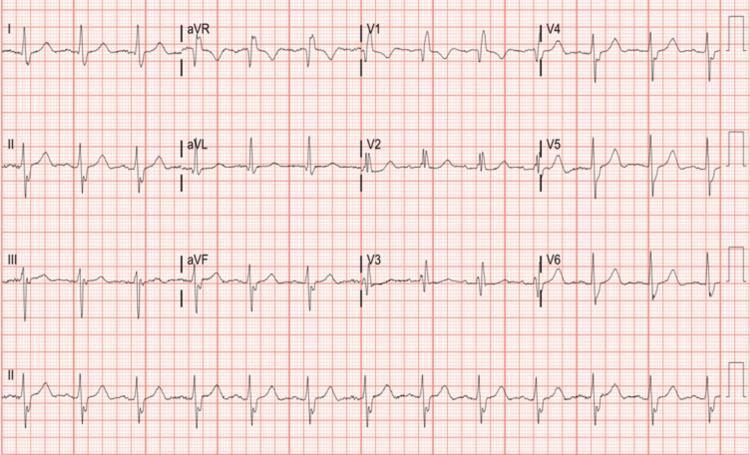
A 12-lead electrocardiogram (ECG) recorded at standard 25 mm/sec and 10 mm/mV, demonstrating normal sinus rhythm with a bifascicular block. The rhythm shows regular P-wave intervals and a normal PR interval. The QRS duration is prolonged (>120 ms), characteristic of a right bundle branch block (RBBB), marked by the classic rSR' pattern in lead V1 and widened S waves in leads I, aVL, and V6. Concomitant left axis deviation is present, evidenced by a predominantly negative QRS complex in lead II and a positive complex in lead aVL, diagnostic of a left anterior fascicular block (LAFB). Secondary repolarization abnormalities, including T-wave inversions, are visible in the right precordial leads (V1-V3), which are expected findings in the setting of RBBB. The tracing serves as a clinical illustration of conduction system disease, specifically bifascicular block, which carries implications for clinical monitoring of potential progression to complete heart block.
ECG Interpretation - Based on ECG Made Easy Principles
The ECG Paper and Basic Setup
- Small squares: 1 mm wide = 0.04 sec horizontally, 0.1 mV vertically
- Large squares: 5 mm wide = 0.2 sec (at standard 25 mm/sec paper speed)
- Calibration: Standard = 1 mV = 10 mm tall. Always check the calibration signal at the start of every ECG.
The 12 Leads: What They "See"
Limb Leads (Frontal Plane)
| Lead | View |
|---|---|
| I | Lateral (left side) |
| II | Inferior |
| III | Inferior |
| aVR | Right shoulder (usually inverted) |
| aVL | Left shoulder (lateral) |
| aVF | Inferior (foot) |
Precordial (Chest) Leads (Horizontal Plane)
| Lead | Position |
|---|---|
| V1 | 4th intercostal space, right sternal border |
| V2 | 4th intercostal space, left sternal border |
| V3 | Between V2 and V4 |
| V4 | 5th intercostal space, midclavicular line |
| V5 | Anterior axillary line |
| V6 | Midaxillary line |
The Normal ECG Waveforms
P Wave - Atrial Depolarization
- Duration: < 0.12 sec (< 3 small squares)
- Amplitude: < 2.5 mm in limb leads, < 1.5 mm in V1
- Normally upright in II, inverted in aVR (reflects sinus node activation spreading down and left)
- A retrograde P (negative in II, positive in aVR) = ectopic atrial or junctional pacemaker
- Peaked P (P pulmonale): RAE - tall, peaked P ≥ 2.5 mm in II
- Broad notched P (P mitrale): LAE - duration > 0.12 sec, often bifid in II
PR Interval - AV Conduction
- Normal: 0.12 - 0.20 sec (3 to 5 small squares)
- Measured from start of P to start of QRS
- Short PR (< 0.12 sec): pre-excitation (WPW), junctional rhythm
- Long PR (> 0.20 sec): first-degree AV block
QRS Complex - Ventricular Depolarization
- Normal duration: ≤ 0.10 sec (≤ 2.5 small squares)
- Naming convention:
- First negative deflection = Q wave
- First positive deflection = R wave
- Negative deflection after R = S wave
- Second positive deflection = R' wave
- Normal septal Q waves: small, narrow Q waves in I, aVL, V5-V6 (< 0.04 sec, < 25% R-wave height)
- Pathological Q wave: ≥ 0.04 sec wide OR ≥ 25% of R-wave amplitude - indicates prior MI
ST Segment - Early Ventricular Repolarization
- Normally isoelectric (at baseline)
- Measured from the J point (where QRS ends) to the start of the T wave
- Elevation ≥ 1 mm: ischemia/injury (STEMI pattern), pericarditis, Brugada, early repolarization
- Depression ≥ 0.5 mm: subendocardial ischemia, digitalis effect, strain
T Wave - Ventricular Repolarization
- Normally upright in I, II, V3-V6
- Normally inverted in aVR (and often V1)
- Tall, peaked T waves: hyperkalemia, hyperacute MI
- Inverted T waves: ischemia, LVH strain, bundle branch block, PE (V1-V4)
- T-wave alternans (beat-to-beat variation) = electrical instability, risk of VT
QT Interval - Total Ventricular Electrical Activity
- Measured from start of QRS to end of T wave
- Rate-corrected QT (QTc) = QT ÷ √RR (Bazett's formula)
- Normal QTc: < 440 ms (men), < 460 ms (women)
- Prolonged QTc: risk of torsades de pointes; causes include drugs (antiarrhythmics, antipsychotics, antibiotics), hypokalemia, hypomagnesemia, hypocalcemia, congenital long QT
U Wave
- Small positive deflection after T wave, best seen in V2-V3
- Prominent U waves: hypokalemia, bradycardia, LVH
- Inverted U waves: ischemia, LVH
The 14-Step Systematic Approach (Harrison's)
- Standardization and technical features (calibration, lead placement, artifacts)
- Rhythm
- Heart rate
- PR interval / AV conduction
- QRS interval
- QT / QTc interval
- Mean QRS electrical axis
- P waves
- QRS voltages
- Precordial R-wave progression
- Abnormal Q waves
- ST segments
- T waves
- U waves
Step 1: Determine the Rhythm
- Are there P waves?
- Is the rate regular?
- Is each P wave followed by a QRS?
| Finding | Rhythm |
|---|---|
| Regular P waves, PR 0.12-0.20, narrow QRS | Normal sinus rhythm |
| No P waves, irregularly irregular | Atrial fibrillation |
| Sawtooth pattern (~300/min) | Atrial flutter |
| P waves present but varying PR | Wandering pacemaker / Wenckebach |
| No P waves, wide regular QRS | Ventricular rhythm |
Step 2: Calculate the Heart Rate
- 1 large square = 300 bpm
- 2 large squares = 150 bpm
- 3 large squares = 100 bpm
- 4 large squares = 75 bpm
- 5 large squares = 60 bpm
- 6 large squares = 50 bpm
Step 3: Determine the Electrical Axis
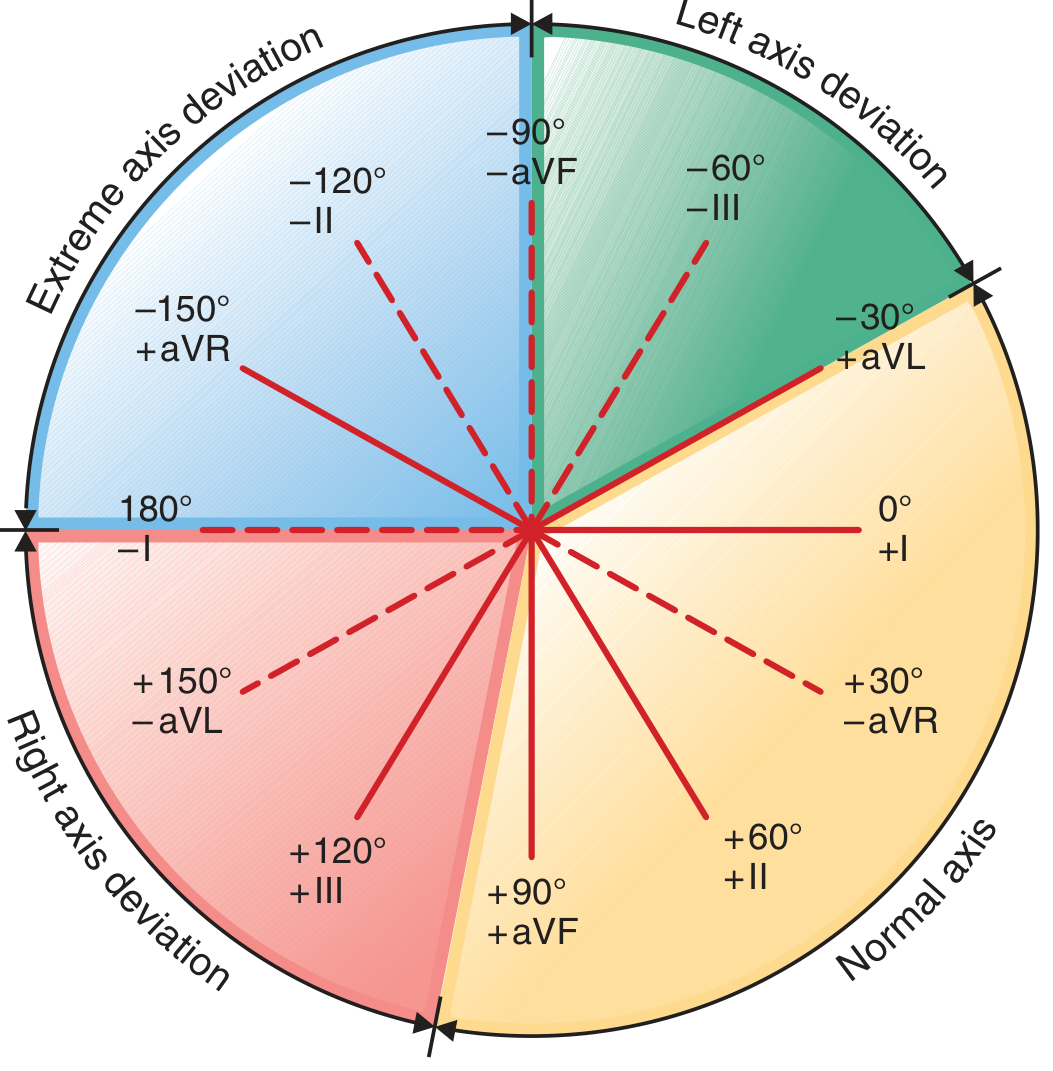
| Axis | Range | Lead I | Lead aVF |
|---|---|---|---|
| Normal | 0° to +90° | Positive | Positive |
| Left axis deviation (LAD) | -30° to -90° | Positive | Negative |
| Right axis deviation (RAD) | +90° to +180° | Negative | Positive |
| Extreme/NW axis | -90° to ±180° | Negative | Negative |
- Both positive = normal axis
- I positive, aVF negative = left axis deviation
- I negative, aVF positive = right axis deviation
Step 4: Analyze the P Wave
- Upright in I, II, aVF, V4-V6 = sinus rhythm
- Inverted in II = ectopic or retrograde conduction
- Absent P waves: AF, atrial flutter, junctional rhythm, hyperkalemia (very severe)
- Broad P in II (> 3 small squares) = left atrial enlargement (P mitrale)
- Tall peaked P in II ≥ 2.5 mm = right atrial enlargement (P pulmonale)
Step 5: Measure the PR Interval
-
Short PR (< 3 small squares / 0.12 sec):
- WPW syndrome (with delta wave)
- Lown-Ganong-Levine (accessory pathway)
- Junctional rhythm
-
Long PR (> 5 small squares / 0.20 sec): 1st-degree AV block
-
Progressively lengthening PR, then dropped beat: Mobitz type I (Wenckebach) - 2nd degree AV block
-
Constant PR, then sudden dropped beat: Mobitz type II - 2nd degree AV block (more dangerous)
-
P waves and QRS completely dissociated: 3rd-degree (complete) AV block
Step 6: Examine the QRS Complex
QRS Width
- Narrow QRS (< 0.12 sec): Supraventricular origin (normal or with aberrant conduction)
- Broad QRS (≥ 0.12 sec): Bundle branch block, ventricular ectopic beat, pre-excitation (WPW), hyperkalemia, paced rhythm
Right Bundle Branch Block (RBBB)
- QRS ≥ 0.12 sec
- rSR' (M-shaped or "rabbit ears") in V1
- Wide, slurred S wave in I, aVL, V5-V6
- Secondary T-wave inversion in V1-V3
- Causes: normal variant, RVH, PE, ASD, ischemia
Left Bundle Branch Block (LBBB)
- QRS ≥ 0.12 sec
- Broad, notched (W-shaped) QRS in V1 (QS or rS)
- Tall, broad, notched R in I, aVL, V5-V6 (M-shaped)
- No septal Q waves in I, V5-V6
- Discordant ST-T changes (ST and T opposite direction to QRS)
- LBBB makes ischemia difficult to assess - use modified Sgarbossa criteria
Precordial R-wave Progression
- Normally, R waves grow from V1 (small r) to V5 (tallest R), then decrease at V6
- Poor R-wave progression (R remains small through V3-V4): anterior MI, LVH, LBBB, COPD
- Dominant R in V1 (R > S): RBBB, posterior MI, RVH, WPW (Type A), HCM
Step 7: Analyze the ST Segment and T Waves
ST Elevation
| Pattern | Cause |
|---|---|
| Convex ("tombstone") elevation with Q waves | STEMI |
| Saddle-shaped in multiple leads | Pericarditis |
| Concave, diffuse | Early repolarization (benign), pericarditis |
| RBBB + ST elevation V1-V2 | Brugada syndrome |
| Persistent elevation post-MI | Ventricular aneurysm |
ST Depression
| Pattern | Cause |
|---|---|
| Horizontal or downsloping ≥ 1 mm | Ischemia (NSTEMI, unstable angina) |
| Upsloping < 1 mm | Non-specific |
| Widespread (I, II, V5-V6) + ST elevation in aVR | Left main / proximal LAD stenosis |
| "Reverse tick" (scooped) | Digitalis effect |
STEMI Localization
| Territory | Leads with changes | Culprit artery |
|---|---|---|
| Anterior | V1-V4 | LAD |
| Anterolateral | V1-V6, I, aVL | LAD / LCx |
| Inferior | II, III, aVF | RCA (or LCx) |
| Lateral | I, aVL, V5-V6 | LCx |
| Posterior | Tall R + ST depression V1-V2 | RCA / LCx |
| Right ventricular | ST elevation in V3R-V4R | RCA proximal |
Step 8: Recognize Common Arrhythmias
| Arrhythmia | Key ECG features |
|---|---|
| Sinus tachycardia | Regular, P before each QRS, rate 100-150 |
| Sinus bradycardia | Regular, P before each QRS, rate < 60 |
| Atrial fibrillation | No P waves, irregularly irregular QRS, fibrillatory baseline |
| Atrial flutter | Sawtooth flutter waves at ~300/min, usually 2:1 or 4:1 block |
| SVT (AVNRT/AVRT) | Narrow QRS tachycardia, rate 150-250, no visible P or retrograde P |
| VT | Wide QRS tachycardia ≥ 0.12 sec, rate 100-250, AV dissociation |
| Ventricular fibrillation | Chaotic, no recognizable complexes |
| Junctional rhythm | Narrow QRS, no P or inverted P near QRS, rate 40-60 |
| Accelerated idioventricular | Wide QRS, rate 60-100, post-MI reperfusion |
Step 9: Look for Chamber Enlargement / Hypertrophy
Left Ventricular Hypertrophy (LVH)
- Sokolow-Lyon: S in V1 + R in V5 or V6 ≥ 35 mm
- Cornell: R aVL + S V3 > 28 mm (men) / > 20 mm (women)
- Associated: Left axis deviation, strain pattern (ST depression + T-wave inversion in I, aVL, V5-V6)
Right Ventricular Hypertrophy (RVH)
- Dominant R in V1 (R > S)
- Right axis deviation
- ST depression/T-wave inversion in V1-V3 (RV strain)
- Causes: pulmonary hypertension, pulmonary stenosis, chronic cor pulmonale
Step 10: Recognize Other Important Patterns
| Pattern | ECG Features | Condition |
|---|---|---|
| Short PR + delta wave + wide QRS | Slurred upstroke (delta wave) | WPW syndrome |
| Peaked T waves | Tall symmetrical T, wide QRS, eventually sine wave | Hyperkalemia |
| Prolonged QT, polymorphic VT | Twisting QRS axis | Torsades de pointes |
| Epsilon wave, T-wave inversion V1-V3 | Small deflection post-QRS | ARVC |
| Saddle-back or coved ST V1-V2 | ± RBBB morphology | Brugada syndrome |
| Electrical alternans | Alternating QRS height | Large pericardial effusion / tamponade |
| Low voltage (QRS < 5 mm all limb leads) | Small complexes throughout | Pericardial effusion, obesity, emphysema, hypothyroidism |
| ST depression II, III, aVF + RV strain | Sinus tachycardia, S1Q3T3 | Pulmonary embolism |
Summary: The ECG Made Easy Checklist
- Rate - fast/slow/normal?
- Rhythm - regular or irregular? P waves present?
- Axis - normal, LAD, RAD?
- P wave - shape, duration?
- PR interval - short, normal, long, varying?
- QRS - narrow or wide? BBB? Q waves?
- ST segment - elevation or depression?
- T wave - upright, inverted, peaked?
- QT interval - prolonged?
- Overall pattern - does it fit a known syndrome?