

7f26a067-67cd-4e35-9e61-e1fb7b10f08c.jpeg
Explain this for pharmacology practical
Reading File
Now let me search the medical library for catecholamines cardiovascular effects in parallel with the image analysis:
Finding Sources
Finding Sources
Finding Sources
Finding Sources
Good - I found relevant sections. Let me read the Ganong's section on effects of epinephrine & norepinephrine, and the Katzung section on adrenergic drugs:
Reading File
Finding Sources
Reading File
Finding Sources
I now have excellent material from Ganong's. Let me also fetch the Ganong's figure and get Lippincott/Katzung content on dopamine:
Loading Image
Finding Sources
I now have all the information I need to give a thorough, well-referenced answer. Let me compile the full explanation.
Cardiovascular Effects of 3 Catecholamines - Pharmacology Practical Explanation
What the Diagram Shows
The diagram tracks three parameters over a 15-minute infusion at 10 mcg/min for each of three drugs (A, B, C):
- Heart Rate (top row)
- Blood Pressure - SBP (systolic), MBP (mean), DBP (diastolic) shown as a "spindle" shape
- Vascular Resistance (bottom row)
Identifying A, B, C Based on Receptor Selectivity
Drug A = Norepinephrine (Noradrenaline)
Receptor profile: Primarily α1 > β1, negligible β2
| Parameter | Change | Mechanism |
|---|---|---|
| SBP | ↑↑ (rises prominently) | α1-mediated vasoconstriction |
| DBP | ↑↑ (rises prominently) | α1-mediated vasoconstriction |
| Pulse pressure | Narrows slightly | Both SBP and DBP rise together |
| Heart Rate | ↓ (reflex bradycardia) | Baroreceptor reflex triggered by marked BP rise overrides direct β1 stimulation |
| Vascular Resistance | ↑↑ (marked rise then returns to baseline) | Generalized α1 vasoconstriction in all vascular beds |
Key teaching point: Norepinephrine has virtually no β2 activity, so there is no vasodilation to counter the α1 vasoconstriction. The resulting hypertension activates carotid/aortic baroreceptors strongly enough to produce reflex bradycardia that overrides the direct β1 cardioacceleratory effect. Net result: cardiac output falls. - Ganong's Review of Medical Physiology, 26th Ed.
Drug B = Epinephrine (Adrenaline)
Receptor profile: α1 + β1 + β2 (all three, roughly equal)
| Parameter | Change | Mechanism |
|---|---|---|
| SBP | ↑↑ (rises prominently) | β1 increases cardiac output + α1 vasoconstriction |
| DBP | ↓ (falls or unchanged) | β2 vasodilation in skeletal muscle/liver overbalances α1 constriction elsewhere |
| Pulse pressure | Widens (classic sign) | SBP up + DBP down = wide pulse pressure |
| Heart Rate | ↑ (increases) | Direct β1 stimulation; baroreceptor response is insufficient to override this |
| Vascular Resistance | ↓ (falls) | β2-mediated vasodilation dominates the overall picture |
Key teaching point: Epinephrine dilates blood vessels in skeletal muscle and the liver via β2-receptors. This usually overbalances the vasoconstriction produced elsewhere, so total peripheral resistance drops. Because the baroreceptor stimulation is insufficient to obscure the direct effect on the heart, cardiac rate and output increase. - Ganong's Review of Medical Physiology, 26th Ed.
The wide pulse pressure (SBP up, DBP down) is the hallmark of epinephrine.
Drug C = Dopamine
Receptor profile: Dose-dependent - D1 (low dose) → β1 (medium dose) → α1 (high dose). At 10 mcg/min (medium-high dose): predominantly β1 + α1, D1 effects also present.
| Parameter | Change | Mechanism |
|---|---|---|
| SBP | ↑ (moderate rise) | β1 cardiac stimulation increases cardiac output |
| DBP | ↓ or minimal change | D1-mediated renal/splanchnic vasodilation partially counteracts α1 |
| Pulse pressure | Widens (moderate) | SBP rises more than DBP |
| Heart Rate | ↑ (moderate) | β1 stimulation |
| Vascular Resistance | ↓ initially then slight rise | D1-mediated vasodilation + some α1 at higher doses |
Key teaching point: Dopamine at 10 mcg/min activates both β1 (cardiac stimulation) and D1 (renal/mesenteric vasodilation) receptors, with some α1 effect. The net result is a picture intermediate between pure epinephrine and norepinephrine - moderate rise in SBP, less prominent DBP rise (due to D1 vasodilation), and moderate increase in heart rate.
Summary Comparison Table
| Feature | A (Norepinephrine) | B (Epinephrine) | C (Dopamine) |
|---|---|---|---|
| Main receptors | α1 >> β1 | α1 = β1 = β2 | D1, β1, α1 (dose-dep.) |
| Heart Rate | ↓ (reflex brady) | ↑↑ | ↑ |
| SBP | ↑↑ | ↑↑ | ↑ |
| DBP | ↑↑ | ↓ | ↓ or → |
| Pulse Pressure | Narrow/unchanged | Wide (key finding) | Moderate widening |
| Vascular Resistance | ↑↑ | ↓ | ↓ (at this dose) |
| Cardiac Output | ↓ | ↑↑ | ↑ |
The Classic Ganong's Diagram (Epinephrine vs. Norepinephrine)
This is the textbook figure directly analogous to your practical diagram, from Ganong's Review of Medical Physiology, 26th Ed.:
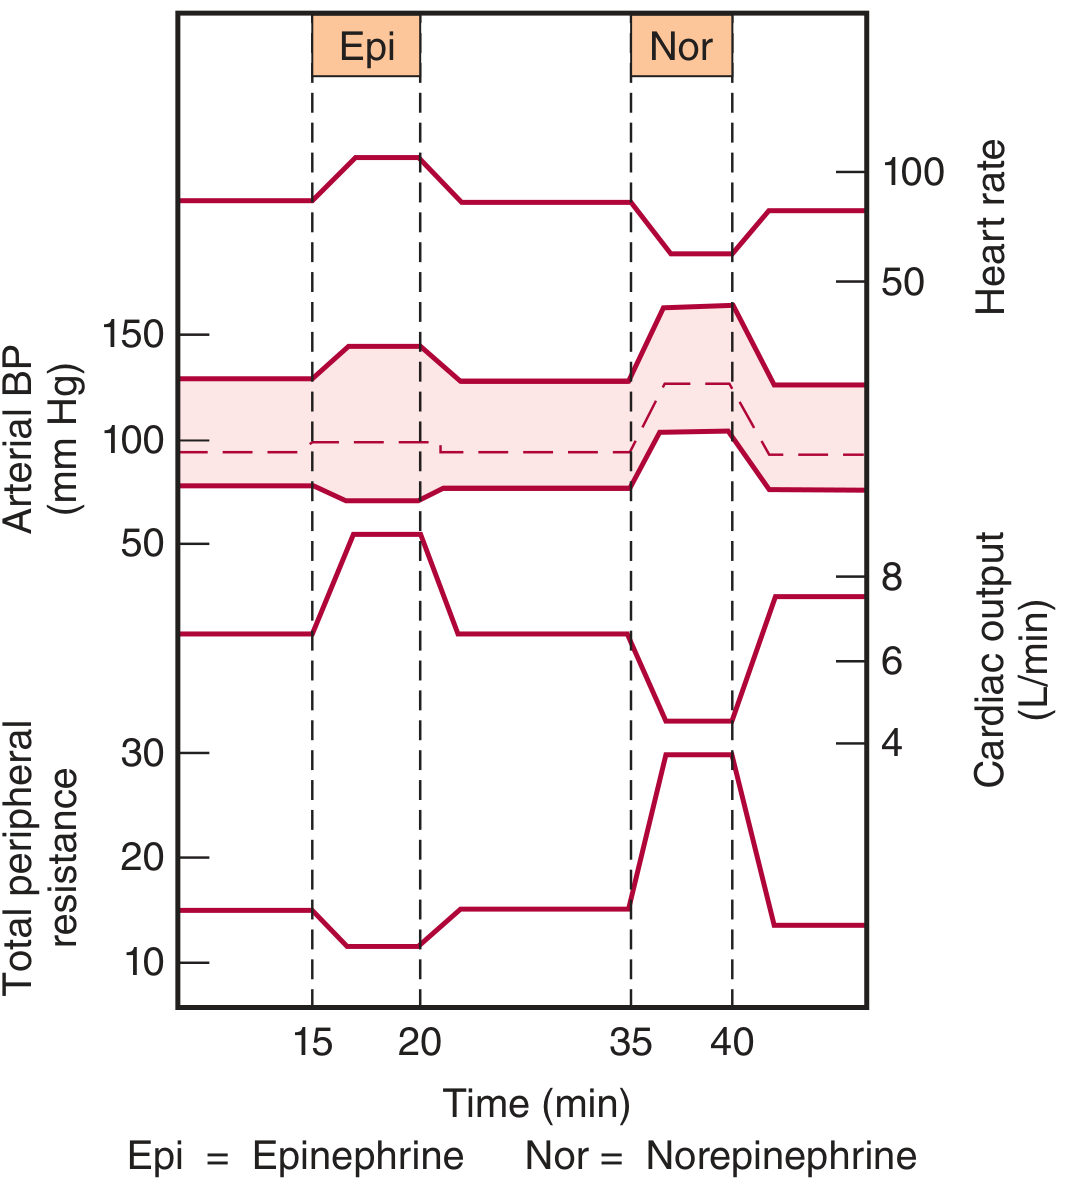
Notice in this figure:
- Epinephrine (Epi): SBP rises, DBP falls, pulse pressure widens, heart rate increases, total peripheral resistance falls, cardiac output rises markedly
- Norepinephrine (Nor): Both SBP and DBP rise, heart rate falls (reflex bradycardia), total peripheral resistance rises sharply, cardiac output actually decreases
Memory Aid
- Norepinephrine = Narrows pulse pressure + bradycardia (baroreceptor reflex wins)
- Epinephrine = Expands pulse pressure + tachycardia (β2 vasodilation in muscle pulls DBP down)
- Dopamine = Dose-dependent (D1 at low dose → β1 → α1 at high dose); at 10 mcg/min = cardiac stimulation + partial vasodilation
This diagram is a classic pharmacology practical question that tests whether you understand not just receptor pharmacology in isolation, but the integrated cardiovascular response including reflex mechanisms (baroreceptor reflex for norepinephrine) and multi-receptor activation patterns (epinephrine's mixed α/β2 effects).
This is a shared conversation. Sign in to Orris to start your own chat.