
Cell physiology high yield points
action potential phases nerve fiber Na K channels
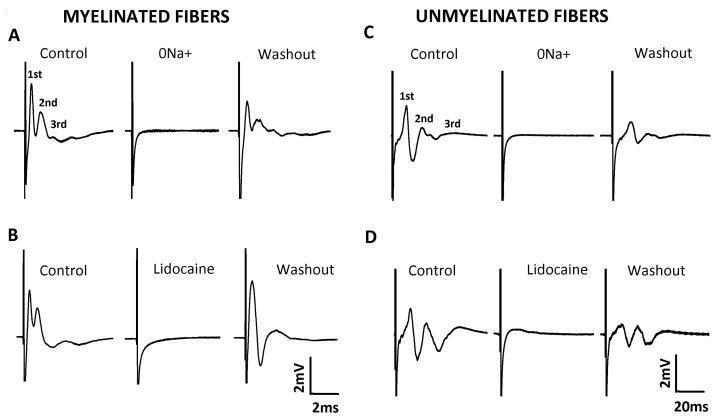
This physiological diagram illustrates extracellular recordings of compound action potentials (CAPs) from myelinated and unmyelinated nerve fibers, categorized into four panels (A-D). Panels A and B display CAP traces for myelinated fibers, characterized by high conduction velocities (scale bar: 2 ms). Panels C and D show unmyelinated fibers with slower conduction (scale bar: 20 ms). In the 'Control' conditions, three distinct components (1st, 2nd, and 3rd) are identified, representing different fiber populations. The experiment demonstrates the sodium-dependency of these potentials: removing extracellular sodium (0Na+) in panels A and C or applying the local anesthetic Lidocaine (1 mM) in panels B and D results in the total abolition of the CAP signals. The 'Washout' phases show partial or near-complete recovery of the action potential waveforms, confirming the viability of the nerve preparation and the reversible nature of the blockade. This visual provides clinical relevance for understanding nerve conduction, the mechanism of action of sodium channel blockers, and the electrophysiological differences between fiber types.
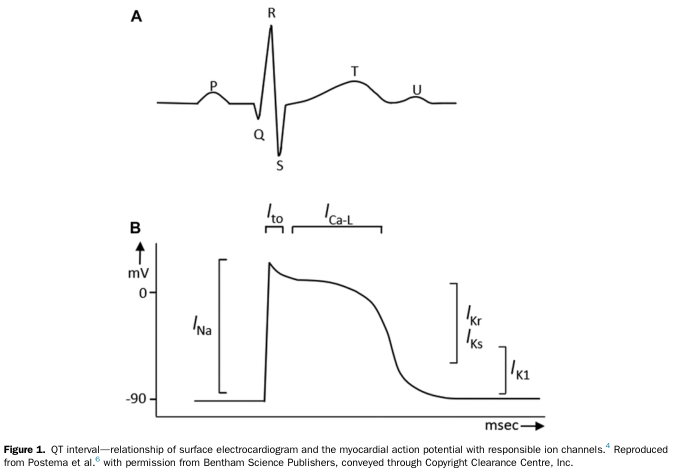
Summary : This figure illustrates the relationship between the surface electrocardiogram (ECG) waveform and the myocardial action potential, highlighting the corresponding ion channels responsible for different phases of cardiac electrical activity. line diagram: # Panel A: Surface Electrocardiogram (ECG) Waveform : • Shows a typical ECG trace with labeled points: P, Q, R, S, T, and U. • The waveform represents the electrical activity of the heart during a cardiac cycle. • P wave: atrial depolarization. • QRS complex: ventricular depolarization. • T wave: ventricular repolarization. • U wave: sometimes seen, origin not fully understood. # Panel B: Myocardial Action Potential : • Plots membrane potential (mV) on the y-axis (ranging from -90 mV to above 0 mV) against time (msec) on the x-axis. • Shows the phases of the cardiac action potential: – Rapid upstroke (depolarization) due to I_Na (sodium current). – Early repolarization (I_to, transient outward potassium current). – Plateau phase (I_Ca-L, L-type calcium current). – Repolarization phase (I_Kr and I_Ks, rapid and slow delayed rectifier potassium currents). – Resting potential maintained by I_K1 (inward rectifier potassium current). # Ion Channels & Phases : • I_Na: Responsible for the initial rapid depolarization. • I_to: Contributes to early repolarization. • I_Ca-L: Maintains the plateau phase. • I_Kr and I_Ks: Mediate repolarization. • I_K1: Maintains the resting membrane potential. # Design Encodings : • Simple black line traces for both ECG and action potential. • Ion channel names are annotated above the relevant phases of the action potential. # Analysis : • The figure visually links the phases of the ECG waveform to the underlying myocardial action potential and the specific ion channels involved. • The QRS complex corresponds to the rapid depolarization (I_Na), while the T wave aligns with repolarization (I_Kr, I_Ks). • The plateau phase (I_Ca-L) is crucial for the duration of the QT interval, which is clinically significant for arrhythmia risk. • The diagram provides a clear educational overview of how surface ECG features relate to cellular electrophysiology.
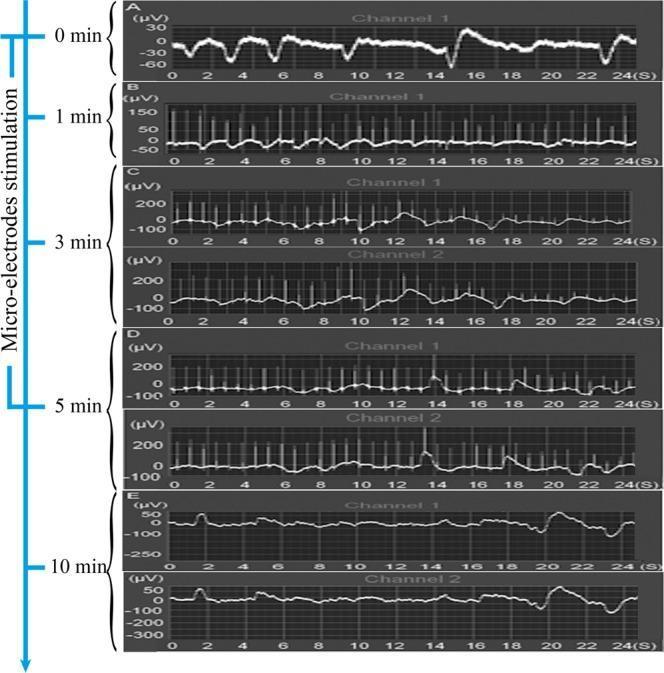
This physiological timeline illustrates the real-time measurement of electric potential in sympathetic nerve fibers using a multiple physiologic recorder. The figure contains five panels (A-E) tracking changes in voltage (µV) over time (seconds) across two channels (Channel 1: left; Channel 2: right). (A) Baseline resting state at 0 minutes shows low-amplitude fluctuations between -60 µV and 30 µV. (B-D) During microelectrode stimulation at 1, 3, and 5-minute intervals, there is a progressive increase in spike frequency and voltage range, with peaks reaching approximately 200 µV and lows near -100 µV. Consistency between Channel 1 and Channel 2 indicates a systemic or bilateral sympathetic response to localized stimulation. (E) 5 minutes after ceasing stimulation (the 10-minute total mark), the electric potential demonstrates a marked decrease in amplitude and frequency, returning toward a more stable state with reduced peak values (max ~50 µV). This series demonstrates the transient excitatory effect of microelectrode stimulation on sympathetic nerve fiber activity and its potential clinical application in modulating autonomic influence on tissue healing.
Na-K ATPase pump cell membrane
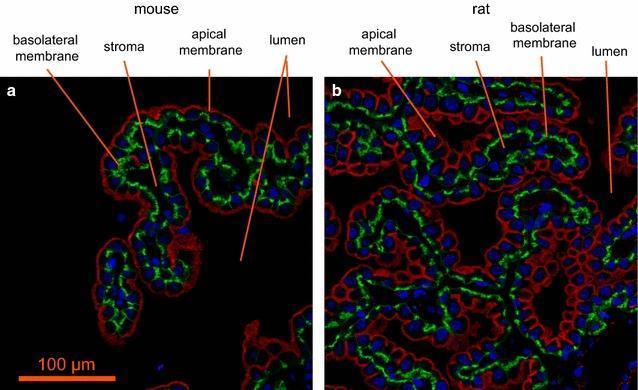
This diagnostic image consists of two immunofluorescence microscopy panels (a, mouse; b, rat) showing ion transporter localization in the choroid plexus epithelium of the fourth ventricle. The micrographs demonstrate a distinct cellular architecture with clear polarization. The Na+, K+-ATPase alpha-1 subunit is stained red, localized prominently to the apical membrane (brush border) facing the ventricular lumen. The Na+, HCO3- cotransporter NCBE/NBCn2 (Slc4a10) is stained green, localized specifically to the basolateral membranes of the epithelial cells facing the central stroma (interstitium) where capillaries reside. To-pro 3 DNA stain (blue) identifies the nuclei distributed within the cuboidal epithelial cell bodies. The images illustrate the structural basis for cerebrospinal fluid (CSF) secretion, showing the physical separation of blood-side (basolateral) and CSF-side (apical) transport proteins. A scale bar of 100 um is provided for reference. This material serves as a high-level educational resource for neurobiology and renal-like transport physiology at the blood-CSF interface.
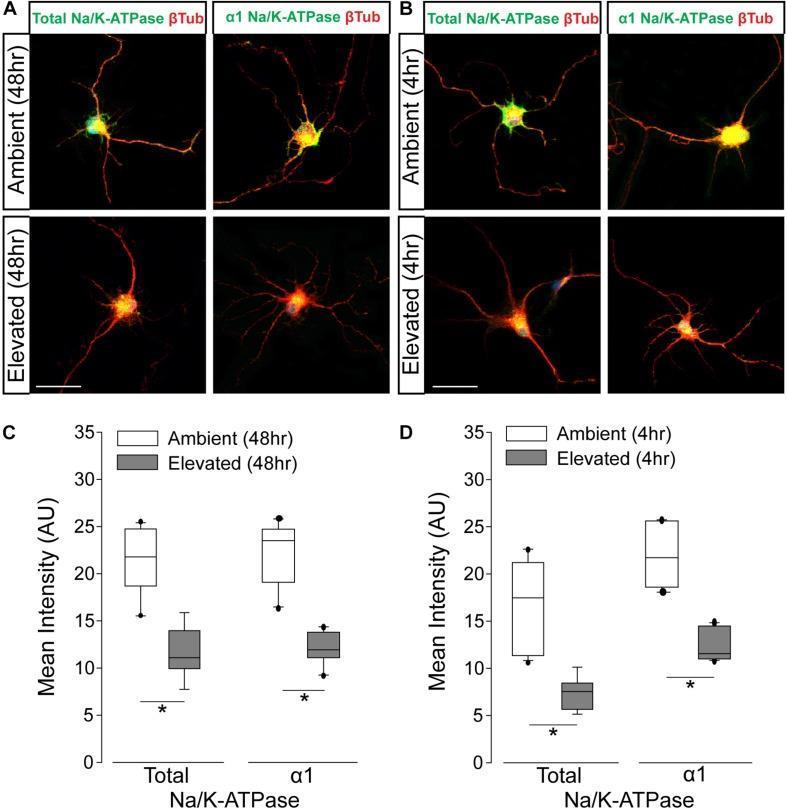
Educational figure illustrating the effect of hydrostatic pressure on Na/K-ATPase expression in retinal ganglion cells (RGCs). Panels A and B present multi-channel immunofluorescence micrographs of primary RGC cultures. Cells are dual-labeled for Na/K-ATPase (green) and β-Tubulin (red, a structural marker). Under ambient pressure conditions at 4 and 48 hours, RGCs exhibit robust, intense green fluorescence in the soma and neurites, indicating high levels of total and α1-subunit Na/K-ATPase. In contrast, cells exposed to elevated pressure show a qualitative reduction in green signal intensity across the cell body and processes. Panels C and D provide quantitative analysis via box plots. The graphs measure the mean fluorescence intensity (Arbitrary Units) for Total and α1 Na/K-ATPase. Significant decreases (marked with asterisks, p < 0.05) are shown for elevated pressure versus ambient controls at both 4-hour and 48-hour time points. The data demonstrates that elevated hydrostatic pressure—a model for glaucoma pathophysiology—reduces the protein expression of the Na/K-ATPase ion pump, potentially disrupting RGC electrochemical gradients.
Cell Physiology - High Yield Points
1. Body Fluid Compartments
| Compartment | % Total Body Water | % Body Weight |
|---|---|---|
| Total Body Water (TBW) | 100% | 60% (males), 50% (females) |
| ICF | 2/3 of TBW | ~40% body weight |
| ECF | 1/3 of TBW | ~20% body weight |
| Plasma | 1/4 of ECF | ~5% body weight |
| Interstitial fluid | 3/4 of ECF | ~15% body weight |
2. ICF vs ECF Composition (HIGH YIELD TABLE)
| Ion | ECF (mEq/L) | ICF (mEq/L) |
|---|---|---|
| Na+ | 140 | 14 |
| K+ | 4 | 120 |
| Ca²+ (ionized) | 2.5 | 0.0001 (10⁻⁴) |
| Cl⁻ | 105 | 10 |
| HCO₃⁻ | 24 | 10 |
| pH | 7.4 | 7.1 |
- Major ECF cation: Na+ (with Cl⁻ and HCO₃⁻ as balancing anions)
- Major ICF cations: K+ and Mg²+ (balanced by proteins and organic phosphates)
- ICF Ca²+ is ~25,000x lower than ECF - critical for signaling
- Despite large differences in individual ions, total osmolarity is equal in ICF and ECF because water flows freely across membranes
3. Transport Across Cell Membranes
Simple Diffusion
- Obeys Fick's law: Rate ∝ (concentration difference × membrane permeability × area) / thickness
- No carrier, no energy - lipid-soluble substances (O₂, CO₂, steroids, fatty acids)
Facilitated Diffusion
- Carrier-mediated, no energy required, moves down electrochemical gradient
- Examples: glucose entry into muscle/fat cells (GLUT4), fructose absorption
Primary Active Transport
- Requires direct ATP hydrolysis
- Na⁺-K⁺ ATPase (Na⁺-K⁺ pump):
- Pumps 3 Na⁺ OUT and 2 K⁺ IN per ATP hydrolyzed
- Electrogenic (net positive charge lost from cell → contributes ~4 mV negativity)
- Inhibited by ouabain (cardiac glycoside)
- Maintains the Na⁺ and K⁺ gradients that drive secondary active transport
- Ca²⁺ ATPase: pumps Ca²+ out of the cell or into the SR
Secondary Active Transport
- Uses the Na⁺ electrochemical gradient (built by Na⁺-K⁺ ATPase) as energy source
- Inhibiting Na⁺-K⁺ ATPase (ouabain) will indirectly inhibit all secondary active transport
| Type | Direction vs Na⁺ | Example |
|---|---|---|
| Cotransport (Symport) | Same direction | Na⁺-glucose (SGLT1) in intestine/proximal tubule; Na⁺-K⁺-2Cl⁻ in thick ascending limb |
| Countertransport (Antiport) | Opposite direction | Na⁺-Ca²⁺ exchanger (NCX); Na⁺-H⁺ exchanger |
4. Equilibrium Potential (Nernst Equation)
| Ion | Approximate Equilibrium Potential |
|---|---|
| K⁺ | -94 mV |
| Na⁺ | +61 mV |
| Ca²⁺ | +130 mV |
| Cl⁻ | -90 mV (varies) |
5. Resting Membrane Potential
- Normal resting potential: −70 to −80 mV (cell interior negative)
- Determined by relative permeabilities of ions
- At rest: membrane is highly permeable to K⁺ and Cl⁻, and barely permeable to Na⁺ and Ca²⁺
- Therefore: resting potential is close to E_K (−94 mV) and far from E_Na (+61 mV)
- Small direct electrogenic contribution (~4 mV negativity) from 3:2 stoichiometry
- Large indirect contribution by maintaining K⁺ gradient → K⁺ diffusion potential → negative resting potential
- K⁺ diffusion alone → −94 mV
- Add slight Na⁺ permeability (Goldman equation, P_K:P_Na = 100:1) → −86 mV
- Add Na⁺-K⁺ pump electrogenic contribution → ~−90 mV (large nerve fibers)
6. Action Potentials
Terminology
| Term | Definition |
|---|---|
| Depolarization | Membrane potential becomes less negative |
| Hyperpolarization | Membrane potential becomes more negative |
| Threshold | Potential at which AP is inevitable (net inward current > outward current) |
| Overshoot | Part of AP where interior is positive |
| Undershoot | Hyperpolarizing afterpotential - more negative than rest |
Phases of Nerve Action Potential
- Upstroke (depolarization): Stimulus → threshold reached → voltage-gated Na⁺ channels open (activation gates) → massive Na⁺ influx → membrane depolarizes to ~+35 mV (near E_Na = +61 mV, not reached because channels inactivate)
- Repolarization: Na⁺ channel inactivation gates close → K⁺ channels open (slower) → K⁺ efflux → repolarization
- Undershoot/Afterhyperpolarization: K⁺ channels remain open slightly longer → membrane transiently more negative than rest
Voltage-gated Na⁺ Channel - Two gates
- Activation gate (m gate): Opens fast upon depolarization
- Inactivation gate (h gate): Closes slowly after opening; cannot reopen until membrane repolarizes
- During absolute refractory period: inactivation gates are closed - no AP possible regardless of stimulus strength
- Tetrodotoxin (TTX) blocks Na⁺ channel from outside; Lidocaine blocks from inside
K⁺ Channel
- Only one gate (activation)
- Opens more slowly than Na⁺ channels
- Tetraethylammonium (TEA) blocks K⁺ channels from inside
Refractory Periods
| Period | Mechanism | Significance |
|---|---|---|
| Absolute refractory period (ARP) | Na⁺ channel inactivation gates closed | No AP possible, any stimulus size |
| Relative refractory period (RRP) | Na⁺ channels partially recovered; K⁺ channels still open (undershoot) | AP possible only with suprathreshold stimulus |
All-or-None Law
- An AP either occurs fully or does not occur at all
- Stimulus strength encodes information by frequency of APs, not amplitude
Conduction Velocity
- Myelinated fibers: Saltatory conduction (jumps node to node) - faster
- Unmyelinated fibers: Continuous conduction - slower
- Velocity ∝ diameter of fiber (larger = faster)
7. Hyperkalemia Causing Muscle Weakness (Clinical Correlation)
- High extracellular K⁺ → reduces K⁺ concentration gradient → resting potential becomes less negative (depolarized toward threshold)
- This sustained depolarization causes chronic closure of Na⁺ inactivation gates
- With inactivation gates permanently closed → no action potentials possible → muscle paralysis
8. Synaptic Transmission
Electrical Synapses
- Via gap junctions - low-resistance pathways
- Fast, bidirectional conduction
- Found in: cardiac muscle, some smooth muscle (uterus, bladder), some neurons
- Ensures coordinated, simultaneous contraction
Chemical Synapses
- Synaptic cleft separates pre- and postsynaptic membranes
- Sequence: AP → Ca²⁺ channels open in presynaptic terminal → Ca²⁺ influx → neurotransmitter released by exocytosis → diffuses across cleft → binds postsynaptic receptor → EPSP or IPSP
- Unidirectional (presynaptic → postsynaptic)
- Synaptic delay due to multistep process
Neuromuscular Junction (NMJ)
- Neurotransmitter: Acetylcholine (ACh)
- AP in motoneuron → Ca²⁺ influx → ACh released → binds nicotinic receptors on motor end plate → Na⁺/K⁺ channels open → end-plate potential (EPP) → muscle AP
- ACh is hydrolyzed by acetylcholinesterase in the cleft (terminates signal)
- Curare blocks nicotinic receptors (competitive) → muscle paralysis
- Succinylcholine - depolarizing blocker (used in anesthesia)
- Myasthenia gravis - autoantibodies against nicotinic ACh receptors → fatigable weakness
9. Skeletal Muscle Contraction (Excitation-Contraction Coupling)
- AP in muscle fiber → travels down T-tubules
- T-tubule voltage sensors (dihydropyridine receptors, DHPR) sense depolarization
- DHPR mechanically opens ryanodine receptors (RyR) on SR → Ca²⁺ release from SR
- Ca²⁺ binds troponin C → conformational change → tropomyosin moves off actin binding sites
- Myosin heads bind actin → power stroke (ADP + Pi released) → filament sliding
- ATP binds myosin → detachment from actin (ATP hydrolysis → myosin re-cocks)
- Relaxation: Ca²⁺ pumped back into SR by SERCA (SR Ca²⁺-ATPase)
- Rigor mortis = after death, ATP depleted → myosin cannot detach from actin → stiff muscles
- Length-tension relationship: maximum force at optimal sarcomere length (~2.2 µm)
- Tetanus = sustained high-frequency stimulation → summation → maximum sustained contraction
10. Key Pharmacologic/Toxicologic Targets (High-Yield)
| Agent | Target | Effect |
|---|---|---|
| Ouabain, Digoxin | Na⁺-K⁺ ATPase | Inhibit pump → ↑ intracellular Na⁺ → ↑ intracellular Ca²⁺ (via NCX) |
| Tetrodotoxin (TTX) | Voltage-gated Na⁺ channel (external) | Blocks AP upstroke → paralysis |
| Lidocaine, Procaine | Voltage-gated Na⁺ channel (internal) | Local anesthetic |
| Tetraethylammonium | K⁺ channels (internal) | Prolongs AP |
| Curare | Nicotinic ACh receptor | Competitive block → paralysis |
| Neostigmine | Acetylcholinesterase | Inhibition → ↑ ACh at NMJ |
| Botulinum toxin | ACh release from presynaptic terminal | Blocks exocytosis → flaccid paralysis |
- Costanzo Physiology 7th Ed., Chapter 1 (Cellular Physiology)
- Guyton & Hall Textbook of Medical Physiology, Chapters 4-5 (Transport & Nerve Physiology)
Organelles high yield points