I now have comprehensive data from multiple authoritative sources. Let me compile the full response.
Clinicopathological Study of Lupus Nephritis: Activity/Chronicity Indices and Outcome Correlation
A Complete Clinical Summary and Research Guide for MBBS Research
PART 1: CLINICAL SUMMARY
1. Background and Epidemiology
Systemic Lupus Erythematosus (SLE) is the prototypical autoimmune disease with multisystem involvement. Renal disease - lupus nephritis (LN) - occurs in over 50% of SLE patients and represents the single greatest driver of morbidity and mortality in lupus. Key epidemiological facts:
- LN is most common in Black and Asian females aged 15-45 years
- SLE and LN are more prevalent and more severe in Asian populations compared to Caucasians
- LN is the leading cause of secondary glomerulonephritis in countries such as China, Korea, and Japan (>50% of biopsy registries)
- High baseline serum creatinine and significant chronic damage on biopsy are the strongest predictors of unfavorable renal prognosis
- Brenner and Rector's The Kidney, 2-Volume Set; Henry's Clinical Diagnosis and Management by Laboratory Methods
2. Diagnosis of SLE: Classification Criteria
Two major classification systems are in use:
ACR Criteria (Hochenberg 1997) - 11 criteria, 4 required:
- Malar (butterfly) rash
- Discoid rash
- Photosensitivity
- Oral ulcers
- Non-erosive arthritis
- Pleuritis or pericarditis (serositis)
- Renal disorder (proteinuria >0.5 g/day or cellular casts)
- Neurological disorder (seizures/psychosis)
- Hematological disorder (pancytopenia)
- Immunological disorder (anti-dsDNA, anti-Sm, antiphospholipid antibodies)
- Positive ANA
4 of 11 criteria = 96% sensitivity and specificity for SLE
SLICC Criteria (2012) - more sensitive, especially early SLE:
- 11 clinical + 6 immunologic criteria + 1 standalone criterion: biopsy-proven LN + positive ANA or anti-dsDNA
- More sensitive than ACR but can sacrifice specificity if the standalone renal criterion is applied in isolation
3. Pathogenesis of Lupus Nephritis
The pathogenesis involves a complex interplay of genetic, epigenetic, and immunological mechanisms:
- Genetic predisposition - >50 polymorphisms linked to LN susceptibility (complement genes, HLA, FCγR variants, IRF5, STAT4, BLK)
- Loss of immune tolerance - Defective clearance of apoptotic debris (NET formation from neutrophils exposes nuclear antigens)
- Autoantibody production - Anti-dsDNA (most specific for SLE), anti-histone, anti-Sm, anti-C1q, anti-RNP
- Immune complex deposition in mesangium, subendothelial, and/or subepithelial spaces
- Complement activation (C1q, C3, C4) - releases chemokines, attracts leukocytes
- Inflammatory cascade - Neutrophils, macrophages, T and B cells infiltrate the kidney
- Endothelial injury, vascular damage, hypoxia - leads to progressive fibrosis
The classic IF finding is the "full-house" pattern - simultaneous deposition of IgG, IgA, IgM, C3, and C1q.
4. Clinical Presentation of Lupus Nephritis
| Manifestation | Details |
|---|
| Microscopic hematuria | Most common; dysmorphic RBCs, RBC casts |
| Proteinuria | Subnephrotic to nephrotic range |
| Nephrotic syndrome | Especially in Class V (membranous) |
| Nephritic syndrome | Hematuria + hypertension + AKI; especially Class III/IV |
| RPGN | Rapid deterioration; crescentic disease |
| Tubular defects | RTA, Fanconi syndrome |
| Renal insufficiency | Acute or chronic, depending on class |
Serology during active LN: Low C3, low C4, elevated anti-dsDNA titers. Note: urinalysis findings may not always correlate with histological severity - this is a key justification for renal biopsy.
5. ISN/RPS Classification of Lupus Nephritis (2003, revised 2018)
This is your primary classification tool. Based on light microscopy (LM), with correlation from immunofluorescence (IF) and electron microscopy (EM):
| Class | Name | Light Microscopy Findings | Typical Presentation |
|---|
| I | Minimal mesangial LN | Normal LM; mesangial deposits on IF/EM only | Usually no clinical signs |
| II | Mesangial proliferative LN | Mesangial hypercellularity and/or expansion | Mild hematuria, mild proteinuria |
| III | Focal LN | Active and/or chronic lesions in <50% of glomeruli | Hematuria, proteinuria, mild renal insufficiency |
| IV | Diffuse LN | Active/chronic lesions in ≥50% of glomeruli (global or segmental) | Most severe - nephritic syndrome, hypertension, renal impairment |
| V | Membranous LN | Global or segmental subepithelial deposits ± mesangial disease | Nephrotic syndrome, proteinuria |
| VI | Advanced sclerosing LN | ≥90% globally sclerosed glomeruli without residual activity | CKD, minimal active inflammation |
Key points:
- Class IV is the most common severe form and carries the worst prognosis
- Class III and IV may have subclasses A (active), C (chronic), or A/C (active + chronic)
- Class V can coexist with Class III or IV (always mention when present)
- Patients can transition between classes over their disease course
- Tubulointerstitial and vascular lesions are present in many cases and affect prognosis but are not captured by the class designation alone
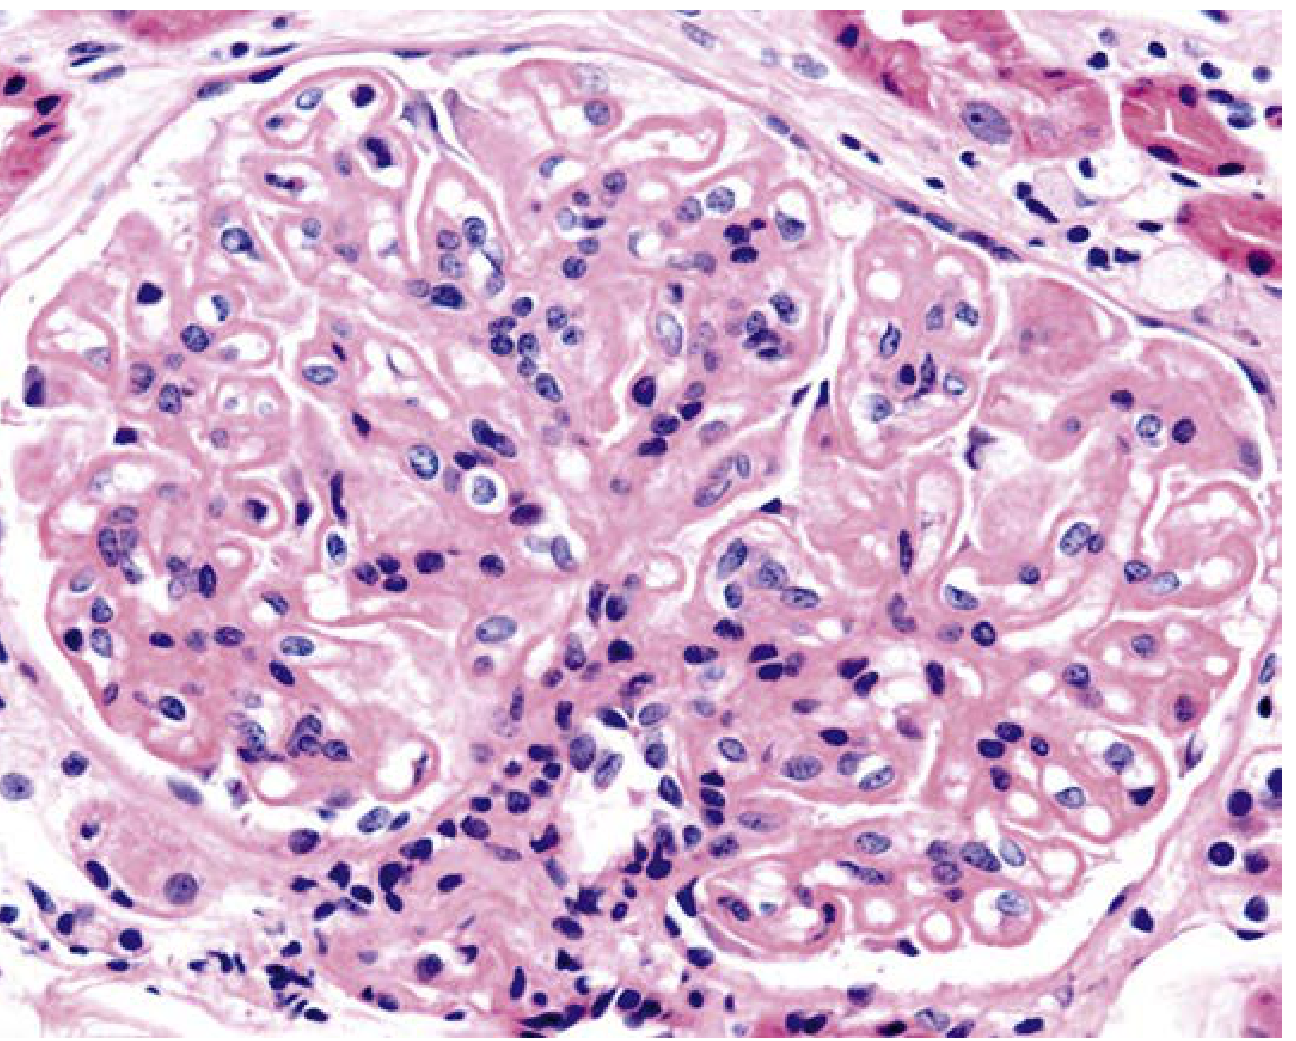
Fig: LN Class III - Segmental endocapillary hypercellularity with fibrinoid necrosis (Jones silver, ×400) - Henry's Clinical Diagnosis and Management
Fig: LN Class I - Normocellular glomerulus (PAS, ×400)
Fig: Severe proliferative LN - Dense endocapillary hypercellularity with inflammatory infiltrate (H&E, ×400)
6. The NIH Activity Index (AI) and Chronicity Index (CI) - The Core of Your Study
These semi-quantitative indices were developed at the NIH (Austin et al., 1984) and revised in the 2018 ISN/RPS update. They are scored on kidney biopsy and are the main tool for correlating histology with outcome in your study.
NIH Activity Index (AI) - Maximum Score: 24
Reflects acute, potentially reversible injury:
| Parameter | Scoring (0-3) | Weight |
|---|
| Endocapillary hypercellularity | % affected glomeruli: 0=absent, 1=<25%, 2=25-50%, 3=>50% | ×1 |
| Neutrophils/karyorrhexis within capillaries | Same % scoring | ×1 |
| Wire loops/hyaline thrombi (subendothelial deposits) | Same % scoring | ×1 |
| Fibrinoid necrosis | Same % scoring | ×2 (double weight) |
| Cellular/fibrocellular crescents | Same % scoring | ×2 (double weight) |
| Interstitial inflammation | % involved interstitium | ×1 |
Total AI = 0 to 24
- Fibrinoid necrosis and cellular crescents are doubled because they indicate the most severe, potentially irreversible-if-untreated active injury
- Practically: AI >10 combined with high CI (>3) predicts poor renal outcome in multiple published studies
NIH Chronicity Index (CI) - Maximum Score: 12
Reflects permanent, irreversible damage:
| Parameter | Scoring (0-3) | Weight |
|---|
| Global glomerulosclerosis (total: segmental + global) | % glomeruli affected | ×1 |
| Fibrous crescents | % glomeruli affected | ×1 |
| Tubular atrophy | % tubules involved | ×1 |
| Interstitial fibrosis | % interstitium involved | ×1 |
Total CI = 0 to 12
- CI >3 is generally accepted as indicating significant chronic damage
- Recent validation studies demonstrate that the modified CI has a strong correlation with kidney outcome (including progression to ESKD)
- The CI is more predictive of long-term renal survival than the AI
Scoring categories (as used in current studies):
- Low AI: 0-5 | Moderate AI: 6-17 | High AI: 18-24
- Low CI: 0-3 | Moderate CI: 4-7 | High CI: 8-12
Source: Henry's Clinical Diagnosis and Management by Laboratory Methods; PMC10085727 (Histologic evaluation of AI and CI in LN, 2023); PMC12800592 (Characterizing NIH AI and CI in 2 Independent LN Cohorts, 2026)
7. The SLEDAI Score (Your Clinical Correlation Tool)
The SLEDAI-2K (Systemic Lupus Erythematosus Disease Activity Index) is the standard clinical tool for measuring SLE disease activity:
- Physician-completed assessment across 9 core domains: rash, alopecia, oral ulcers, proteinuria, seizures, psychosis, visual disturbance, cranial nerve involvement, vasculitis, arthritis, myositis, urinary casts, hematuria, pyuria, thrombocytopenia, leukopenia, fever, complement reduction, anti-dsDNA rise
- Score range: 0 to 105 (weighted)
- Categories:
- Remission: SLEDAI = 0
- Low activity: SLEDAI 1-4
- Moderate: SLEDAI 5-12
- High activity: SLEDAI >12
- Limitation: does not capture gradation within individual domains (present/absent only)
- The SELENA-SLEDAI modification permits assessment of ongoing (persistent) disease activity
- Renal SLEDAI subscore specifically addresses: hematuria, pyuria, proteinuria, urinary casts
In your study, SLEDAI at time of biopsy correlates with the AI, and SLEDAI trajectory during follow-up correlates with the CI trend on repeat biopsy.
8. Renal Function Markers (Outcome Variables)
| Marker | Clinical Role |
|---|
| Serum creatinine | Track trajectory; doubling = 50% GFR loss |
| eGFR (CKD-EPI equation) | Quantify renal function; CKD staging (G1-G5) |
| 24-hour urine protein / spot PCR or ACR | Quantify proteinuria over time |
| Urinalysis | RBC casts = active nephritis |
| Anti-dsDNA titers | Rise correlates with flare |
| Complement (C3, C4) | Low = active lupus; monitor during treatment |
| Serum albumin | Nephrotic syndrome marker |
Renal response definitions (EULAR guidelines):
- Complete renal response (CRR): Proteinuria <500 mg/day + stable/improved eGFR (within 10% of pre-flare)
- Partial renal response (PRR): ≥50% reduction in proteinuria to <500-2999 mg/day
- No response: <25% reduction in proteinuria at 3 months
- Renal flare: Increase in proteinuria or urinary sediment activity after remission
9. Treatment Overview (Context for Outcome Correlation)
| Phase | Class III/IV LN | Class V LN |
|---|
| Induction | MMF (2-3 g/day) OR low-dose IV cyclophosphamide + high-dose glucocorticoids | MMF ± CNI (calcineurin inhibitor) or CYC |
| Maintenance | MMF or azathioprine (lower dose) | MMF or azathioprine |
| Add-on | Hydroxychloroquine in all patients (reduces flares, CV events) | Same |
| High-risk features | High-dose CYC or MMF + CNI (tacrolimus) for crescents, nephrotic-range proteinuria | - |
| New agents | Belimumab (anti-BLYS), voclosporin (CNI) | - |
| Repeat biopsy | Recommended for no response or nephritic flare | Same |
Treatment target: 25% proteinuria reduction at 3 months → 50% at 6 months → complete renal response (<500-700 mg/day) at 12 months.
- Rheumatology, 2-Volume Set, Elsevier 2022
10. Prognosis and Predictors of Outcome
Predictors of poor renal outcome:
- High chronicity index (CI >3) at presentation
- High baseline serum creatinine
- Crescentic nephritis (>30% crescents)
- Persistent hypertension
- Significant interstitial fibrosis/tubular atrophy on biopsy
- Class IV-G (global) > Class IV-S (segmental)
- Anti-Sm antibody positivity (associated with worse prognosis in Korean studies)
- Age >50 at onset - higher chronicity features, worse outcomes
Predictors of better response:
- Early biopsy and diagnosis
- Low CI at baseline
- Complete renal response within 12 months of treatment
- Adherence to hydroxychloroquine
PART 2: STEP-BY-STEP RESEARCH GUIDE
Study Design Overview
This is a retrospective or prospective clinicopathological observational study. Since it involves reviewing renal biopsies and applying scoring indices, it is primarily a hospital records-based descriptive-correlational study (for a 2nd-year MBBS student, retrospective is more feasible).
Step 1: Frame Your Research Objectives and Hypotheses
Primary objective:
- To classify LN biopsies by ISN/RPS class and apply NIH activity and chronicity indices, and correlate these with SLEDAI scores and renal function trajectory
Secondary objectives:
- To determine the distribution of ISN/RPS classes among your hospital's LN patients
- To correlate AI with SLEDAI-2K at time of biopsy
- To correlate CI with baseline creatinine and eGFR
- To assess CI as a predictor of renal outcome (doubling of serum creatinine, ESKD, or CKD progression)
- To compare AI and CI across ISN/RPS classes
Hypotheses:
- H1: Higher AI correlates positively with higher SLEDAI score
- H2: Higher CI correlates with lower eGFR and worse renal outcome
- H3: Class IV LN has significantly higher AI and CI than other classes
Step 2: Ethics Committee Approval and Registration
- Write a formal research protocol (title, background, objectives, methodology, inclusion/exclusion criteria, data variables, statistical plan)
- Prepare a Patient Information Sheet (PIS) and Written Informed Consent Form (waiver of consent may be granted for retrospective records-based studies - check with your IEC)
- Submit to Institutional Ethics Committee (IEC)
- Register on CTRI (ctri.nic.in) - mandatory in India for clinical research
Step 3: Sample Size Calculation
For a correlation study (Spearman's r expected ~0.5 between CI and eGFR based on published literature):
- n ≥ 50 biopsies provides adequate power for descriptive and correlation analysis
- Most published clinicopathological LN studies use 50-200 cases
- In a tertiary care nephrology department, 2-5 years of archived biopsies should yield adequate numbers
Use your institution's statistician to confirm sample size with:
n = [(Zα/2 + Zβ) / (0.5 × ln[(1+r)/(1-r)])]² + 3
Step 4: Inclusion and Exclusion Criteria
Inclusion:
- Biopsy-proven lupus nephritis
- SLE diagnosed by ACR (≥4/11) or SLICC criteria
- Age ≥14 years
- Adequate biopsy specimen (≥10 glomeruli for reliable scoring)
- Complete clinical records available (SLEDAI at biopsy, renal function labs)
Exclusion:
- Inadequate biopsy (< 10 glomeruli; precludes reliable AI/CI scoring)
- Overlapping renal diseases (e.g., diabetic nephropathy, IgA nephropathy)
- Incomplete clinical records
- Patients who received prior renal transplant
Step 5: Data Collection - Clinical Variables
Socio-demographic:
SLE-related:
- Duration of SLE before biopsy
- ACR/SLICC criteria met (list all)
- Prior immunosuppressive therapy
Activity score at time of biopsy:
- SLEDAI-2K score (calculated from clinical + lab data at biopsy)
- Anti-dsDNA titer (positive/negative + quantitative)
- Complement C3 and C4 levels
Renal clinical data:
- Serum creatinine at biopsy
- eGFR (use CKD-EPI 2021 creatinine equation)
- Urine protein:creatinine ratio (PCR) or 24-hour urine protein
- Urinalysis: RBC casts, WBC casts, hematuria, pyuria
- Blood pressure
Outcome follow-up data (at 6 months, 12 months, last follow-up):
- Serum creatinine trajectory
- eGFR trajectory
- Proteinuria (CRR / PRR / no response)
- Renal flares
- ESKD (dialysis or transplant)
- Death
Step 6: Renal Biopsy Processing and Histopathological Scoring
This is the pathology core of your study. Work closely with your Nephropathology / Pathology department supervisor.
Biopsy tissue processing (standard protocol):
- Light microscopy (LM): H&E, PAS, Jones silver (methenamine silver), Masson's trichrome
- Immunofluorescence (IF): Stain for IgG, IgA, IgM, C3, C1q, fibrinogen - "full-house" pattern is classical for LN
- Electron microscopy (EM): Locate mesangial, subendothelial, subepithelial deposits; identify tubuloreticular inclusions (TRIs)
Step A - ISN/RPS Classification:
Using LM as primary tool:
- Count total glomeruli and categorize each (normal, active lesion, chronic lesion, globally sclerosed)
- Determine class (I-VI) based on % glomeruli involved and pattern of involvement
- For Class III and IV, note subclass: A (active), C (chronic), A/C (both)
- Note presence of concomitant Class V (membranous) features
- Document extraglomerular lesions: tubular atrophy, interstitial fibrosis, vascular lesions (arterial hyalinosis, TMA), interstitial inflammation
Step B - NIH Activity Index Scoring (per glomerulus → overall %):
Score each of the 6 parameters on a 0-3 scale:
| Feature to Look For | How to Score |
|---|
| Endocapillary hypercellularity | % glomeruli with increased endocapillary cells occluding lumens |
| Neutrophils / karyorrhexis | % glomeruli with neutrophil infiltration or nuclear debris |
| Wire loops / hyaline thrombi | % glomeruli with massive subendothelial deposits |
| Fibrinoid necrosis | % glomeruli with eosinophilic material replacing normal architecture |
| Cellular crescents | % glomeruli with cellular or fibrocellular crescents |
| Interstitial inflammation | % cortical interstitium with leukocyte infiltration |
Apply double weight to fibrinoid necrosis and cellular crescents, then sum.
Step C - NIH Chronicity Index Scoring:
| Feature | How to Score |
|---|
| Global glomerulosclerosis | % total glomeruli that are globally sclerosed |
| Fibrous crescents | % glomeruli with fibrous (old) crescents |
| Tubular atrophy | % cortical tubules with atrophied epithelium |
| Interstitial fibrosis | % cortical interstitium replaced by fibrosis (Masson's trichrome helps) |
Sum all four (equal weight). Total = 0 to 12.
Inter-observer reliability: Have two pathologists score each biopsy independently. Calculate Cohen's Kappa (κ) for agreement. κ >0.6 = substantial agreement.
Step 7: Statistical Analysis Plan
Use SPSS, Stata, or free tool Jamovi / R.
| Analysis | Test | Purpose |
|---|
| Describe sample | Mean ± SD, median (IQR), frequencies | Characterize cohort |
| Distribution of ISN/RPS classes | Frequency table + pie chart | Epidemiology |
| Compare AI and CI across ISN/RPS classes | Kruskal-Wallis + post-hoc Dunn test | Which classes have highest indices? |
| Correlation: AI vs SLEDAI | Spearman's rank correlation (rs) | Primary correlation |
| Correlation: CI vs eGFR at biopsy | Spearman's rs | Chronicity-function correlation |
| Correlation: AI vs baseline creatinine | Spearman's rs | |
| Correlation: CI vs proteinuria | Spearman's rs | |
| Predictors of renal outcome (doubling of creatinine / ESKD) | Binary logistic regression | Multivariate analysis |
| ROC curve: CI as predictor of ESKD | AUC-ROC + optimal cutoff | Clinical threshold |
| Correlation: AI at biopsy vs renal response at 12 months | Spearman's rs | Treatment correlation |
Why Spearman's and not Pearson's? Both AI/CI and SLEDAI are ordinal/semi-quantitative scales and may not be normally distributed - use Spearman's (non-parametric). Confirm normality first with Shapiro-Wilk test.
Step 8: Variables Summary Table (Data Collection Sheet)
| Variable Category | Variables to Record |
|---|
| Demographic | Age, sex, ethnicity, disease duration |
| Classification | ACR/SLICC criteria (list), diagnosis date |
| Activity at biopsy | SLEDAI-2K total, renal SLEDAI subscore, anti-dsDNA, C3, C4 |
| Renal function at biopsy | SCr, eGFR, PCR/24hr protein, urinalysis |
| Biopsy data | No. of glomeruli, ISN/RPS class, subclass (A/C/AC), AI (6 parameters + total), CI (4 parameters + total), IF pattern |
| Treatment | Induction regimen, dose, start date |
| Follow-up outcomes | SCr, eGFR, proteinuria at 3m/6m/12m; CRR/PRR/NR; renal flares; ESKD |
Step 9: Writing Your Dissertation
Structure:
- Title: Clinicopathological study of lupus nephritis with emphasis on activity/chronicity indices and outcome correlation
- Abstract: Structured (Background, Methods, Results, Conclusion) - 250-300 words
- Introduction: SLE burden, LN incidence, importance of biopsy, gap in local data, objectives
- Review of Literature: ISKDC original classification, ISN/RPS 2003 and 2018 revision, Austin 1984 NIH indices, key outcome studies
- Materials and Methods: Design, setting, period, ethics, sample, collection, scoring protocol, statistics
- Results:
- Demographic table
- ISN/RPS class distribution (with pie chart)
- AI and CI distribution per class (box plots)
- Scatter plots: AI vs SLEDAI, CI vs eGFR
- Spearman's correlation tables
- Logistic regression for ESKD predictors
- Discussion: Compare your findings with Indian and international published data; discuss pathological basis for correlations; limitations
- Conclusion: Answer your objectives directly
- References: Vancouver style
- Annexures: Ethics certificate, CTRI registration, consent form, proforma, master chart (all cases in a spreadsheet)
Step 10: Timeline
| Month | Activity |
|---|
| 1-2 | IEC protocol submission, CTRI registration, literature review |
| 3 | IEC approval, prepare data collection proforma |
| 4-8 | Retrospective data collection from records + biopsy re-review |
| 9 | Statistical analysis |
| 10-11 | Write dissertation |
| 12 | Submit, defend, prepare manuscript |
Key Points for Viva / Defense
- ISN/RPS classification is based primarily on light microscopy and the percentage of glomeruli involved
- The AI reflects reversible injury; CI reflects irreversible scarring
- Fibrinoid necrosis and crescents are double-weighted in the AI because they indicate the worst acute injury
- A CI >3 predicts poor long-term renal survival - it is the single strongest biopsy predictor of ESKD
- "Full-house" immunofluorescence (IgG + IgA + IgM + C3 + C1q) is pathognomonic of LN
- SLEDAI reflects systemic disease activity; AI reflects renal histological activity - these do not always correlate, because urinalysis may underestimate biopsy severity
- Class VI (>90% sclerosis) does not benefit from further immunosuppression - recognizing this via CI prevents treatment harm
- In India/Asia, Class IV LN predominates and carries worse outcomes than in Western cohorts
- Repeat biopsy after treatment guides whether to de-escalate or intensify immunosuppression
- The 2018 revision replaced the A/C/AC subclassification with explicit AI/CI scoring - this is now the recommended approach
Primary Sources:
- Henry's Clinical Diagnosis and Management by Laboratory Methods (Chapter 55: Lupus Nephritis - ISN/RPS classification, NIH AI/CI scoring)
- Brenner and Rector's The Kidney, 2-Volume Set (Chapter: LN in Asian populations, treatment outcomes)
- Rheumatology, 2-Volume Set, Elsevier 2022 (Treatment targets, induction/maintenance regimens)
- Comprehensive Clinical Nephrology, 7th Edition (LN in pregnancy, repeat biopsy)
- Firestein & Kelley's Textbook of Rheumatology (SLEDAI-2K scoring)
- National Kidney Foundation Primer on Kidney Diseases, 8e (ISN/RPS classification table)
- PMC10085727: Histologic evaluation of activity and chronicity of lupus nephritis (2023)
- PMC12800592: Characterizing NIH AI and CI in 2 independent LN cohorts (2026)
- Frontiers in Lupus: Clinical and histopathological features of LN and risk of long-term kidney outcomes, Indonesia (2025) - confirmed significant linear correlation between SLEDAI-R and histopathological AI (p<0.001)