
You are an expert HKMLE tutor helping me ACE the Hong Kong Medical Licensing Examination (Papers 1 and 2). Create a high-yield, comprehensive, beginner-friendly study note for the topic below. You are FULLY AUTHORISED to add any sections, mnemonics, tables, diagrams (text-based), clinical pearls, trap warnings, red flags, drug interactions, trial data, comparisons, flowcharts, quick summaries, or anything else you think will help me ACE this exam. --- DIAGRAM REQUIREMENTS --- If you can generate actual images/diagrams, include them. If not, use clear written descriptions instead of text-based ASCII diagrams. --- REQUIREMENTS --- For each major condition, include: - Definition - Classification (with table where helpful) - Aetiology / Causes (with a BOLD mnemonic) - Pathophysiology (step-by-step, beginner-friendly) - Risk factors (with mnemonic) - Symptoms (with mnemonic) - Signs (with mnemonic) - Investigations (with mnemonic). Provide a prioritised diagnostic algorithm (Bedside → Labs → Imaging). - Management (acute and chronic, with mnemonics for treatment steps). Differentiate standard international guidelines from local Hong Kong Hospital Authority (HA) protocols and Centre for Health Protection (CHP) recommendations. Break down emergency steps into explicit verbal orders. - Complications (with mnemonic where possible) - Prognosis (with mnemonic where possible) --- ADD THESE ELEMENTS THROUGHOUT --- - :warning: HKMLE TRAP boxes (Highlight where standard US/UK textbook answers will cause me to lose marks on Paper 1 & 2) - :office: HA CLINICAL PATHWAY boxes (Specify default drug formulations, staging systems, or referral pathways used in HK public hospitals) - :clipboard: CHP STATUTORY NOTIFICATION boxes (Explicitly flag if the condition is a statutory notifiable infectious disease in HK) - :earth_asia: LOCAL EPIDEMIOLOGY VARIANT boxes (Highlight high-prevalence local variations, e.g., Klebsiella liver abscesses, Recurrent Pyogenic Cholangitis, local Thalassemia/G6PD patterns) - :clipboard: INVESTIGATION INTERPRETATION boxes (Provide a classic raw data result example—e.g., ABG, CSF, ECG—and its 1-sentence interpretation) - :scales: LEGAL & ETHICAL ORDINANCE boxes (Flag relevant local legislation, e.g., Cap. 136 Mental Health Ordinance or mandatory reporting rules) - :pushpin: QUICK SUMMARY boxes - :rotating_light: RED FLAGS box - :question: COMMON EXAM QUESTION box - :microscope: BASIC SCIENCE INTEGRATION box --- REQUIRED TABLES AT THE END --- - :warning: DRUG TRAPS table - :bar_chart: NOTABLE TRIALS table - :brain: MASTER MNEMONICS table - :link: CROSS-MODULE LINKS --- TOPIC --- - Aortic stenosis (AS) — causes (bicuspid, calcific, rheumatic), pathophysiology, symptoms (SAD), signs (slow-rising pulse, narrow pulse pressure, ejection systolic murmur), investigations (Echo, catheterisation), management (TAVI vs SAVR), indications for surgery. Generate the complete ace-level pdf note now.
"aortic stenosis"[MeSH Terms] AND "transcatheter aortic valve replacement"[MeSH Terms]
Hong Kong Hospital Authority aortic stenosis TAVI guidelines CHP 2024 2025
aortic stenosis echocardiogram pressure gradient valve area diagram
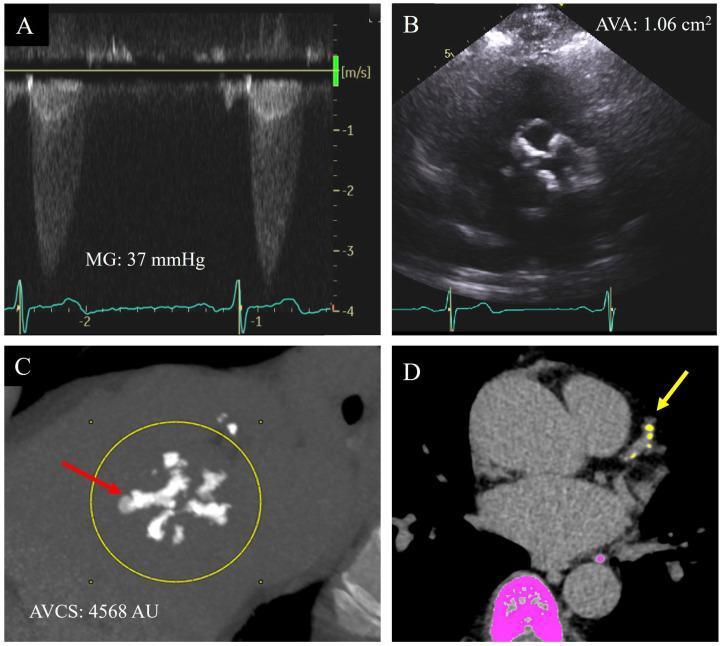
This four-panel image illustrates a multimodal diagnostic approach for assessing aortic stenosis severity in a patient with a bicuspid aortic valve. Panel A shows a spectral Doppler echocardiogram measuring a mean systolic pressure gradient (MG) of 37 mmHg, while Panel B provides a 2D transthoracic echocardiogram in short-axis view calculating an aortic valve area (AVA) of 1.06 cm². Both ultrasound panels include concurrent ECG monitoring. Panel C displays a non-contrast cardiac CT cross-section of the aortic valve, revealing extensive, dense, and irregular calcifications within the leaflets (red arrow). A yellow circular ROI highlights the area used to determine an Aortic Valve Calcium Score (AVCS) of 4568 Agatston Units (AU), a value indicative of severe stenosis. Panel D is a cardiac CT axial slice showing concurrent coronary artery calcification within the left anterior descending (LAD) coronary artery (yellow arrow), with pink and yellow automated overlays used for calcium quantification. The collection demonstrates how cardiac CT calcium scoring can resolve diagnostic discordance in echocardiographic parameters for valvular heart disease.
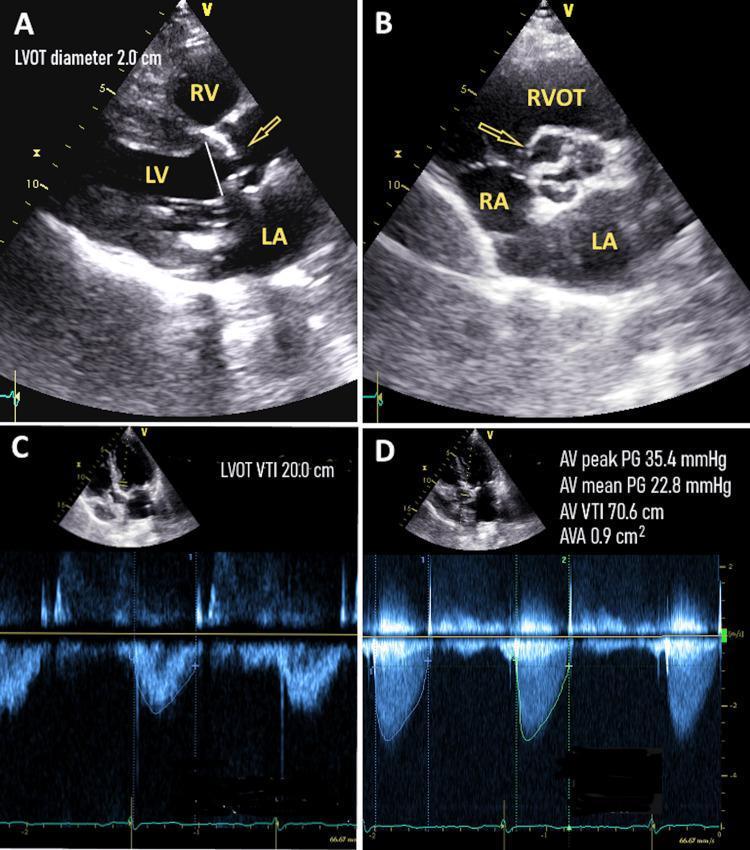
Transthoracic echocardiogram (TTE) panel demonstrating the diagnostic assessment of aortic stenosis. Panel A shows a parasternal long-axis view with a thickened, calcified aortic valve and restricted leaflet opening (arrow); the Left Ventricle Outflow Tract (LVOT) diameter is measured. Panel B provides a parasternal short-axis view (basin view) confirming valvular calcification and reduced orifice area. Panel C displays pulsed-wave Doppler at the apical five-chamber view measuring the LVOT Velocity Time Integral (VTI) at 20.0 cm. Panel D utilizes continuous-wave Doppler across the aortic valve to calculate hemodynamic parameters, including a mean pressure gradient of 22.8 mmHg and a calculated Aortic Valve Area (AVA) of 0.9 cm². The combination of these findings—specifically a low mean gradient (<40 mmHg) despite a small valve area (<1.0 cm²)—is characteristic of low-gradient severe aortic stenosis. Key anatomical landmarks labeled include the Left Ventricle (LV), Right Ventricle (RV), Left Atrium (LA), and Right Atrium (RA).
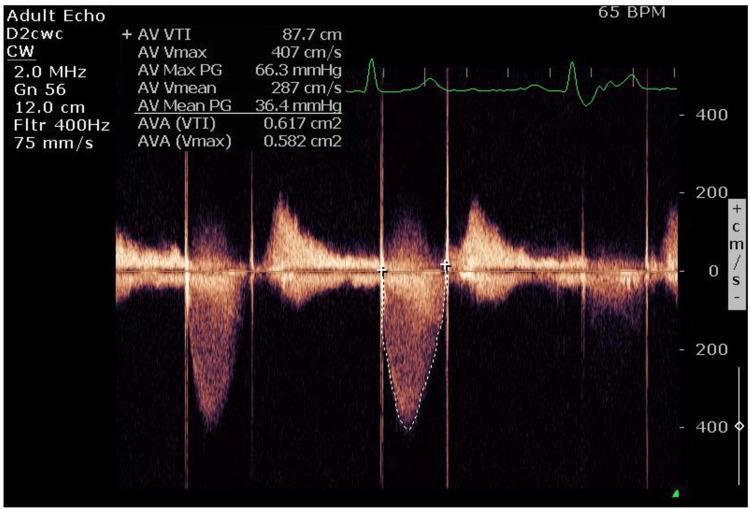
This diagnostic image shows a continuous wave (CW) Doppler spectral tracing from a transthoracic echocardiogram (TTE) focused on the aortic valve (AV). The display exhibits a characteristic high-velocity systolic jet below the baseline, indicating flow away from the transducer, with a dense, filled-in spectral envelope typical of significant valvular stenosis. Superimposed on the display is an ECG rhythm strip showing a heart rate of 65 BPM. Key quantitative hemodynamic measurements for the aortic valve are displayed in the upper-left overlay: Vmax of 407 cm/s, Maximum Pressure Gradient (Max PG) of 66.3 mmHg, and Mean Pressure Gradient (Mean PG) of 36.4 mmHg. The calculated aortic valve area (AVA) is approximately 0.6 cm², suggestive of severe aortic stenosis or prosthetic valve dysfunction. The image serves as a clinical illustration of hemodynamic assessment in valvular heart disease post-thrombolytic therapy (tPA) to evaluate improvement in transvalvular gradients and valve area.
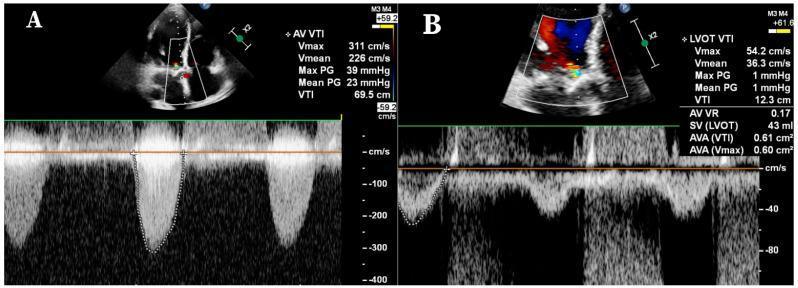
This diagnostic image consists of two panels (A and B) from a transthoracic echocardiogram (TTE) using Doppler ultrasound to evaluate a patient for aortic stenosis. Panel A demonstrates continuous wave (CW) Doppler across the aortic valve, showing a systolic, envelope-shaped spectral tracing below the baseline. Measurements indicate a maximum velocity (Vmax) of 311 cm/s and a mean pressure gradient of 23 mmHg, which are typically associated with non-severe gradients. Panel B shows pulsed wave (PW) Doppler of the left ventricular outflow tract (LVOT). The clinical significance lies in the calculated aortic valve area (AVA) of 0.61 cm² and an LVOT velocity time integral (VTI) of 12.3 cm. These findings highlight a 'low-flow, low-gradient' aortic stenosis phenotype, where the calculated valve area indicates critical stenosis despite relatively low pressure gradients and velocities. This comparison is an essential educational tool for understanding discordant echocardiographic parameters in valvular heart disease.
"aortic stenosis" AND "transcatheter" AND "surgical" AND "low risk"
PMID: 37874020
PMID: 38588025
aortic stenosis slow rising pulse parvus tardus carotid waveform signs
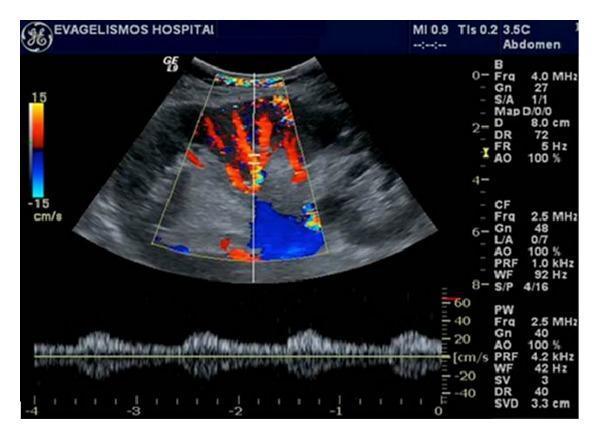
This spectral Doppler ultrasound image of a renal transplant illustrates diagnostic signs of renal artery stenosis. The top panel shows a color Doppler view of the intrarenal vasculature, with red and blue signals indicating flow toward and away from the transducer, respectively. The lower panel displays a pulse-wave spectral Doppler tracing from an intrarenal arterial branch. The waveform exhibits a classic 'tardus parvus' pattern, characterized by a delayed systolic upstroke (prolonged acceleration time), a rounded, blunted systolic peak of low amplitude, and a slow decay. These damping effects occur distal to a high-grade proximal stenosis. Key imaging parameters on the sidebar indicate a 4.0 MHz transducer frequency for B-mode and 2.5 MHz for Doppler, with a pulse repetition frequency (PRF) of 4.2 kHz. This clinical finding is a critical indicator for evaluating graft dysfunction and vascular complications in the early post-transplant period.
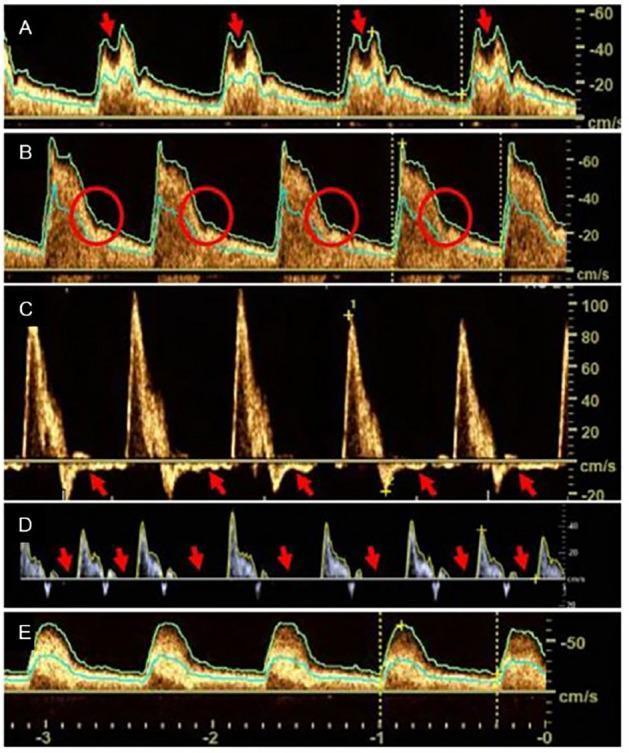
This diagnostic image set consists of five neurovascular ultrasound (nvUS) spectral Doppler waveforms (Panels A–E) illustrating pathological flow profiles in the carotid arteries associated with aortic valve disease. Panel A displays a 'bisferious pulse' (pulsus bisferiens) in the internal carotid artery (ICA), characterized by two systolic peaks marked by red arrows. Panel B shows the ICA with an absent dicrotic notch, indicated by red circles during the early diastolic phase. Panel C demonstrates 'diastolic reversal' in the common carotid artery (CCA), with red arrows highlighting retrograde flow below the baseline during diastole, a classic sign of severe aortic regurgitation. Panel D shows 'zero diastole,' where diastolic flow velocity reaches the baseline (red arrows), indicating high resistance or significant valvular pathology. Panel E illustrates 'pulsus tardus et parvus' in the ICA, characterized by a prolonged systolic upstroke (tardus) and low peak systolic velocity (parvus), typically indicative of aortic valve stenosis. These Doppler waveforms serve as clinical markers for secondary hemodynamic effects of valvular heart disease on cerebral perfusion.
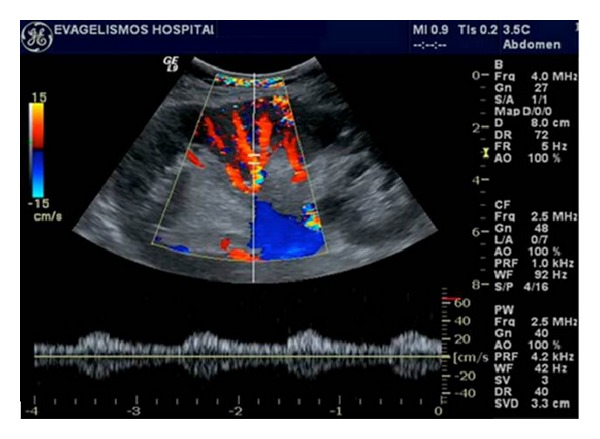
**Imaging Modality:** Spectral Doppler and Color Doppler Ultrasound. **Anatomical Region:** Intrarenal arterial vasculature within the renal parenchyma. **Observed Pathology:** Abnormal arterial hemodynamics consistent with a "tardus parvus" waveform, typically diagnostic of significant proximal renal artery stenosis (RAS). **Characteristic Visual Features:** * **Spectral Doppler:** The waveform demonstrates a delayed systolic upstroke (prolonged acceleration time) and a reduced, rounded systolic peak (low peak systolic velocity). There is a loss of the early systolic notch. * **Color Doppler:** The upper panel shows color flow within the renal vasculature, mapping the sampling gate for the pulse wave (PW) Doppler acquisition. * **Quantitative Indices:** Visible scale indicating low velocity and dampened pulsatility compared to normal intrarenal arterial standards. **Key Diagnostic Features:** The "tardus" (slow/late) and "parvus" (small/weak) morphology serves as an indirect sign of high-grade upstream obstruction. This pattern is characterized by an acceleration time (AT) typically exceeding 0.07 seconds and a diminished resistive index (RI), reflecting dampened pressure distal to a stenotic segment.
"aortic stenosis" AND "asymptomatic" AND "early intervention"
PMID: 39466903
ls -la /tmp/workspace/ 2>/dev/null || mkdir -p /tmp/workspace && echo "Created workspace"