
Basal ganglia components connection functions Pathophysiology of Parkinsonism clinical features and treatment 15 marks mbbs answer 1st year
"Parkinson disease"[MeSH Terms] AND treatment
basal ganglia direct and indirect pathway diagram substantia nigra thalamus
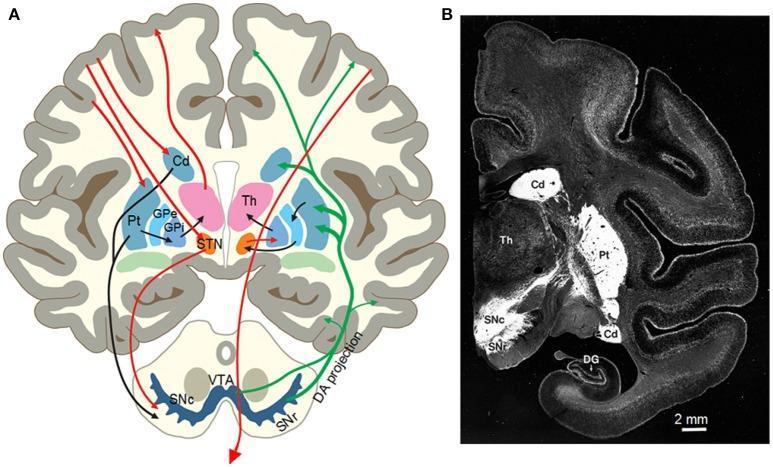
This dual-panel image provides an anatomical and histological overview of the basal ganglia and nigrostriatal systems. Panel A is a color-coded anatomical diagram of a coronal brain section illustrating basal ganglia circuitry. It depicts the direct pathway (red arrows), indirect pathway (black arrows), and dopaminergic (DA) projections (green arrows). Key labeled structures include the Caudate nucleus (Cd), Putamen (Pt), Thalamus (Th), Subthalamic Nucleus (STN), Globus Pallidus external (GPe) and internal (GPi) segments, Substantia Nigra pars compacta (SNc), Substantia Nigra reticulata (SNr), and Ventral Tegmental Area (VTA). Panel B is a coronal histological photograph of a monkey brain using Dopamine Transporter (DAT) immunostaining. The image shows intense white signal in the striatum (caudate and putamen) and the SNc, indicating high density of dopamine innervation compared to the darker surrounding cortical and thalamic tissue. This material is pedagogically significant for understanding Parkinson’s disease pathophysiology and the anatomical organization of motor control circuits.
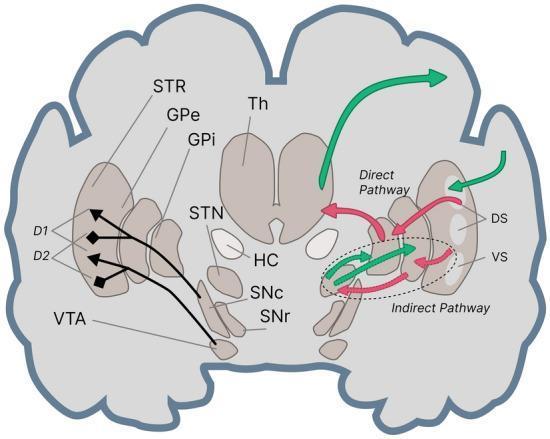
This medical illustration presents a coronally sectioned schematic of the human brain, specifically detailing the functional neuroanatomy and pathways of the basal ganglia. The diagram categorizes the striatum (STR) into the dorsal striatum (DS) and ventral striatum (VS), the latter including the nucleus accumbens. Key subcortical structures identified include the Thalamus (Th), Globus Pallidus external (GPe) and internal (GPi) segments, Subthalamic Nucleus (STN), Hippocampus (HC), Substantia Nigra pars compacta (SNc), Substantia Nigra pars reticulata (SNr), and the Ventral Tegmental Area (VTA). The primary focus is the visual differentiation of motor and cognitive circuits via the direct and indirect pathways. Green arrows represent the direct pathway, illustrating excitatory projections that facilitate movement or cognitive gating, while red arrows denote the indirect pathway, representing inhibitory circuits. Dopaminergic modulation is highlighted by labeling D1 (excitatory) and D2 (inhibitory) receptors within the striatum, showing projections from the midbrain (VTA/SNc). This anatomical model is essential for understanding movement disorders like Parkinson’s disease and cognitive processes involving reward and habituation.
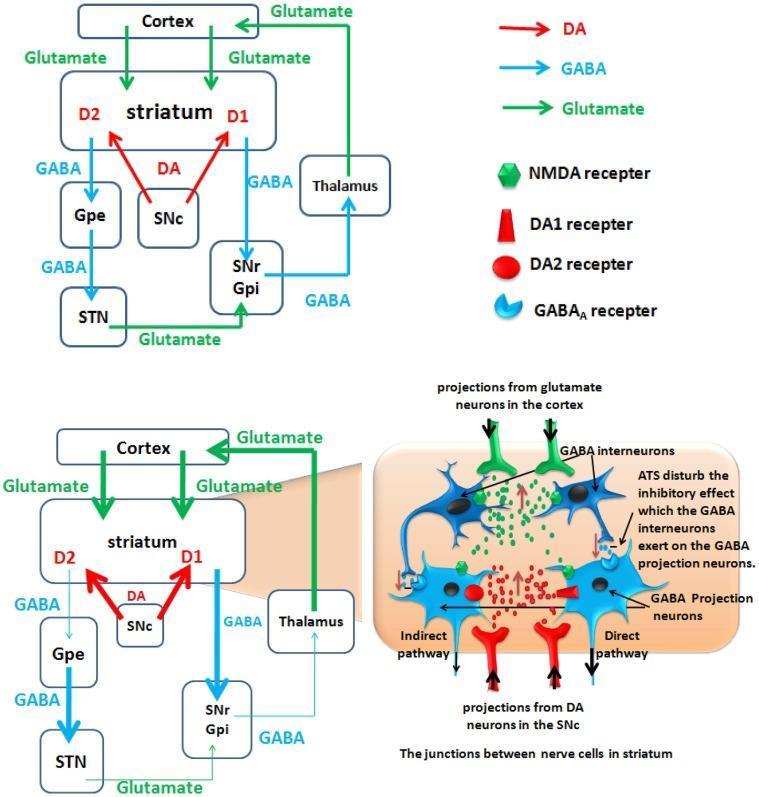
This pathophysiology diagram illustrates a hypothetical model of basal ganglia circuitry and the neurobiological effects of amphetamine-type stimulants (ATS). The top panel shows the normal state, detailing the balance between direct and indirect pathways. Key structures include the cortex, striatum (D1/D2 receptors), globus pallidus external (GPe) and internal (GPi), subthalamic nucleus (STN), substantia nigra pars compacta (SNc) and reticulata (SNr), and the thalamus. Neurotransmitter flow is color-coded: green for glutamate (excitatory), blue for GABA (inhibitory), and red for dopamine (DA). The bottom panel depicts the ATS-altered state, showing pathologically thickened lines representing enhanced dopaminergic and glutamatergic signaling. A detailed inset focuses on the striatal microenvironment, highlighting how ATS disturb the inhibitory influence of GABA interneurons on GABA projection neurons. This disruption leads to over-activation of the direct pathway and inhibition of the indirect pathway, ultimately resulting in increased glutamate release from the thalamus to the cortex. This model explains the polysynaptic mechanisms underlying ATS use disorders and neurotoxicity.
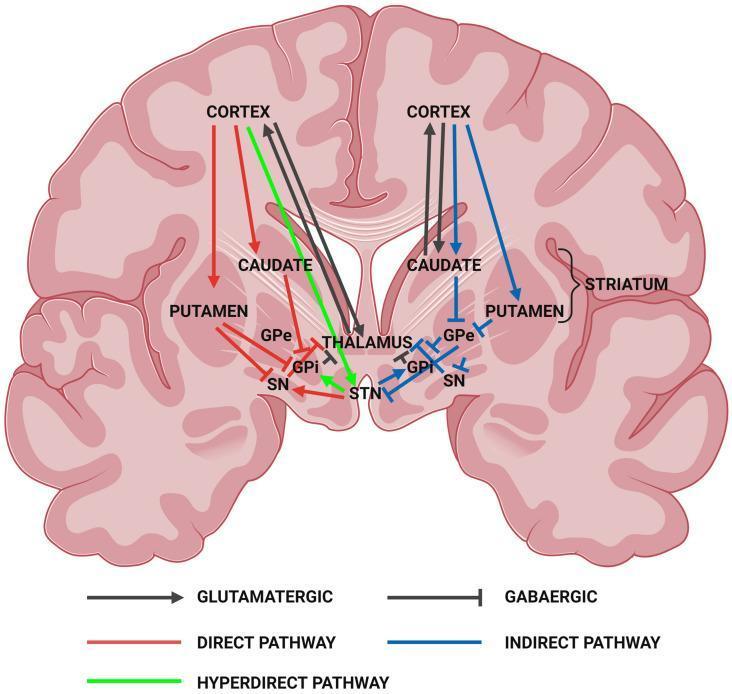
This medical illustration presents a pathophysiology diagram of the human brain in coronal section, focusing on the motor circuitry of the basal ganglia. The diagram maps the structural and functional relationships between the cerebral cortex, striatum (caudate nucleus and putamen), globus pallidus externa (GPe), globus pallidus interna (GPi), subthalamic nucleus (STN), substantia nigra (SN), and thalamus. Three primary signaling pathways are color-coded: the Direct Pathway (red), which facilitates movement; the Indirect Pathway (blue), which inhibits movement; and the Hyperdirect Pathway (green). The visual also utilizes distinct arrowheads to indicate neurotransmitter types: pointed arrows represent excitatory glutamatergic projections (e.g., from the cortex and STN), while T-shaped bars represent inhibitory GABAergic projections (e.g., from the striatum and globus pallidus). This anatomical model is essential for understanding neurodegenerative movement disorders such as Huntington’s Disease and Parkinsonism, specifically how striatal degeneration alters cortical excitation and inhibition loops.
Basal Ganglia and Parkinsonism — 15 Marks
A. BASAL GANGLIA
1. Components (Anatomical Parts)
| Structure | Sub-parts |
|---|---|
| Corpus striatum | Caudate nucleus + Putamen (= Neostriatum/Striatum) |
| Lenticular nucleus | Putamen + Globus pallidus (external segment - GPe, internal segment - GPi) |
| Subthalamic nucleus (STN) | in diencephalon |
| Substantia nigra | pars compacta (SNpc - dopaminergic) and pars reticulata (SNpr - GABAergic) |
| Amygdala | often included functionally (limbic component) |
2. Connections (Circuitry)
- Direct pathway: Striatum ⊣(GABA) GPi/SNpr ⊣(GABA) Thalamus → Cortex. Net effect: disinhibits thalamus → excites motor cortex → facilitates movement.
- Indirect pathway: Striatum ⊣(GABA) GPe ⊣(GABA) STN →(glutamate, excitatory) GPi/SNpr ⊣(GABA) Thalamus → Cortex. Net effect: has an extra inhibitory relay → inhibits thalamus → suppresses movement.
3. Functions
- Planning and smooth execution of voluntary movement (working with the cortex and cerebellum)
- Regulation of muscle tone and posture
- Suppression of unwanted/competing movements
- Contribution to cognitive functions (procedural learning, working memory) and affective/limbic functions (via ventral striatum - nucleus accumbens)
- Contains no direct connection to lower motor neurons; it acts entirely by modulating cortical output through the thalamus.
B. PARKINSONISM
1. Definition
2. Pathophysiology
- Core lesion: progressive degeneration of dopaminergic neurons of the substantia nigra pars compacta, with loss of the nigrostriatal dopamine pathway. Motor symptoms appear once striatal dopamine falls by ~60-80%.
- Pathological hallmark: intracytoplasmic inclusions called Lewy bodies, composed of aggregated α-synuclein; PD is now regarded as a synucleinopathy. Braak staging shows pathology beginning in the olfactory bulb/medulla (stage 1-2, causing pre-motor hyposmia, constipation, REM sleep behaviour disorder), reaching the substantia nigra at stage 3 (onset of motor features), and later the cortex (stages 5-6, causing dementia) - Katzung's Basic and Clinical Pharmacology, p. 282-297.
- Etiology: mostly idiopathic; genetic forms involve SNCA (α-synuclein), PARK2 (parkin), LRRK2, PINK1 genes; secondary causes include drugs (dopamine receptor blockers/antipsychotics), toxins (MPTP, manganese, CO), post-encephalitic states, and vascular (multi-infarct) parkinsonism.
- Circuit consequence of dopamine loss: Loss of nigrostriatal dopamine removes the normal facilitation of the direct pathway (D1) and disinhibition of the indirect pathway (D2). Net result:
- Indirect pathway becomes overactive → excessive inhibition of thalamus.
- Direct pathway becomes underactive → reduced facilitation of thalamus.
- Both changes converge to excessively inhibit the thalamocortical projection, reducing excitatory drive to the motor cortex → bradykinesia/akinesia and rigidity.
- There is also a relative cholinergic excess in the striatum (since dopamine normally restrains striatal cholinergic interneurons), contributing to tremor and rigidity - hence anticholinergic drugs help.
3. Clinical Features
- Tremor - 4-6 Hz "pill-rolling" rest tremor, decreases with voluntary movement
- Rigidity - "lead-pipe" or "cogwheel" rigidity
- Akinesia/Bradykinesia - slowness in initiation and execution of movement, micrographia, hypomimia (masked facies), hypophonia
- Postural instability - stooped/flexed posture, shuffling festinant gait, loss of postural reflexes, freezing episodes
- Asymmetrical onset
- Reduced arm swing while walking
- Non-motor features: anosmia, constipation, REM sleep behaviour disorder, depression/anxiety, autonomic dysfunction (orthostatic hypotension, sialorrhea, sphincter disturbance), cognitive decline/dementia in advanced disease - Bradley and Daroff's Neurology in Clinical Practice, p. 2323-2424; Katzung's Basic and Clinical Pharmacology, p. 282.
4. Treatment
| Drug class | Example | Mechanism/Notes |
|---|---|---|
| Dopamine precursor | Levodopa + carbidopa (carbidopa = peripheral decarboxylase inhibitor, prevents peripheral conversion/side effects, allows more L-dopa to cross BBB) | Most effective; crosses BBB via LAT transporter, converted to dopamine in brain. Long-term use → motor fluctuations ("wearing-off," "on-off") and dyskinesias |
| Dopamine agonists | Pramipexole, Ropinirole, Bromocriptine, Rotigotine | Directly stimulate D2 (and D1/D3) receptors; useful early, especially in younger patients to delay levodopa-related dyskinesia |
| MAO-B inhibitors | Selegiline, Rasagiline | Block dopamine breakdown, mild symptomatic benefit, possible neuroprotection |
| COMT inhibitors | Entacapone, Tolcapone | Prevent peripheral breakdown of levodopa, prolong its action, used as adjunct in fluctuations |
| Anticholinergics | Trihexyphenidyl, Benzhexol | Correct relative cholinergic excess; useful mainly for tremor in younger patients; avoid in elderly (cognitive side effects) |
| Amantadine | - | Weak NMDA antagonist and increases dopamine release; helps dyskinesias and mild symptoms |
-
Deep Brain Stimulation (DBS) of subthalamic nucleus or GPi - for advanced disease with motor fluctuations refractory to medical therapy, or disabling tremor
-
Physiotherapy, speech therapy, occupational therapy, and exercise programs
-
Supportive care for non-motor symptoms (antidepressants, management of autonomic dysfunction)
-
Katzung's Basic and Clinical Pharmacology, p. 299-322.
Summary Diagram for Answer
Hypothalamus functions in detail
hypothalamus function
Hypothalamus - Functions in Detail
Location and Overview
1. Autonomic Nervous System Regulation
- Posterior and lateral hypothalamus - stimulation raises heart rate and arterial blood pressure (sympathetic effects)
- Preoptic/anterior hypothalamus - stimulation lowers heart rate and blood pressure (parasympathetic effects)
- These effects act via cardiovascular centers in the pontine and medullary reticular formation - Guyton and Hall Textbook of Medical Physiology, p. 734.
2. Body Temperature Regulation
- Anterior hypothalamic-preoptic area contains heat-sensitive and cold-sensitive neurons that directly sense blood temperature. Heating this area triggers sweating and cutaneous vasodilation to lose heat; cooling triggers vasoconstriction and shivering to conserve/produce heat.
- Posterior hypothalamus integrates signals from peripheral skin thermoreceptors with the anterior hypothalamic thermostat and coordinates heat-conserving/heat-producing responses (shivering, vasoconstriction) - Guyton and Hall Textbook of Medical Physiology, p. 896.
3. Regulation of Water Balance and Thirst
- Osmoreceptors in the hypothalamus near the supraoptic nuclei detect plasma osmolality; increased osmolality stimulates ADH (vasopressin) synthesis in the supraoptic nucleus, transported down axons to the posterior pituitary for release, promoting renal water reabsorption.
- The hypothalamus also generates the thirst sensation, driving water-seeking behaviour.
4. Control of Feeding and Energy Balance
- Lateral hypothalamic area = "feeding/hunger center" - stimulation causes voracious appetite; bilateral destruction causes anorexia and starvation.
- Ventromedial nucleus = "satiety center" - stimulation abolishes hunger; bilateral destruction causes hyperphagia and obesity.
- Arcuate nucleus contains orexigenic (NPY/AgRP) and anorexigenic (POMC/CART) neurons that integrate leptin, ghrelin, and insulin signals to regulate appetite and energy expenditure.
- Mammillary bodies partially control feeding reflexes such as licking and swallowing - Guyton and Hall Textbook of Medical Physiology, p. 735.
5. Endocrine Control
- TRH → TSH; CRH → ACTH; GnRH → LH/FSH; GHRH and somatostatin → GH; dopamine (PIH) → inhibits prolactin.
- ADH (vasopressin) from the supraoptic nucleus - water reabsorption, vasoconstriction.
- Oxytocin from the paraventricular nucleus - uterine contraction during labor and milk ejection reflex during breastfeeding - Guyton and Hall Textbook of Medical Physiology, p. 735.
6. Circadian Rhythm Control
7. Emotional and Behavioral Responses
- Generates the visceral/somatic expressions of emotion - rage, fear, aggression, pleasure (stimulation of specific nuclei can provoke defensive/attack behaviour or reward-seeking behaviour).
- Regulates sexual behaviour and reproductive drive via connections with the anterior pituitary gonadotropins and limbic structures.
- Mammillary bodies form part of the Papez circuit, contributing to memory consolidation (their bilateral damage, as in Wernicke-Korsakoff syndrome, causes amnesia).
8. Regulation of Sexual and Reproductive Function
9. Gastrointestinal Regulation
Quick Summary Table
| Region/Nucleus | Main Function |
|---|---|
| Supraoptic nucleus | ADH synthesis |
| Paraventricular nucleus | Oxytocin synthesis, CRH |
| Suprachiasmatic nucleus | Circadian rhythm ("master clock") |
| Arcuate nucleus | Appetite regulation, GHRH/dopamine |
| Ventromedial nucleus | Satiety center |
| Lateral hypothalamic area | Hunger/thirst center |
| Anterior/preoptic area | Heat loss, parasympathetic effects |
| Posterior hypothalamus | Heat conservation/production, sympathetic effects |
| Mammillary bodies | Feeding reflexes, memory (Papez circuit) |
Different parts of the ear and mechanism of hearing 15 marks
anatomy of the ear external middle inner ear cochlea diagram
organ of Corti basilar membrane hair cells diagram
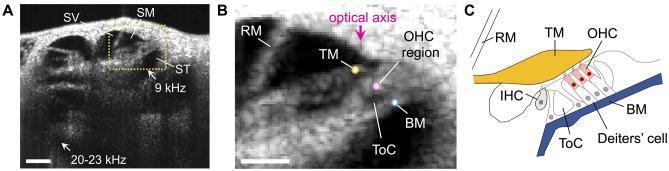
This figure presents optical coherence tomography (OCT) imaging and anatomical schematics of the mouse cochlea used for auditory research. Panel A is a cross-sectional OCT image showing the three fluid-filled scalae: scala vestibuli (SV), scala media (SM), and scala tympani (ST). A yellow dotted box highlights the apical region tuned to 9 kHz, while an arrow indicates the middle-turn region tuned to 20-23 kHz. Panel B provides a magnified view of the 9 kHz region, detailing key micromechanical structures including Reissner’s membrane (RM), the tectorial membrane (TM), the outer hair cell (OHC) region, the basilar membrane (BM), and the tunnel of Corti (ToC). Colored dots indicate specific measurement points, and a pink arrow defines the optical axis used for vibration measurements. Panel C is a corresponding anatomical diagram labeling the inner hair cells (IHC), OHCs, Deiters' cells, TM, BM, RM, and ToC. This educational resource illustrates the application of high-resolution imaging to study cochlear frequency tuning and the physiological mechanics of the organ of Corti.
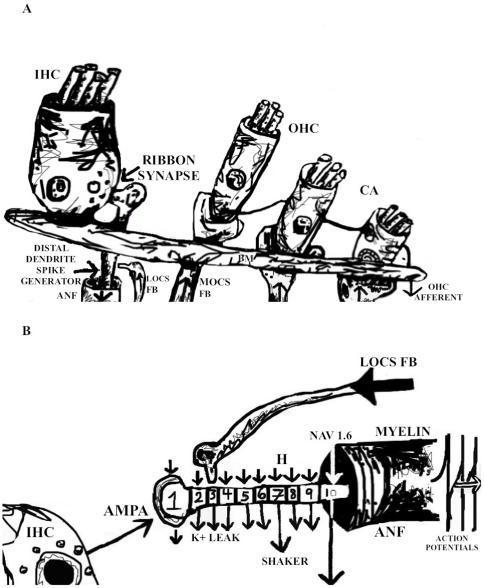
A two-part medical illustration depicting the mammalian auditory periphery and a functional model of an auditory nerve fiber (ANF).
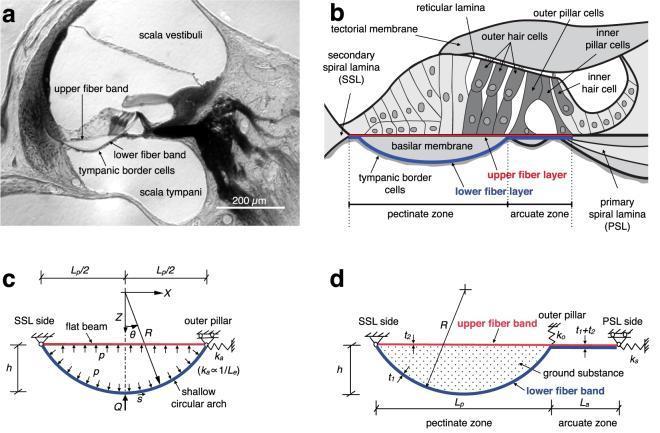
A multi-panel figure illustrating the ultrastructure and biomechanical modeling of the gerbil cochlea, specifically the basilar membrane (BM) and organ of Corti. Panel (a) is a microscopy image showing the anatomical cross-section with a flat upper fiber band, an arch-shaped lower fiber band, and associated tympanic border cells (TBCs) bordering the scala tympani. Panel (b) provides a detailed anatomical diagram identifying the arcuate zone (AZ) and pectinate zone (PZ). In the AZ, collagen fibers form a unified layer, while in the PZ, they bifurcate into upper and lower layers separated by ground substance. Other structures shown include the tectorial membrane, reticular lamina, hair cells, and pillar cells. Panels (c) and (d) present the 'arch-beam model' (ABM), a biomechanical schematic representing the PZ as a shallow circular arch coupled to a flat beam. Mechanical parameters such as point-load (Q), internal pressure (p), and spring stiffness (ka, ks, ko) are defined to simulate the stiffness and deflection profiles of the BM between the primary spiral lamina (PSL) and secondary spiral lamina (SSL).
Anatomy of the Ear and Mechanism of Hearing - 15 Marks
A. PARTS OF THE EAR
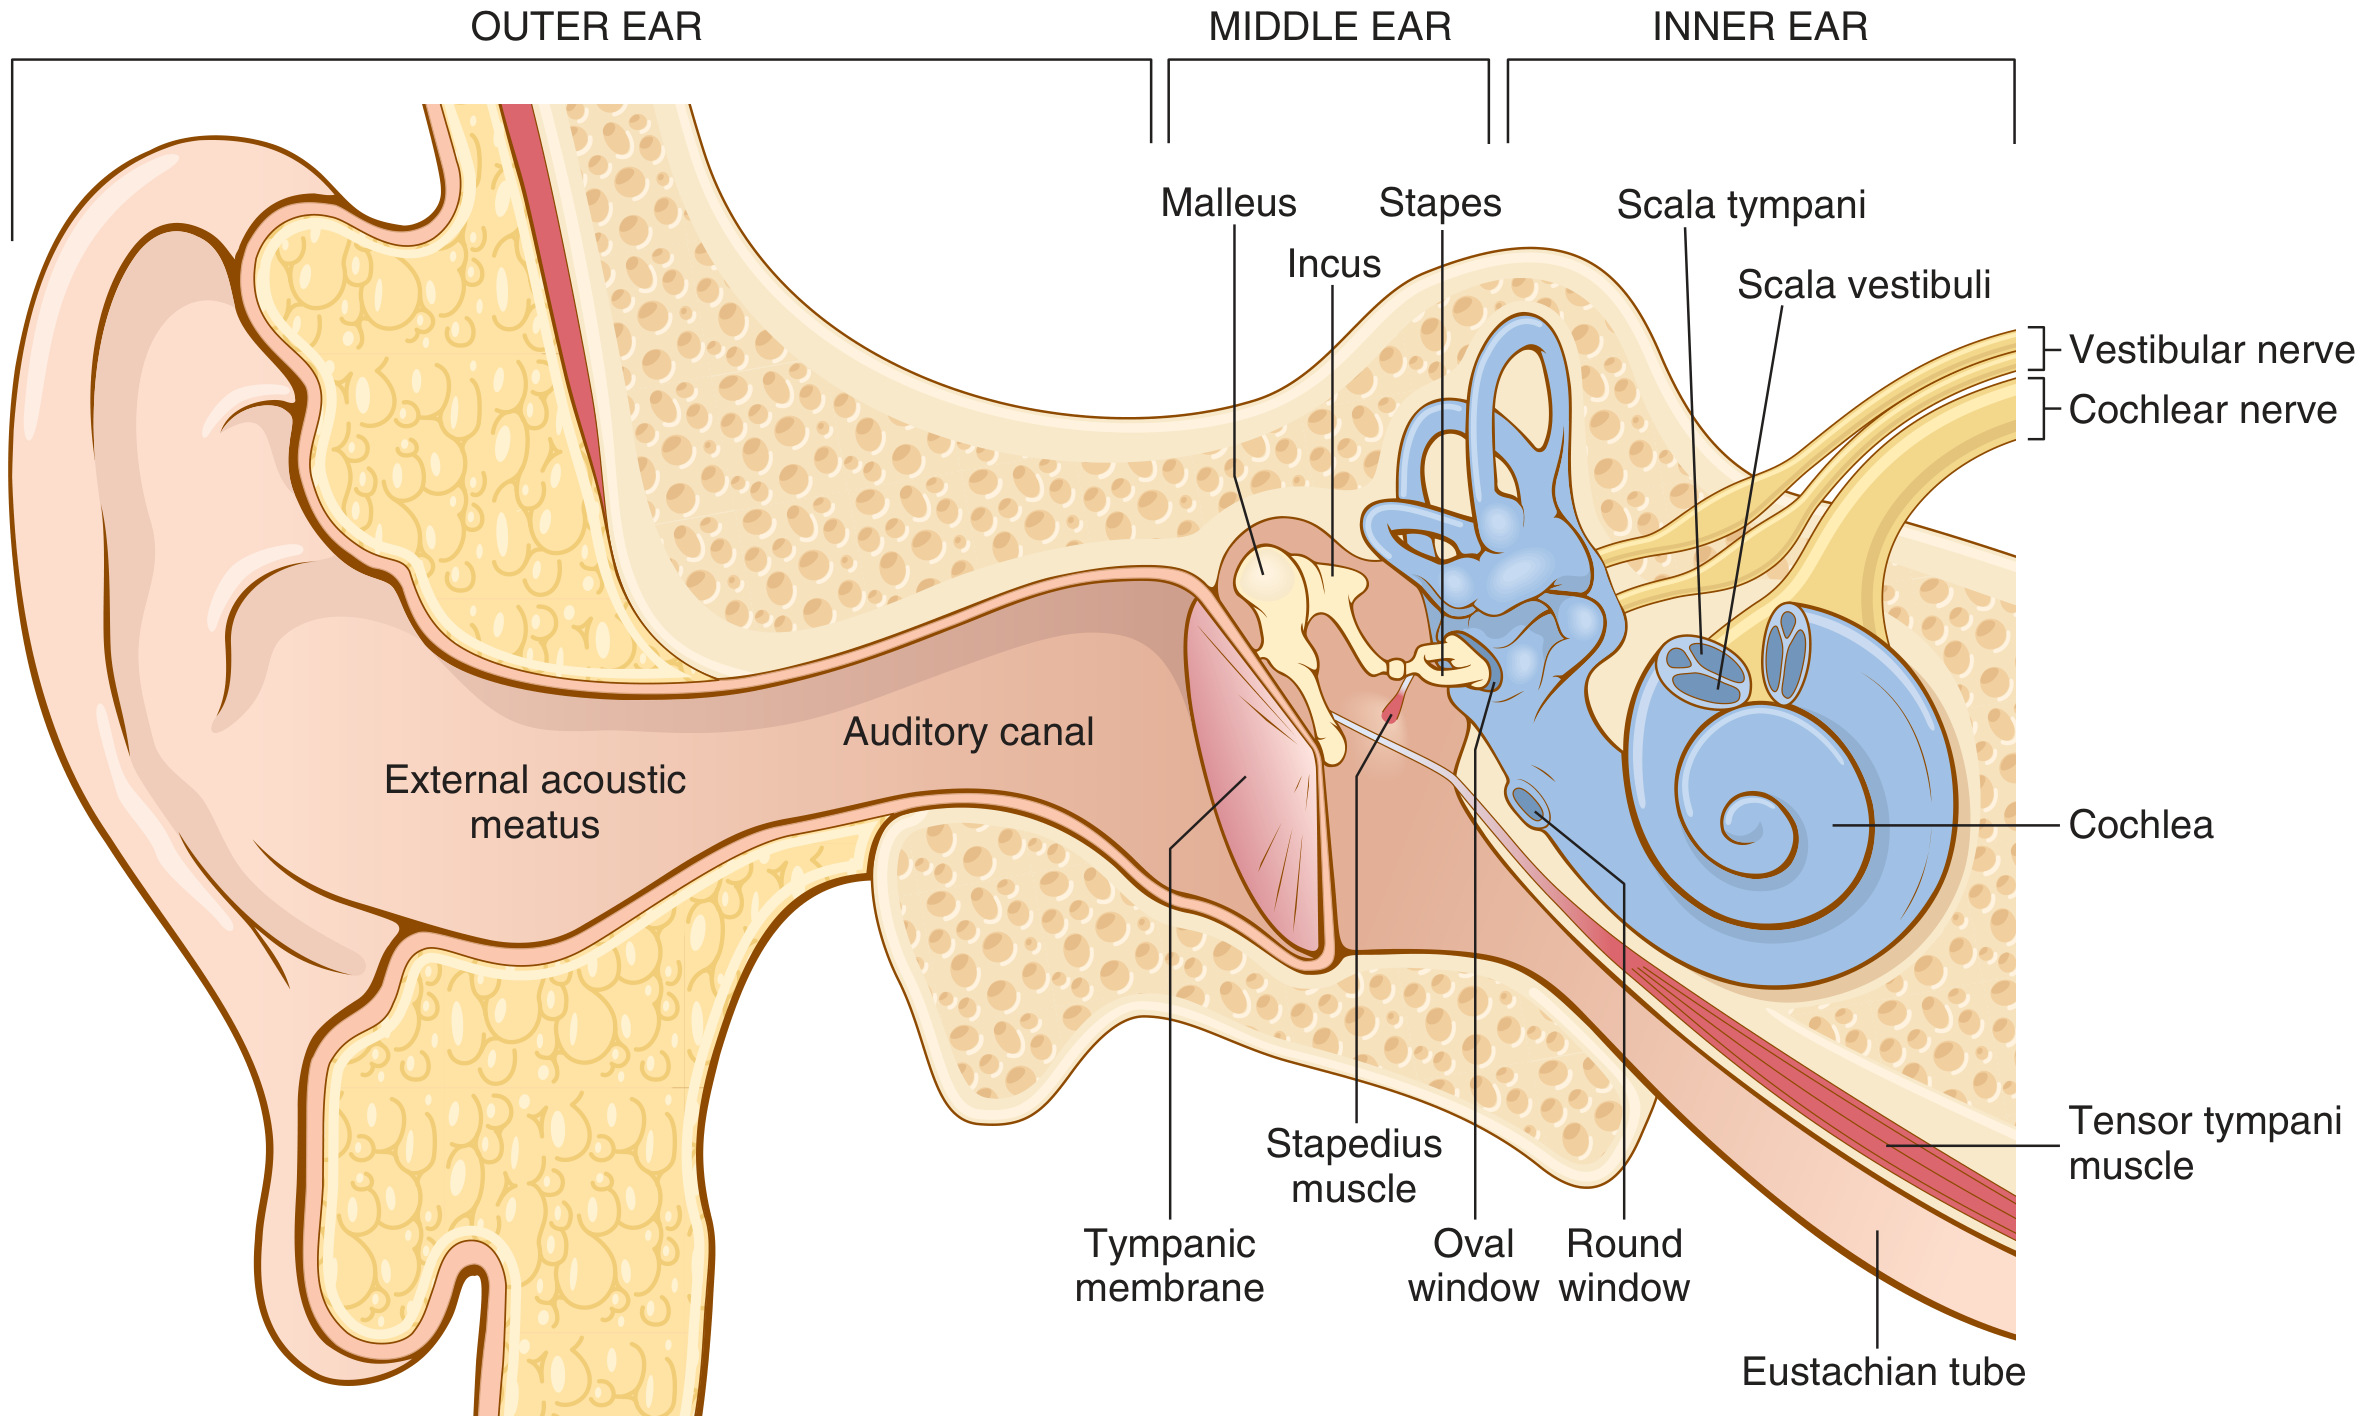
1. External (Outer) Ear
- Pinna (auricle): cartilaginous flap that collects sound waves and funnels them into the canal
- External auditory meatus (canal): conducts sound to the tympanic membrane; outer 1/3 cartilaginous, inner 2/3 bony; lined by skin with ceruminous (wax) glands
- Tympanic membrane (eardrum): thin, cone-shaped membrane separating external from middle ear; vibrates in response to sound pressure waves
2. Middle Ear (Tympanic Cavity)
- Ossicles: malleus (attached to tympanic membrane), incus, and stapes (footplate fits into the oval window) - form a lever chain that transmits vibration from the eardrum to the inner ear fluid
- Muscles: tensor tympani (keeps tympanic membrane taut) and stapedius (dampens excessive ossicular movement - protective reflex)
- Eustachian (auditory) tube: connects middle ear to nasopharynx, equalizes air pressure across the tympanic membrane
- Oval window (receives stapes footplate) and round window (relieves fluid pressure)
3. Internal (Inner) Ear
-
Cochlea - organ of hearing, a coiled tube of 2.5 turns divided into three fluid-filled scalae:
-
Scala vestibuli (perilymph, continuous with oval window)
-
Scala media/cochlear duct (endolymph, contains the organ of Corti)
-
Scala tympani (perilymph, ends at round window)
-
Separated by Reissner's membrane (between scala vestibuli and media) and basilar membrane (between scala media and tympani)
-
Organ of Corti - the actual sensory receptor organ, sitting on the basilar membrane, containing:
-
Inner hair cells (~3,500, single row) - primary sound transducers (90-95% of afferent auditory nerve fibers synapse here)
-
Outer hair cells (~12,000, 3-4 rows) - mainly modulate/"tune" cochlear sensitivity
-
Tectorial membrane overlying the stereocilia of hair cells
-
Supporting (Deiters') cells, rods/pillars of Corti forming the reticular lamina
-
Vestibular apparatus (semicircular canals, utricle, saccule) - balance, not hearing
-
Guyton and Hall Textbook of Medical Physiology, p. 656-659.
B. MECHANISM OF HEARING
1. Conduction of Sound (External and Middle Ear)
- The pinna collects sound waves and channels them through the external auditory meatus to vibrate the tympanic membrane.
- The malleus, incus, and stapes act as a connected lever system: movement of the tympanic membrane moves the malleus, which moves the incus, which moves the stapes footplate against the oval window.
- The lever action of the malleus-incus increases force by about 1.3 times.
- The tympanic membrane's surface area (~55 mm²) is about 17 times larger than the stapes footplate (~3.2 mm²), concentrating the same total force onto a smaller area.
- Combined effect: about 22 times greater force is delivered to the cochlear fluid than would occur from sound striking fluid directly, giving 50-75% efficient impedance matching for frequencies between 300-3000 Hz - Guyton and Hall Textbook of Medical Physiology, p. 656.
- The tensor tympani and stapedius muscles contract reflexively (acoustic reflex) with loud sounds to reduce ossicular movement and protect the inner ear.
2. Cochlear Mechanics - the "Traveling Wave"
- Inward movement of the stapes at the oval window creates a pressure wave in the perilymph of the scala vestibuli.
- This pressure wave displaces the basilar membrane, creating a traveling wave that moves from the base toward the apex of the cochlea.
- The basilar membrane is narrow and stiff at the base (near the oval window) and wide and flexible at the apex - this graded stiffness means:
- High-frequency (high-pitch) sounds cause maximum vibration near the base
- Low-frequency (low-pitch) sounds cause maximum vibration near the apex
- This spatial separation of frequencies along the basilar membrane is called tonotopic organization, and it is the basis of place theory of pitch discrimination - Guyton and Hall Textbook of Medical Physiology, p. 656-658.
- Pressure is finally relieved through the round window, bulging into the middle ear.
3. Transduction by the Organ of Corti (Hair Cell Excitation)
- Vibration of the basilar membrane moves the rigid unit of basilar fibers, rods of Corti, and reticular lamina.
- This shears the stereocilia of the hair cells against the overlying tectorial membrane.
- Bending of stereocilia toward the modiolus (or in the excitatory direction) opens mechanically-gated ion channels, causing depolarization (K+/Ca2+ influx from endolymph, which has a high positive potential); bending in the opposite direction causes hyperpolarization.
- Depolarization of hair cells triggers neurotransmitter (glutamate) release at their base, generating action potentials in the afferent fibers of the cochlear nerve (CN VIII).
- About 90-95% of afferent fibers arise from inner hair cells (primary sound detection), while outer hair cells mostly receive efferent fibers and act as a "cochlear amplifier," fine-tuning sensitivity and frequency selectivity by actively changing their length/stiffness - Guyton and Hall Textbook of Medical Physiology, p. 659.
4. Neural Pathway (Central Processing)
Summary Flow Diagram (for exam)
Thalamus connections and functions and a note on thalamic syndrome
thalamus nuclei diagram connections cortex
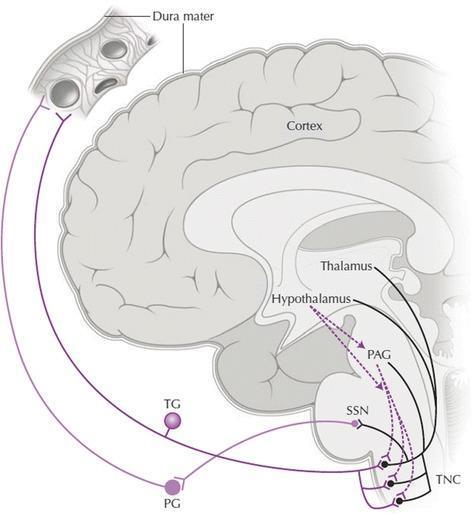
A medical schematic diagram depicting the pathophysiology of the trigeminal-autonomic reflex in a sagittal section of the human brain. The illustration highlights the neural pathways involved in primary headache disorders, such as cluster headaches. Key labeled anatomical structures include the dura mater, cerebral cortex, thalamus, and hypothalamus. Within the brainstem, specific nuclei are identified: the periaqueductal grey (PAG), superior salivatory nucleus (SSN), and trigeminal nucleus caudalis (TNC). Peripheral structures shown include the trigeminal ganglion (TG) and ptyrogopalatine (sphenopalatine) ganglion (PG). Solid purple lines illustrate sensory afferent connections from cranial structures synapsing at the TNC, and its subsequent reflexive connections to the TG and PG. Dashed purple lines represent descending modulatory hypocretinergic projections from the hypothalamus to the PAG and TNC. Black lines indicate the relay of sensory information from the TNC to the thalamus and cortex. This diagram serves as an educational tool for understanding nociceptive processing and autonomic activation in the trigeminal system.
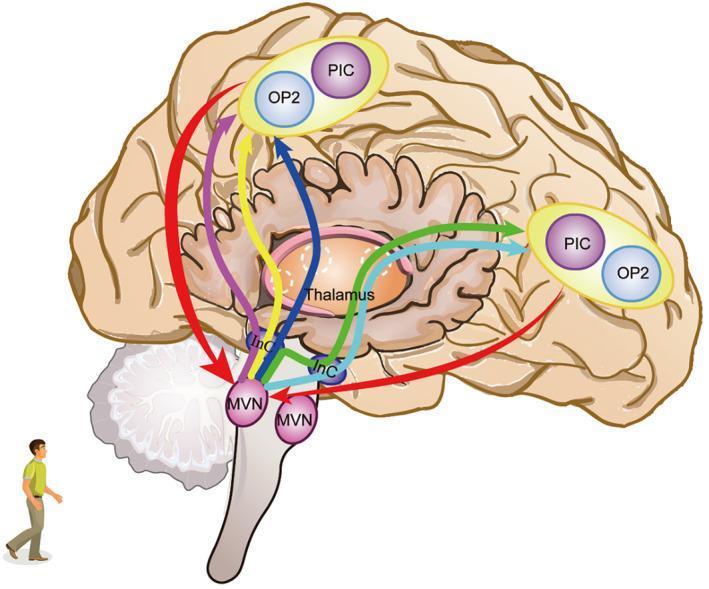
This pathophysiology diagram illustrates the neural pathways of the human vestibular network in a lateral brain view. Key cortical components located in the Sylvian fissure include Parietal Operculum Cortex 2 (OP2) and Posterior Insular Cortex (PIC). Subcortical nodes include the central Thalamus, the Interstitial Nucleus of Cajal (InC), and the Medial Vestibular Nucleus (MVN) in the brainstem. The diagram highlights bidirectional and multi-nodal connections: direct cortical projections from OP2/PIC to the MVN (red arrows) and the InC (yellow arrows); subcortical pathways from the InC to the MVN (purple) and Thalamus (blue); and thalamocortical loops (red and green arrows). The green arrow specifically denotes a contralateral thalamocortical projection, reflecting bilateral integration. This anatomical model demonstrates the integration of balance and orientation signals through direct cortical-vestibular pathways and indirect circuits involving the thalamus and accessory nuclei, relevant for understanding vestibular compensation and postural control.
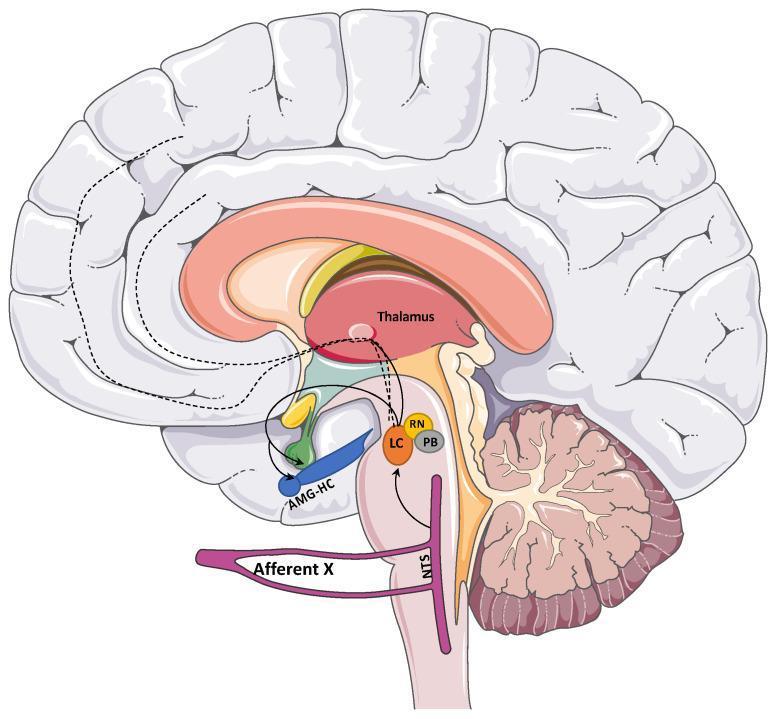
This medical anatomical diagram illustrates the central afferent pathways of the vagus nerve (Cranial Nerve X) within a sagittal section of the human brain. The pathway begins with the 'Afferent X' projecting to the Nucleus Tractus Solitarius (NTS) in the medulla. From the NTS, the diagram maps secondary projections to brainstem nuclei including the Locus Coeruleus (LC), Raphe Nuclei (RN), and Parabrachial Nucleus (PB). Further rostral connections are shown extending to limbic structures, specifically the Amygdala-Hippocampus complex (AMG-HC), and the Thalamus. Dotted lines indicate tertiary projections from the Thalamus and LC toward the cerebral cortex, representing the neuroanatomical basis for Vagus Nerve Stimulation (VNS) effects on cortical excitability and mood regulation. This schematic is designed for educational use in neurology and neurosurgery to demonstrate the integration of visceral sensory information into higher-order brain centers.
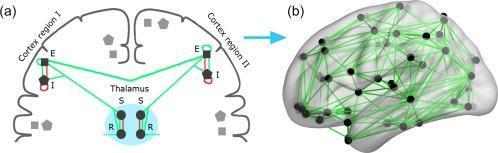
This pathophysiology diagram illustrates a cortico-thalamic mean field model used in neuroscience research to study brain connectivity and dynamics. Panel (a) presents a schematic coronal view of the brain, highlighting two distinct units representing cortex regions I and II and their relationship with the thalamus. Each unit contains four neuronal populations: cortical excitatory (E), cortical inhibitory (I), thalamic relay (S), and thalamic reticular (R). The diagram uses color-coded lines to signify synaptic connections: green lines represent excitatory pathways, while red lines represent inhibitory pathways. Within each region, complex reciprocal loops exist, such as excitatory connections from the thalamic relay (S) to the cortical excitatory (E) populations and inhibitory feedback within the thalamus from the reticular (R) to relay (S) nuclei. Panel (b) translates this model into a global scale, showing a 3D anatomical reconstruction of the human cortex. It depicts a large-scale network where discrete nodes (black dots) are interconnected by a dense web of excitatory (green) white matter tracts. This visual explains how local microcircuit dynamics are integrated into a macroscale empirically informed anatomical network, relevant for understanding conditions like Multiple Sclerosis.
Thalamus - Connections, Functions, and Thalamic Syndrome
A. Overview
B. Major Thalamic Nuclei and Their Connections
| Nuclear group | Afferent input | Efferent projection (cortex) | Function |
|---|---|---|---|
| Anterior nucleus | Mammillary bodies (mammillothalamic tract), hippocampus | Cingulate gyrus | Papez circuit - memory, emotion |
| Ventral posterolateral (VPL) | Medial lemniscus, spinothalamic tract (body) | Postcentral gyrus (somatosensory cortex) | Touch, pressure, proprioception, pain, temperature from trunk/limbs |
| Ventral posteromedial (VPM) | Trigeminal and gustatory pathways | Postcentral gyrus (face area) | Facial sensation, taste |
| Ventral anterior (VA) and Ventral lateral (VL) | Globus pallidus, cerebellum, substantia nigra | Precentral gyrus (motor cortex), premotor cortex | Relay of basal ganglia and cerebellar output for motor control |
| Lateral geniculate body (LGB) | Optic tract | Visual cortex (occipital, area 17) | Vision |
| Medial geniculate body (MGB) | Inferior colliculus (auditory pathway) | Auditory cortex (superior temporal gyrus) | Hearing |
| Dorsomedial (medial) nucleus | Amygdala, hypothalamus, prefrontal association areas | Prefrontal cortex | Emotion, personality, autonomic integration |
| Pulvinar and lateral posterior nucleus | Other thalamic nuclei, association cortices | Parietal, temporal, occipital association cortex | Integration of sensory information, language |
| Intralaminar and midline nuclei (e.g., centromedian) | Reticular formation, spinothalamic tract | Diffuse projections to cortex and striatum | Arousal, consciousness (ascending reticular activating system relay) |
| Reticular nucleus | Collaterals from thalamocortical/corticothalamic fibers | No cortical projection (projects back to other thalamic nuclei) | Gates and regulates thalamocortical traffic |
C. Functions of the Thalamus
- Sensory relay station - relays and processes all somatosensory (touch, pain, temperature, proprioception via VPL/VPM), visual (LGB), and auditory (MGB) information en route to the cortex. Even after destruction of the somatosensory cortex, the thalamus retains a crude ability to perceive pain and temperature, showing it is not merely a passive relay but has an independent discriminative role, especially for pain and temperature sensation - Guyton and Hall Textbook of Medical Physiology, p. 606.
- Motor relay - relays basal ganglia (globus pallidus) and cerebellar output to the motor and premotor cortex (VA/VL nuclei), essential for planning and coordination of movement.
- Integration and association - the pulvinar and association nuclei integrate multimodal sensory information for higher cognitive processing (language, visuospatial function).
- Consciousness and arousal - intralaminar and reticular nuclei are part of the ascending reticular activating system, maintaining wakefulness and attention; the reticular nucleus gates thalamocortical transmission.
- Emotion and memory - anterior and dorsomedial nuclei connect the limbic system (mammillary bodies, hippocampus, amygdala) with the cingulate and prefrontal cortex, contributing to memory (Papez circuit) and emotional/behavioural regulation.
- Pain perception - crude, poorly localized pain and temperature sensation is appreciated at thalamic level itself (hence the marked pain seen with thalamic lesions).
- Coordination between cortical areas - via diffuse and specific thalamocortical projections, synchronizing activity across different cortical regions (thalamocortical oscillations relevant to sleep and consciousness).
D. Note on Thalamic Syndrome (Dejerine-Roussy Syndrome)
- Contralateral hemianesthesia - dense loss of all sensory modalities on the side of the body opposite the lesion; may be dissociated, i.e., pain/temperature and touch/vibration can be affected separately depending on which fiber tracts are involved
- Thalamic pain (central post-stroke pain) - severe, disagreeable, often burning or lancinating spontaneous pain, or pain evoked by minor stimuli (allodynia/hyperpathia), typically appearing weeks to months after the acute sensory loss resolves; classically resistant to standard analgesics
- Astereognosis and loss of proprioception due to involvement of deep sensory pathways
- Distorted taste sensation may occur
- A transient hemiparesis can occur if the lesion extends to affect adjacent internal capsule fibers
- Mild choreoathetoid movements or thalamic hand posturing may be seen in some cases (not always present)
- Bradley and Daroff's Neurology in Clinical Practice, p. 352.