Explain me 10 common heart disease with ECG changes and ECG diagram of these diseases
Reading File
Finding Sources
Finding Sources
Reading File
Reading File
Finding Sources
Reading File
Finding Sources
Finding Sources
Reading File
Finding Sources
Reading File
Finding Sources
Reading File
Reading File
Loading Image
Loading Image
Loading Image
Loading Image
Loading Image
Loading Image
Finding Sources
Finding Sources
Reading File
Searching the Web
ECG changes 10 common heart diseases atrial fibrillation hypertrophic cardiomyopathy pulmonary embolism WPW diagram
Loading Image
Finding Sources
Reading File
Loading Image
Loading Image
Loading Image
Here is a comprehensive breakdown of 10 common heart diseases with their ECG changes and textbook diagrams.
10 Common Heart Diseases: ECG Changes & Diagrams
1. Acute Myocardial Infarction (STEMI)
Mechanism: Transmural ischemia causes current of injury due to three simultaneous changes in infarcted cells: rapid repolarization, decreased resting membrane potential (K+ loss), and delayed depolarization - all driving ST elevation in overlying leads.
ECG Changes:
- Hyperacute phase (minutes): Tall, peaked "hyperacute" T waves
- Acute phase (hours): ST elevation (>1 mm) in leads overlying the infarct; reciprocal ST depression in opposite leads
- Evolving phase (hours-days): Q waves develop (>40 ms wide, >25% of R wave); T-wave inversions appear
- Chronic phase: Persistent Q waves; ST may normalize
- Localisation: Anterior MI (V1-V4), Inferior MI (II, III, aVF), Lateral MI (I, aVL, V5-V6)
Anterior STEMI - ECG sequence (Acute → Evolving):
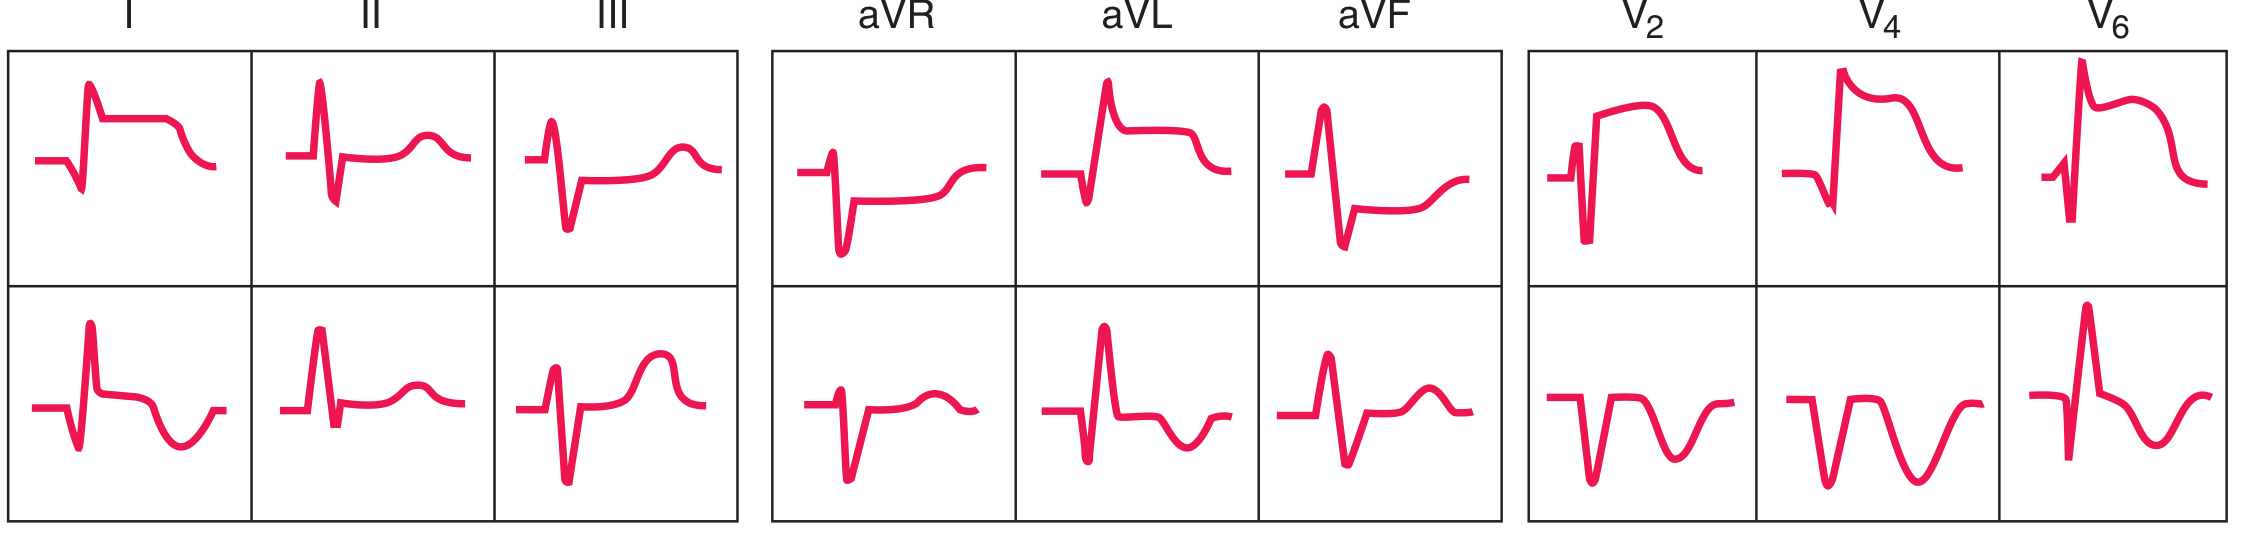 FIGURE: Anterior MI - acute (top row) shows ST elevation in I, aVL, V2-V6 with reciprocal depression in II, III, aVF. Evolving (bottom row) shows development of Q waves and T-wave inversions.
Inferior STEMI - ECG sequence:
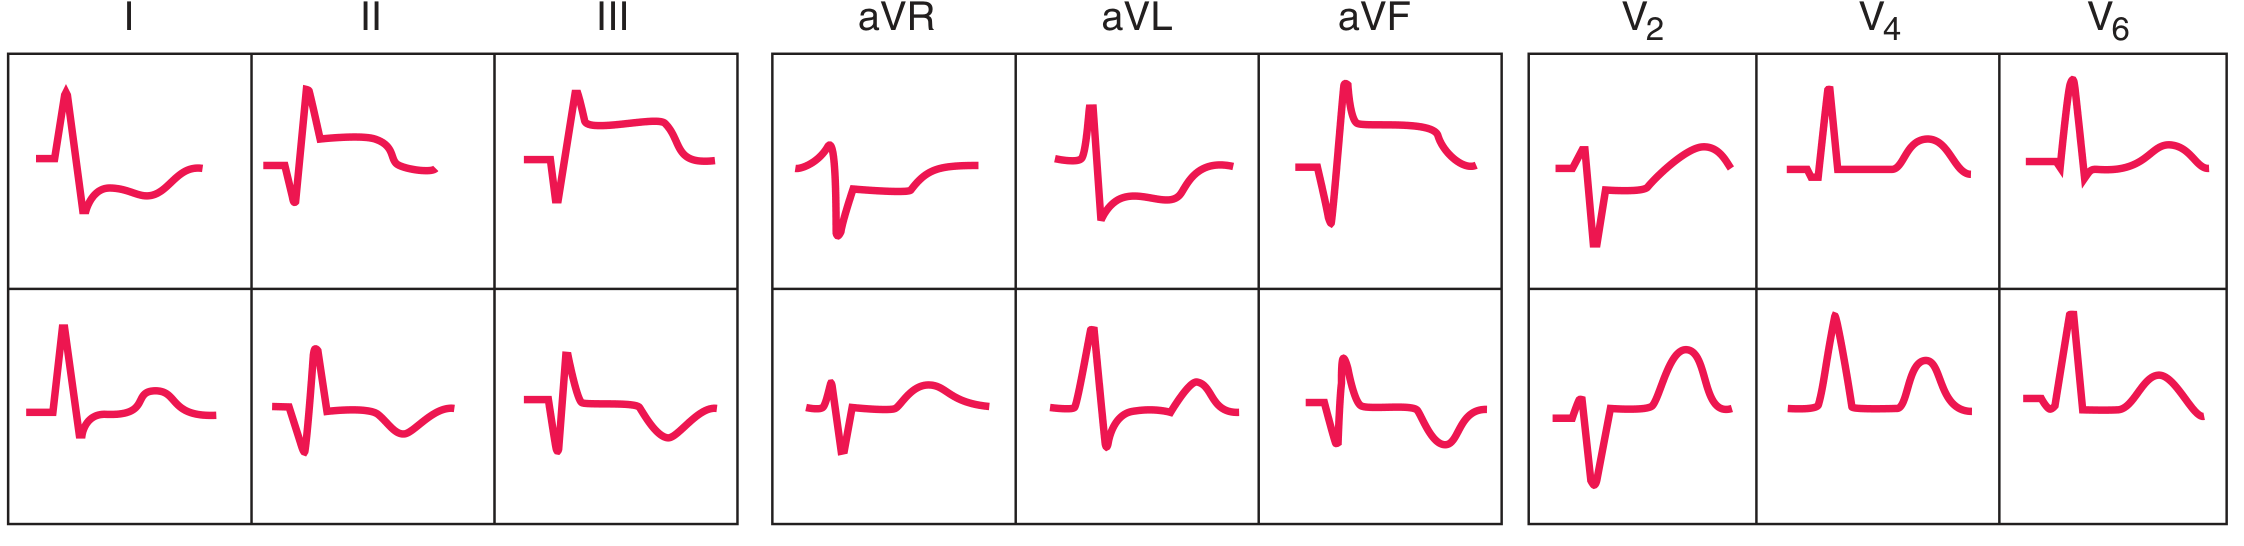 FIGURE: Inferior MI - ST elevation in II, III, aVF with reciprocal ST depressions in I, aVL, and anterior leads.
Ischemia current of injury diagram:
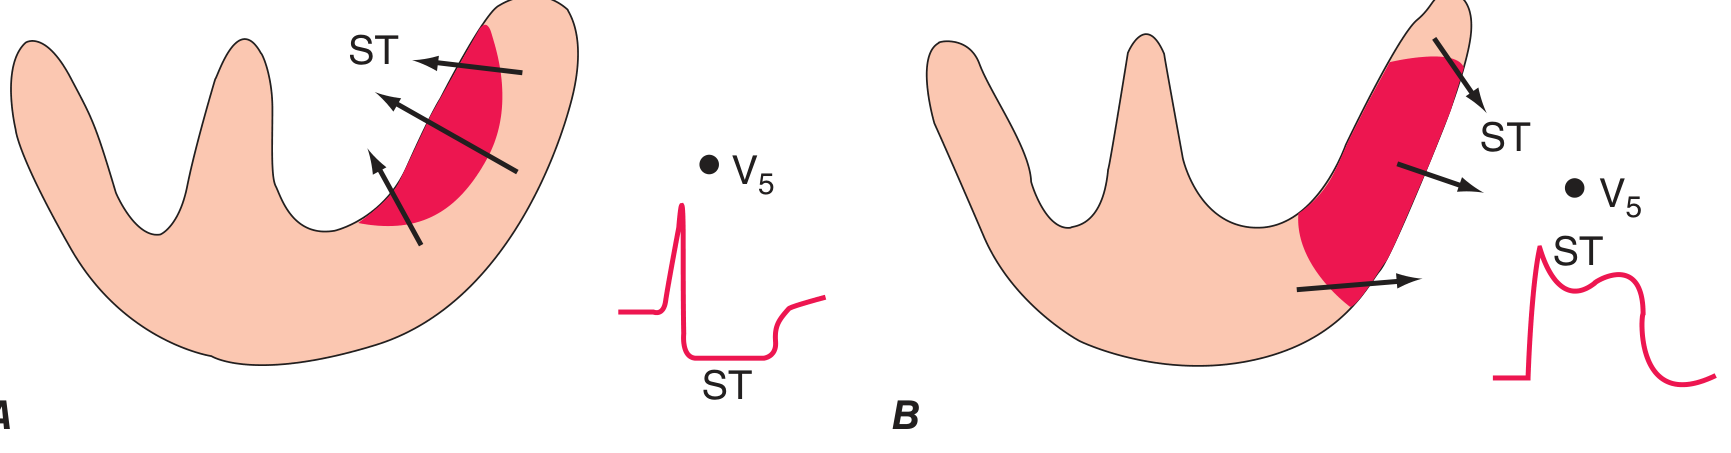 FIGURE: A = subendocardial ischemia → ST depression; B = transmural/epicardial ischemia → ST elevation.
Source: Harrison's Principles of Internal Medicine 22E and Ganong's Review of Medical Physiology
2. NSTEMI / Unstable Angina (Subendocardial Ischemia)
Mechanism: Partial thickness ischemia - ST vector directed inward toward ventricular cavity.
ECG Changes:
- ST depression (≥0.5-1 mm) in leads over the affected territory
- T-wave inversions (particularly deep T-wave inversions in V1-V4 = "Wellens' sign" - high-grade LAD stenosis)
- No Q waves (non-Q-wave infarct)
- Normal ECG does not exclude NSTEMI - diagnosis depends on elevated troponin
Wellens' T-wave pattern (anterior ischemia):
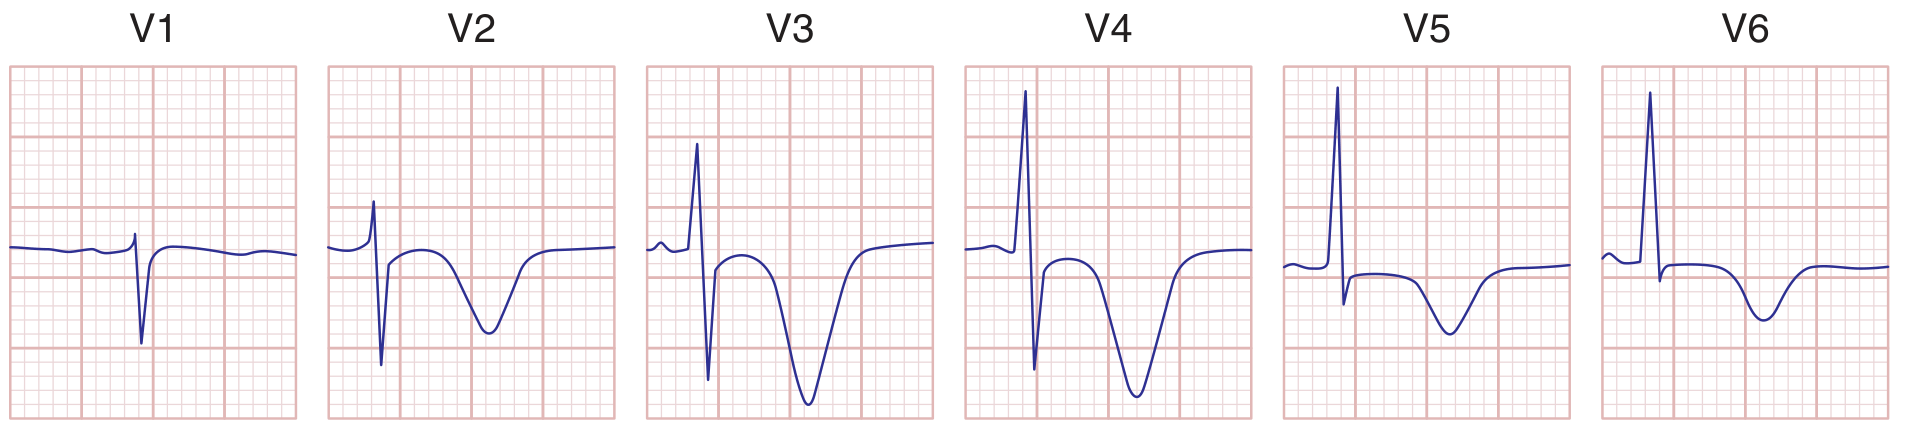 FIGURE: Severe anterior wall ischemia - prominent T-wave inversions in V1-V6 (Wellens sign), associated with high-grade LAD stenosis.
Source: Harrison's Principles of Internal Medicine 22E
3. Acute Pericarditis
Mechanism: Diffuse subepicardial inflammation causes widespread ST elevation; atrial inflammation depresses PR segment.
ECG Changes (4 Stages):
- Stage 1 (hours): Diffuse concave ("saddle-shaped") ST elevation in ALL leads except aVR and V1; PR depression in most leads; PR elevation in aVR ("knuckle sign") - non-territory-specific (distinguishes from MI)
- Stage 2 (days): ST and PR segments normalize
- Stage 3 (days-weeks): Diffuse T-wave inversions
- Stage 4 (weeks-months): ECG returns to normal
Key distinctions from MI: Pericarditis ST elevation is concave and diffuse (not localized to a coronary territory); Q waves do NOT form; PR depression is present; no reciprocal ST depression (except aVR).
Pericarditis 12-lead ECG (Stage 1):
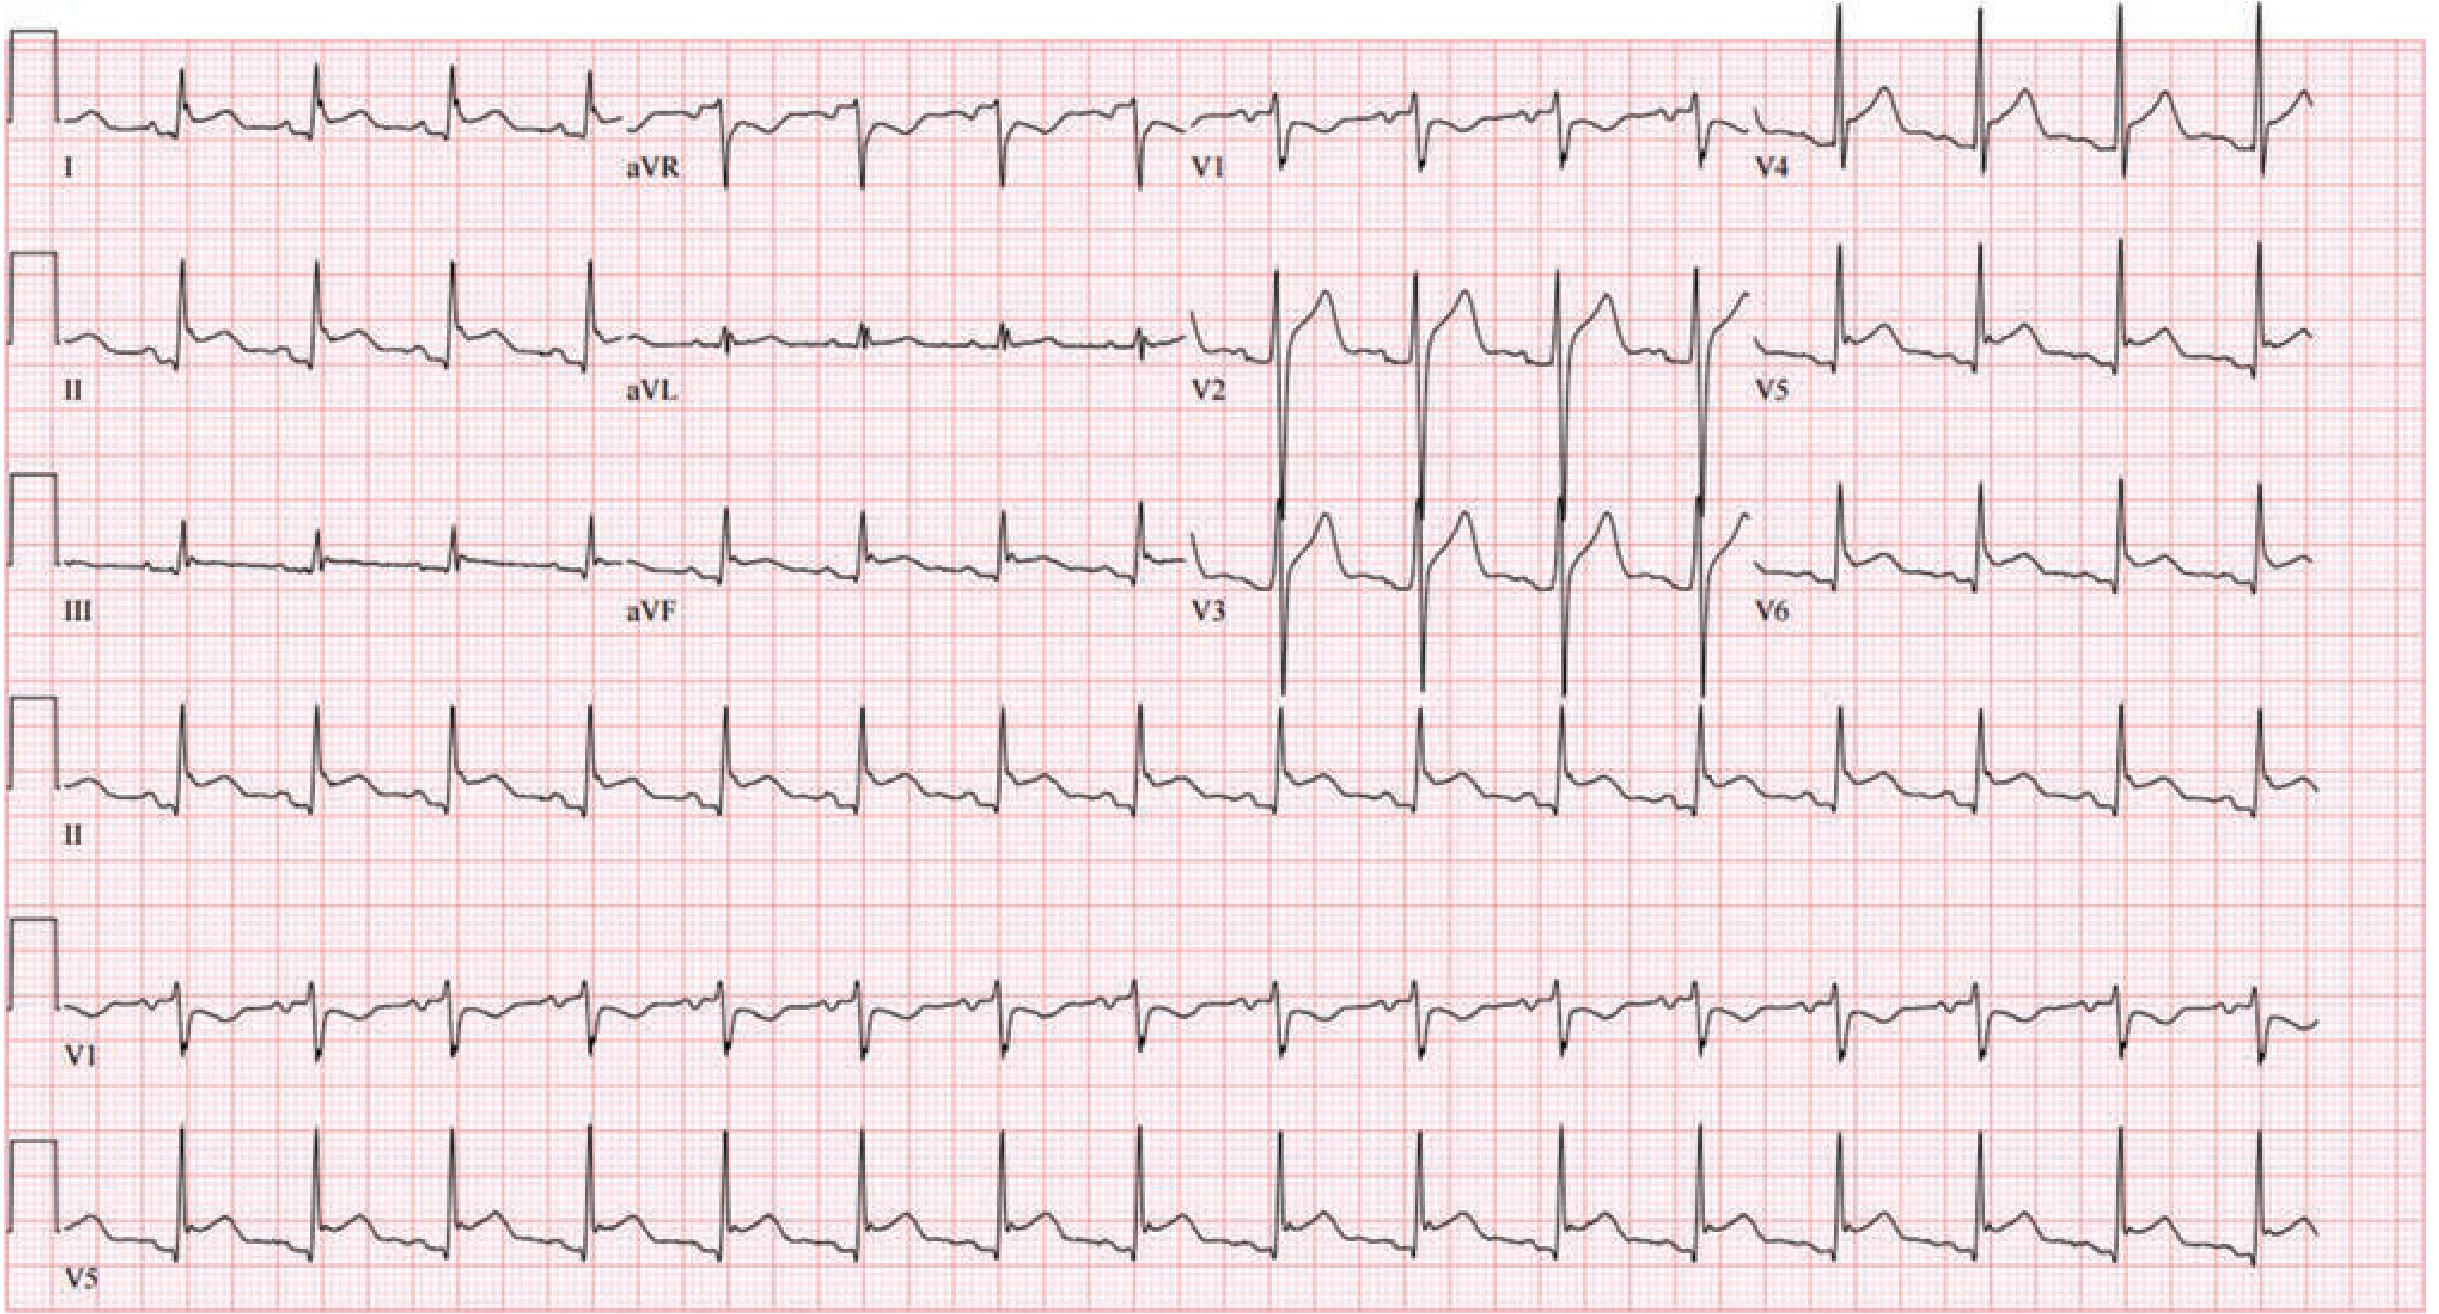 FIGURE: Stage I pericarditis - diffuse ST elevation (non-territory specific) with PR depression in most leads; aVR shows ST depression with PR elevation.
Source: Fuster and Hurst's The Heart, 15th Edition
4. Bundle Branch Block (RBBB & LBBB)
Mechanism: Block in right or left bundle branch causes delayed ventricular depolarization; QRS ≥120 ms. T waves are discordant (opposite to terminal QRS deflection) due to altered repolarization sequence.
Right Bundle Branch Block (RBBB) - ECG Changes:
- QRS ≥ 120 ms
- rSR' pattern ("rabbit ears") in V1 - tall terminal R'
- Wide, slurred S wave in I and V6
- T-wave inversion in V1-V2 (secondary repolarization change)
- Causes: Atrial septal defect, PE, ischemic/valvular disease
Left Bundle Branch Block (LBBB) - ECG Changes:
- QRS ≥ 120 ms
- Broad, monophasic R wave in V5-V6 (no q wave)
- Deep QS complex in V1
- T-wave inversion in lateral leads (V5-V6, I, aVL) - discordant
- Causes: Coronary artery disease, hypertension, cardiomyopathy, aortic valve disease
- Clinical note: New LBBB with chest pain = treat as STEMI equivalent (Sgarbossa criteria)
RBBB vs LBBB - Pattern comparison:
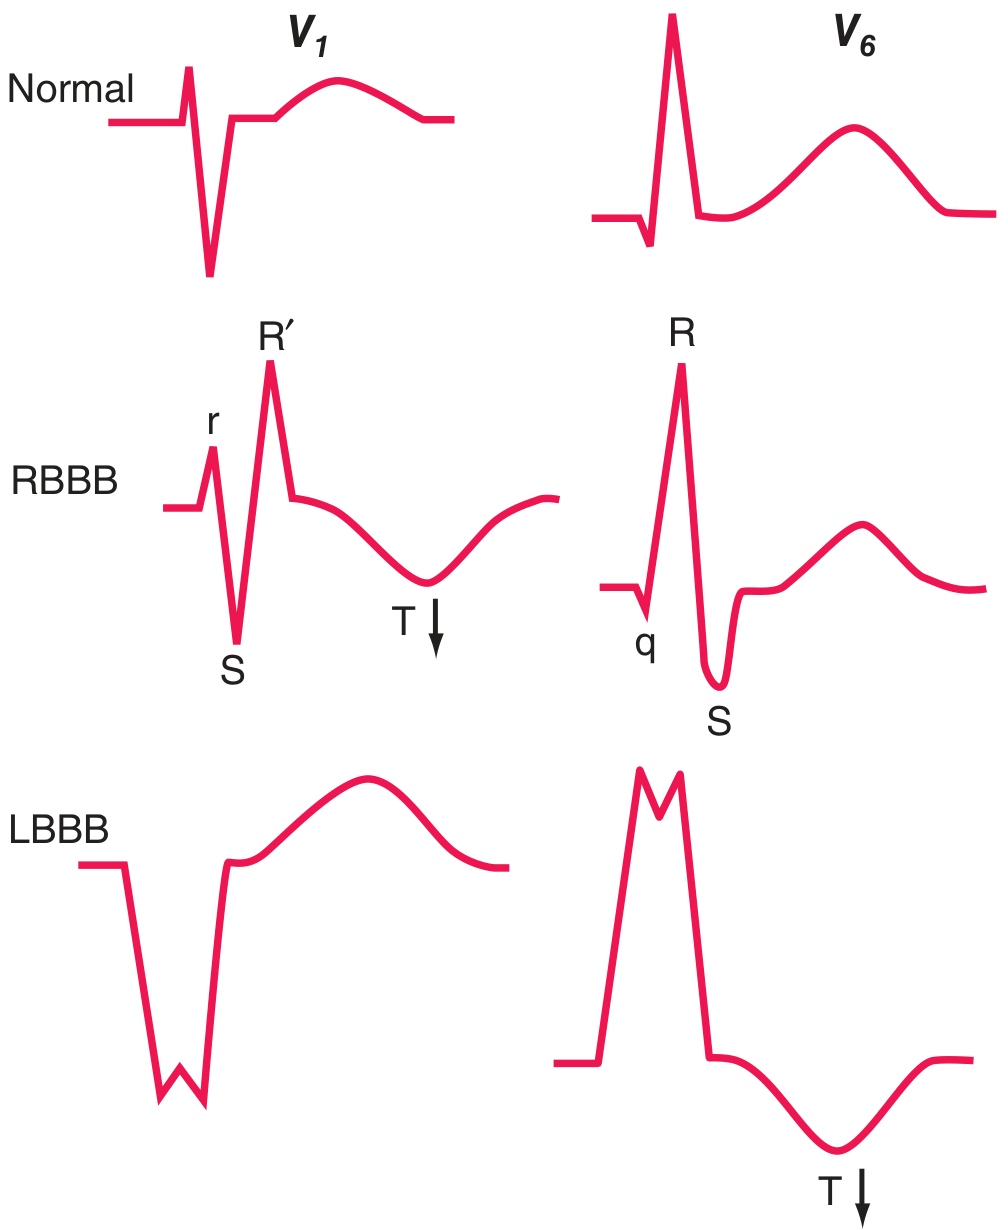 FIGURE: Normal (top), RBBB (middle) showing rSR' in V1 and qRS in V6, LBBB (bottom) showing broad QS in V1 and monophasic R in V6, with discordant T-waves (arrows).
Source: Harrison's Principles of Internal Medicine 22E
5. Complete (Third-Degree) AV Block
Mechanism: Complete dissociation between atria and ventricles - no atrial impulses conduct to the ventricles. A subsidiary escape pacemaker (junctional at 40-60 bpm, or ventricular at 20-40 bpm) maintains ventricular rhythm.
ECG Changes:
- P waves and QRS complexes are completely independent (AV dissociation)
- P wave rate is faster than QRS rate
- PR interval is totally variable (P waves "march through" QRS)
- Narrow QRS if junctional escape; broad/wide QRS if ventricular escape
- Bradycardia (ventricular rate 20-60 bpm)
Second-degree AV block - Type I (Wenckebach) and Type II:
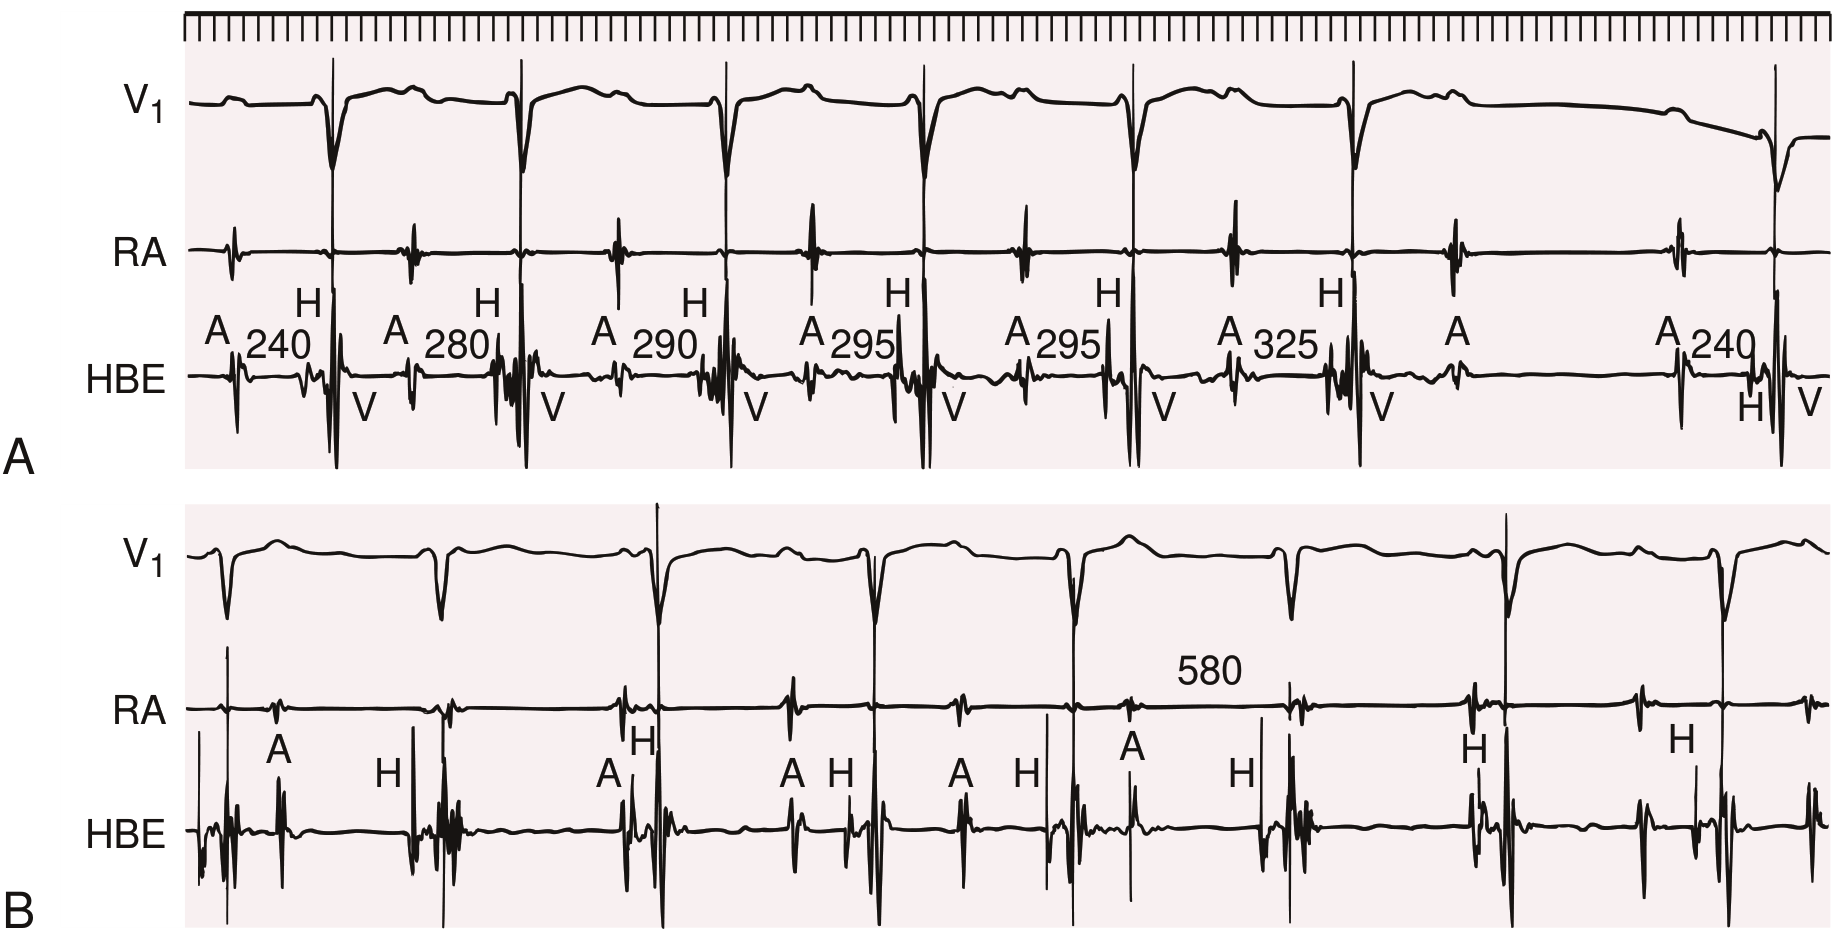 FIGURE: Panel A = Type I (Wenckebach) - progressive PR prolongation until P wave is dropped; Panel B = Type II - constant PR interval with sudden non-conducted P wave.

Source: Braunwald's Heart Disease, 2 Vol Set
6. Atrial Fibrillation (AF)
Mechanism: Multiple chaotic re-entrant wavelets in the atria produce disorganized atrial activity at 350-600 impulses/min; AV node filters most, producing an irregularly irregular ventricular response.
ECG Changes:
- Absent P waves - replaced by fibrillatory (f) baseline (fine or coarse irregular undulations at 350-600/min)
- Irregularly irregular RR intervals (hallmark finding)
- Narrow QRS (unless aberrant conduction or BBB)
- Heart rate typically 100-160 bpm if uncontrolled
- No organized atrial activity visible
Key ECG distinction:
- AF vs Atrial Flutter: Flutter has organized "sawtooth" flutter waves at ~300/min, usually with regular 2:1 or 4:1 block
- AF vs Multifocal Atrial Tachycardia (MAT): MAT has 3+ distinct P wave morphologies
Source: Braunwald's Heart Disease; Rosen's Emergency Medicine
7. Hypertrophic Cardiomyopathy (HCM)
Mechanism: Asymmetric septal hypertrophy causes increased LV mass, abnormal septal depolarization, and altered repolarization. More than 95% of patients have abnormal ECG findings.
ECG Changes:
- Increased QRS voltage (LVH criteria: S in V1 + R in V5/V6 ≥35 mm; or R in aVL ≥11 mm)
- Narrow septal Q waves in lateral leads (V5, V6, I, aVL) - due to exaggerated septal depolarization
- T-wave inversions in lateral leads (V4-V6)
- Left axis deviation
- Atrial fibrillation or atrial flutter (common complication)
- Apical HCM variant: Giant (>10 mm) T-wave inversions in precordial leads (V3-V5) - "Yamaguchi pattern"
HCM ECG - LVH voltage and septal Q waves:
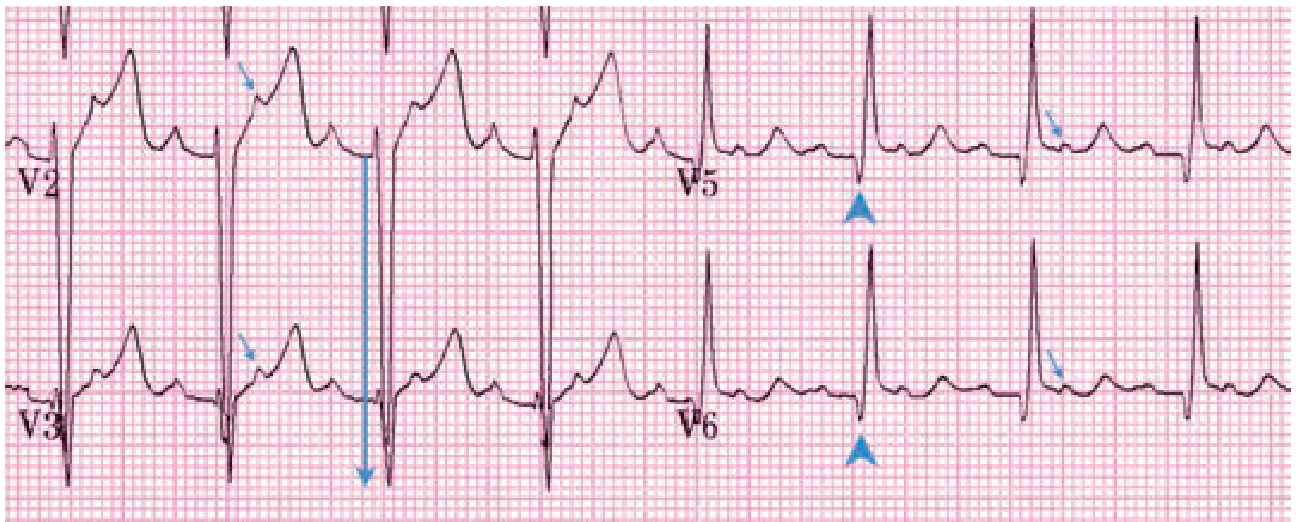 FIGURE: HCM ECG - deep S-wave voltage (28 mm S in V3, large arrow) = LVH; narrow septal Q waves in V5-V6 (arrowheads) are characteristic. Concurrent atrial flutter with 2:1 block (additional P waves in ST segments, small arrows).
Source: Tintinalli's Emergency Medicine; Goldman-Cecil Medicine
8. Pulmonary Embolism (PE)
Mechanism: Acute RV pressure overload and dilation from massive pulmonary arterial obstruction causes right heart strain pattern on ECG.
ECG Changes:
- S1Q3T3 pattern (classic but only seen in ~20% of cases): Deep S wave in lead I, Q wave in lead III, T-wave inversion in lead III
- Sinus tachycardia (most common finding)
- Right bundle branch block (new RBBB suggests severe RV strain and adverse outcome)
- Right axis deviation
- T-wave inversions in right precordial leads (V1-V4) - RV strain
- P pulmonale (tall peaked P waves in II) - right atrial enlargement
- S1S2S3 pattern (S waves in I, II, III)
- Atrial fibrillation/flutter
- Note: Normal ECG in PE does not exclude the diagnosis; ECG changes reflect RV strain severity
Source: Goldman-Cecil Medicine; Fuster and Hurst's The Heart
9. Ventricular Tachycardia (VT) and Ventricular Fibrillation (VF)
Mechanism: Reentry, triggered activity, or enhanced automaticity in the ventricles produces wide-complex tachycardia. VF is grossly disorganized ventricular electrical activity with no cardiac output.
Ventricular Tachycardia - ECG Changes:
- Monomorphic VT: Regular wide-complex tachycardia (QRS ≥120 ms), rate 100-250 bpm; constant QRS morphology beat to beat; AV dissociation (P waves unrelated to QRS); fusion beats and capture beats (pathognomonic)
- Polymorphic VT / Torsades de Pointes: Beat-to-beat changes in QRS morphology and axis; twisting of QRS around isoelectric line (torsades); associated with prolonged QT interval (congenital or drug-induced)
- Ventricular Fibrillation: Low-amplitude, chaotic continuous electrical activity with no recognizable QRS complexes; rate >300/min; no cardiac output
VF with PVC trigger ECG:
 FIGURE: ECG showing recurrent closely coupled PVCs in idiopathic VF, with PVC initiating VF (progressive deterioration into chaotic electrical activity visible on right).
Source: Goldman-Cecil Medicine International Edition
10. Wolff-Parkinson-White Syndrome (WPW) / Pre-excitation Syndrome
Mechanism: An accessory bypass tract (Bundle of Kent) conducts impulses from atria to ventricles faster than the AV node, causing early ("pre-") excitation of part of the ventricle before the normal AV node impulse arrives. The resulting QRS is a "fusion" of pre-excited (abnormal, slow) and normally conducted (fast) depolarization.
ECG Changes (during sinus rhythm):
- Short PR interval (<120 ms) - bypass tract bypasses AV node delay
- Delta wave - slurred initial upstroke of the QRS (slow conduction through accessory pathway)
- Wide QRS (>120 ms) - due to fusion of pre-excitation and normal conduction
- Pseudo ST-T changes - secondary to abnormal depolarization
During tachycardia (AVRT):
- Orthodromic AVRT (most common, ~80%): Narrow-complex tachycardia at 150-250 bpm (down AV node, up accessory tract) - delta wave disappears during tachycardia
- Antidromic AVRT: Broad-complex tachycardia (down accessory tract, up AV node) - maximally pre-excited, widened QRS
- AF with WPW (dangerous): Irregular very rapid broad-complex rhythm (>250-300 bpm) - can degenerate to VF; never give AV-nodal blocking drugs (adenosine, verapamil, digoxin)
Source: Harrison's Principles of Internal Medicine 22E; Braunwald's Heart Disease
Summary Table
| # | Disease | Key ECG Feature | Rate | Rhythm |
|---|---|---|---|---|
| 1 | Anterior STEMI | ST elevation V1-V4, Q waves | Variable | Regular |
| 2 | NSTEMI/Unstable Angina | ST depression, T-wave inversions, Wellens sign | Variable | Regular |
| 3 | Acute Pericarditis | Diffuse concave ST elevation + PR depression | Normal | Regular |
| 4 | RBBB/LBBB | Wide QRS (≥120 ms), rSR' or QS | Normal | Regular |
| 5 | Complete AV Block | P/QRS dissociation, broad escape QRS | <60 bpm | Regular (slow) |
| 6 | Atrial Fibrillation | No P waves, irregularly irregular | 100-160 | Irregular |
| 7 | Hypertrophic Cardiomyopathy | LVH voltage, narrow Q waves laterally, T inversions | Normal | Regular |
| 8 | Pulmonary Embolism | S1Q3T3, sinus tachycardia, RBBB, RV strain | >100 | Regular |
| 9 | Ventricular Tachycardia | Wide QRS tachycardia, AV dissociation | 100-250 | Regular/Irregular |
| 10 | WPW / Pre-excitation | Short PR, delta wave, wide QRS | Variable | Variable |
Sources:
- Harrison's Principles of Internal Medicine 22E (McGraw Hill, 2025)
- Braunwald's Heart Disease, 2 Vol Set - A Textbook of Cardiovascular Medicine
- Fuster and Hurst's The Heart, 15th Edition
- Goldman-Cecil Medicine International Edition
- Ganong's Review of Medical Physiology, 26th Edition
- Tintinalli's Emergency Medicine - A Comprehensive Study
This is a shared conversation. Sign in to Orris to start your own chat.