
Acculturation mbbs from park
Reading File
Acculturation is a social science/sociology concept covered in Park's Textbook of Preventive and Social Medicine. Let me search the library for it.
Searching sources...
Finding Sources
Finding Sources
Found the dedicated "ACCULTURATION" section in Park's. Let me read it along with the surrounding sociology concepts section.
Reading File
Now let me read the actual ACCULTURATION section specifically:
Reading File
I now have the complete content from Park's. Let me also quickly get the CULTURE section just before it, as acculturation is explained in that context too:
Reading File
I now have all the content needed. Here is the complete answer based directly from Park's Textbook of Preventive and Social Medicine.
Acculturation - Park's Textbook of Preventive and Social Medicine
Definition
Acculturation means "culture contact."
When there is contact between two people with different types of culture, there is diffusion of culture both ways.
- Park's Textbook of Preventive and Social Medicine, p. 769
Ways by Which Culture Contact (Acculturation) Takes Place
Park lists 5 ways:
- Trade and commerce
- Industrialization
- Propagation of religion
- Education
- Conquest
Examples Given in Park's
| Example | Explanation |
|---|---|
| British influence on India | Through conquest - "An Indian is said to be the next best Englishman" |
| Introduction of scientific medicine | Came into India through culture contact |
| Changes in food habits | Many orthodox Brahmins in India today eat meat - due to culture contact |
| Widespread use of tobacco worldwide | A result of culture contact |
| Radio, television, cinema | Important factors in shaping cultural-behaviour patterns of people |
Context: Culture vs. Acculturation
To understand acculturation, Park first defines culture:
"Culture is defined as learned behaviour which has been socially acquired."
Culture is transmitted from one generation to another through learning processes (formal and informal). It lays down norms of behaviour and provides mechanisms that secure personal and social survival.
Acculturation is the process by which one culture adopts elements from another when the two come into contact - it operates both ways (bidirectional diffusion).
Distinction from Socialization
| Term | Definition |
|---|---|
| Socialization | Process by which an individual gradually acquires culture and becomes a member of a social group (e.g., children going to school; doctor's internship training) |
| Acculturation | Culture contact between two different cultures, leading to diffusion of cultural elements in both directions |
Health Relevance (Park's Emphasis)
Cultural factors are deeply involved in:
- Personal hygiene
- Nutrition
- Immunization
- Seeking early medical care
- Family planning
- Child rearing
- Disposal of refuse and excreta
- Outlook on health and disease
Acculturation has both good and bad aspects - for example, the introduction of scientific medicine (good) and the widespread use of tobacco (bad) are both products of culture contact.
Source: Park's Textbook of Preventive and Social Medicine, Chapter on Concepts in Sociology, p. 769 (Section: ACCULTURATION, under CULTURE sub-heading)
/Define epidemiology. Classify different types of epidemiological studies. Briefly describe the steps and method of analysis while you want to ascertain the role of contraceptive pills for causation of deep vein thrombosis among females.
Finding Sources
Finding Sources
Finding Sources
Finding Sources
Finding Sources
Finding Sources
Finding Sources
Excellent - found all the key sections. Let me read them all in parallel.
Reading File
Reading File
Reading File
Good content found. Now let me read the case control study details, cohort study, and experimental epidemiology sections:
Reading File
Reading File
Now let me read the cohort study section and the classification/types of epidemiological studies:
Reading File
Reading File
Excellent - I now have all the key content. Let me also get the cohort study steps and the odds ratio/relative risk analysis part, and also the steps for a case-control study on DVT + OCP which is the classic example:
Reading File
I now have all the content needed for a comprehensive answer. Let me compile the full response.
Epidemiology - Definition, Classification of Studies & DVT/OCP Example
(Source: Park's Textbook of Preventive and Social Medicine)
PART 1: Definition of Epidemiology
Various definitions have been given over time:
| Author | Year | Definition |
|---|---|---|
| Parkin | 1873 | That branch of medical science which treats epidemics |
| Frost | 1927 | The science of mass phenomena of infectious diseases |
| Greenwood | 1934 | The study of disease, any disease, as a mass phenomenon |
| MacMahon | 1960 | The study of the distribution and determinants of disease frequency in man |
Standard Definition (Park's):
"The study of the occurrence and distribution of health-related events, states, and processes in specified populations, including the study of the determinants influencing such processes, and the application of this knowledge to control relevant health problems."
Three components common to most definitions:
- Disease frequency - measurement via rates and ratios (incidence, prevalence, death rate)
- Distribution - by time, place, and person
- Determinants - geophysical, biological, behavioural, social, cultural, economic, and political factors that influence health
PART 2: Classification of Epidemiological Studies
EPIDEMIOLOGICAL STUDIES
├── 1. OBSERVATIONAL STUDIES
│   ├── A. Descriptive Studies
│   └── B. Analytical Studies
│       ├── (i)  Ecological / Correlational — population as unit of study
│       ├── (ii) Cross-sectional / Prevalence — individual as unit of study
│       ├── (iii) Case-Control / Case-reference — individual as unit of study
│       └── (iv) Cohort / Follow-up — individual as unit of study
│
└── 2. EXPERIMENTAL STUDIES (Intervention Studies)
    ├── a. Randomized Controlled Trials / Clinical Trials — patients as unit
    ├── b. Field Trials — healthy people as unit of study
    └── c. Community Trials / Community Intervention Studies — community as unit
Brief Description of Each Type:
| Type | Direction | Unit | Key Feature |
|---|---|---|---|
| Descriptive | -- | Population | Describes disease by time, place, person; generates hypothesis |
| Cross-sectional | Snapshot | Individual | Prevalence; exposure and outcome measured simultaneously |
| Case-Control | Backwards (retrospective) | Individual | Compares past exposure in cases vs. controls; tests hypothesis |
| Cohort | Forwards (prospective) | Individual | Follows exposed and unexposed; measures incidence |
| RCT / Clinical Trial | Prospective | Patients | Investigator controls exposure; most rigorous design |
| Field Trial | Prospective | Healthy persons | Vaccine trials in disease-free individuals |
| Community Trial | Prospective | Communities | Intervention at community level |
"These studies cannot be regarded as watertight compartments; they complement one another." - Park
PART 3: Ascertaining the Role of Contraceptive Pills in Causation of DVT
The best study design for this is a Case-Control Study (since DVT is a relatively rare outcome and OCP use is a suspected past exposure). A cohort study is also valid but more time-consuming. Below are the steps and analysis:
Step 1: Formulate the Hypothesis
"Oral contraceptive pills (OCPs) are a risk factor for the causation of deep vein thrombosis (DVT) in females."
This hypothesis is derived from prior descriptive or clinical observations suggesting DVT is more common among OCP users.
Step 2: Define Cases and Controls
- Cases: Females diagnosed with DVT (confirmed by Doppler ultrasound / venography), admitted in hospitals or identified from registries
- Controls: Females of similar age, sex (matched), without DVT - drawn from:
- Hospital patients (non-DVT conditions)
- Neighbourhood controls
- General population (random sample)
- Controls must be matched for age, parity, socioeconomic status (known confounders)
Step 3: Selection Criteria
- Clearly define a "case" - what constitutes DVT (clinical + radiological criteria)
- Clearly define an "exposed person" - what constitutes OCP use (type, duration, dosage)
- Exclusion criteria: females with hereditary thrombophilia, immobility, malignancy (alternate causes of DVT)
Step 4: Data Collection (Exposure Assessment)
Assess past history of OCP use in both cases and controls using:
- Structured interview / questionnaire
- Medical records
- Information on: duration of use, type of pill, dose of estrogen
Enter data into the 2×2 contingency table:
| DVT (Cases) | No DVT (Controls) | |
|---|---|---|
| OCP used (Exposed) | a | b |
| OCP not used (Not exposed) | c | d |
| Total | a + c | b + d |
Step 5: Matching
Match controls with cases for confounding variables such as:
- Age
- Parity
- Smoking status
- Obesity
- Family history of clotting disorders
Step 6: Analysis
(a) Test of Statistical Association
Calculate the frequency of OCP use in cases vs. controls:
- Exposure rate in cases = a / (a+c)
- Exposure rate in controls = b / (b+d)
If OCP use is higher among cases than controls, a statistical association exists.
Apply Chi-square test (for discrete variables like exposed/not exposed):
- If P ≤ 0.05 → statistically significant
- The smaller the P value, the greater the statistical significance
"Statistical association does not imply causation. Statement of P value is thus an inadequate, although common end-point." - Park
(b) Estimation of Risk - Odds Ratio (OR)
Since this is a case-control study, Relative Risk cannot be calculated directly (no denominator/population at risk). Instead, the Odds Ratio (OR) is used:
Odds Ratio (OR) = ad / bc
Interpretation:
- OR = 1 → No association
- OR > 1 → Positive association (OCP use increases DVT risk)
- OR < 1 → Negative association (protective)
OR is a valid approximation of Relative Risk when the disease is rare (disease rarity assumption).
Step 7: Establishing Causation
Statistical association alone is not causation. Apply Bradford Hill's Criteria to assess causality:
- Strength of association - High OR
- Consistency - Repeated in different studies/populations
- Specificity - OCP use linked specifically to DVT
- Temporality - OCP use preceded DVT (exposure before disease)
- Biological gradient - Higher dose/duration of OCP → higher DVT risk
- Plausibility - Estrogen in OCPs increases clotting factors (biologically plausible)
- Coherence - Consistent with lab/animal data
- Experiment - Withdrawal of OCP reduces DVT incidence
- Analogy - Similar associations known for other estrogen-related conditions
Summary Table: Case-Control Study for OCP-DVT
| Step | Action |
|---|---|
| 1 | Formulate hypothesis |
| 2 | Define cases (DVT females) and controls (non-DVT females) |
| 3 | Select comparable, matched controls |
| 4 | Collect data on past OCP use (2x2 table) |
| 5 | Match for confounders (age, smoking, etc.) |
| 6a | Chi-square test - test for statistical association |
| 6b | Odds Ratio (OR = ad/bc) - estimate strength of association |
| 7 | Apply Bradford Hill's criteria for causation |
Source: Park's Textbook of Preventive and Social Medicine - Chapter on Epidemiology (Epidemiologic Methods, Case-Control Study, Analytical Epidemiology), pp. 65-85
Sentinel surveillance
Finding Sources
Finding Sources
Found the main section in Park's block1 and additional content in block6. Let me read them in parallel.
Reading File
Reading File
Reading File
Let me also read the HIV sentinel surveillance features and dengue sentinel surveillance section:
Reading File
Reading File
I now have comprehensive content from Park's on sentinel surveillance. Here is the complete answer:
Sentinel Surveillance
(Source: Park's Textbook of Preventive and Social Medicine)
Definition
"No routine notification system can identify all cases of infection or disease. A method for identifying the missing cases and thereby supplementing the notified cases is required. This is known as 'sentinel surveillance.'"
The sentinel data is extrapolated to the entire population to estimate the disease prevalence in the total population.
- Park's Textbook of Preventive and Social Medicine, p. (Epidemiological Surveillance chapter)
Why is it Needed?
Conventional/routine notification systems have inherent limitations:
- Under-reporting due to passive nature
- Reporting biases (many cases go undetected or unreported)
- Lack of detailed clinical or laboratory data
Sentinel surveillance supplements the routine notification system by actively identifying missing cases through a selected network of reporting sites.
Key Features
| Feature | Details |
|---|---|
| Who reports | Interested and competent physicians or institutions in selected areas |
| What they report | All cases of a specific disease in their area |
| Data quality | More detailed and valuable than traditional notification |
| Extrapolation | Data from sentinel sites is extrapolated to estimate total population prevalence |
| Feedback | Feed-back of information to providers is simplified |
| Reporting bias | Minimized compared to routine notification |
Advantages
- Reporting biases are minimized
- Feed-back of information to providers is simplified
- Provides more valuable and detailed information than traditional notification systems
- Can be developed into a full notification system for more detailed information
- Less costly than maintaining an ongoing notification system in some settings
- Identifies missing/under-reported cases
Examples of Sentinel Surveillance in Park's
1. Malaria Sentinel Surveillance
A weakness of existing malaria surveillance is the lack of articulation with hospitals, meaning:
- Severe malaria cases are not reported separately
- Only a small fraction of malaria deaths are recorded
Solution: Sentinel surveillance established in high endemic districts by selecting:
- 1-3 sentinel sites in large hospitals per district (depending on size)
- Recording all OPD and IPD cases of malaria
- Recording malaria-related deaths
Parameters monitored:
- Annual Parasite Incidence (API)
- Annual Blood Examination Rate (ABER)
- Annual Falciparum Incidence (AFI)
- Slide Positivity Rate (SPR)
- Slide Falciparum Rate (SFR)
2. HIV Sentinel Surveillance (India)
After establishing that HIV infection was widespread geographically, surveillance was redefined to monitor trends of HIV infection.
Objectives:
- Determine the level of HIV infection among general population and high-risk groups in different states
- Understand trends of HIV epidemic
- Understand geographical spread and identify emerging pockets
- Provide information for prioritization of programme resources and evaluation of programme impact
- Estimate HIV prevalence and burden in the country
Key features of HIV sentinel surveillance:
- Annual cross-sectional survey of risk groups, at the same place over a few years
- Unlinked anonymous serological testing (ERS - testing without name identification)
- Pregnant women attending antenatal clinics (ANC) are taken as a proxy for general population
- Inclusion of data from high-risk populations through targeted intervention sites
- Started in 1994 with 55 sentinel sites, expanded to 180 by 1998
HIV Sentinel Surveillance Sites (2016-2017):
| Site Type | Number of Sites |
|---|---|
| ANC (Antenatal Clinics) | 829 |
| IDU (Injecting Drug Users) | 87 |
| MSM (Men who have Sex with Men) | 89 |
| FSW (Female Sex Workers) | 245 |
| Migrants | 27 |
| TG (Transgender) | 18 |
| Truckers | 28 |
| Total | 1,323 |
3. Dengue / Acute Encephalitis Syndrome (AES/JE)
- Government of India identified 521 sentinel surveillance hospitals with laboratory support for augmented diagnostic facilities in endemic states
- 14 Apex Referral Laboratories identified for advanced diagnosis and backup support
- In sentinel surveillance network, AES/JE diagnosed by IgM Capture ELISA; virus isolation done at National reference laboratories
4. Integrated Disease Surveillance Programme (IDSP) - Sentinel Surveillance Component
Under IDSP, sentinel surveillance is used for:
- Sexually transmitted diseases / blood-borne: HIV, HBV, HCV
- Other conditions: Water quality monitoring, outdoor air quality monitoring (large urban centres)
Sentinel Surveillance vs. Routine Notification - Comparison
| Feature | Routine Notification | Sentinel Surveillance |
|---|---|---|
| Coverage | All health facilities (passive) | Selected sites (active) |
| Reporting | All practitioners (mandatory) | Selected competent physicians |
| Completeness | Under-reporting common | Better case capture |
| Data quality | Variable | High quality, detailed |
| Feedback | Limited | Simplified and regular |
| Cost | Low (existing system) | Moderate, but cost-effective |
| Purpose | General disease reporting | Supplement + estimate prevalence |
Source: Park's Textbook of Preventive and Social Medicine - Sections on Epidemiological Surveillance, Malaria, HIV/AIDS, and IDSP
Emerging and re emerging disease
Finding Sources
Finding Sources
Reading File
Reading File
Good content. Now let me read the re-emerging diseases section and the full list of examples from Park's:
Reading File
Let me read the re-emerging diseases section and the section just before what I already read:
Reading File
I now have comprehensive content. Also let me fetch the global map image from Sherris:
Loading Image
I now have all the content needed. Here is the complete, well-structured answer:
Emerging and Re-Emerging Infectious Diseases
(Source: Park's Textbook of Preventive and Social Medicine + Sherris & Ryan's Medical Microbiology)
Definition
Emerging Infectious Diseases
"Emerging infectious diseases are those whose incidence in humans has increased during the last two decades or which threaten to increase in the near future."
The term also refers to:
- Newly appearing infectious diseases (e.g., COVID-19, AIDS, Ebola)
- Diseases spreading to new geographical areas (e.g., cholera in South America, yellow fever in Kenya)
During the past 30 years, at least 30 new diseases have emerged to threaten the health of hundreds of millions of people. For many of these diseases, there is no treatment, cure or vaccine.
Re-Emerging Infectious Diseases
These are diseases that were previously controlled or declining, but are resurfacing - often in epidemic form - usually due to:
- Development of antimicrobial resistance
- Breakdown in public health measures
- Relaxation of immunization practices
Factors Responsible for Emergence and Re-emergence
Park lists 8 major factors:
| # | Factor | Example |
|---|---|---|
| 1 | Unplanned and under-planned urbanization | Overcrowded slums with poor sanitation |
| 2 | Overcrowding and rapid population growth | Facilitates person-to-person spread |
| 3 | Poor sanitation | Waterborne/foodborne disease emergence |
| 4 | Inadequate public health infrastructure | Failure to detect and respond early |
| 5 | Resistance to antibiotics | Drug-resistant TB, MRSA, cholera O139 |
| 6 | Increased exposure to disease vectors and animal reservoirs | Hantavirus from deer mice, Ebola from primates |
| 7 | Rapid and intense international travel | HIV spread worldwide; COVID-19 pandemic |
| 8 | Microbial genetic mutation | New influenza strains, COVID-19 variants |
Additional contributing factors:
- Changes in lifestyle and behaviour (drug use, increased sexual partners) - syphilis, HIV
- Practices of modern medicine - viral hepatitis spread via dialysis, blood transfusions
- Relaxation of immunization - diphtheria resurgence in former USSR
- New animal diseases and foodborne risks - BSE (mad cow disease) → variant CJD
- Drug treatments that do not result in cure - promote drug-resistant strains
Mode of Transmission
Emerging diseases involve all major modes of transmission:
- Person-to-person spread
- Insect vectors (mosquitoes, ticks)
- Animal reservoirs (zoonoses)
- Contaminated water or food
Important Examples
A. Newly Emerging Diseases
1. COVID-19 (SARS-CoV-2)
- Most dramatic modern example
- First case: November 2019; declared pandemic by WHO: March 11, 2020
- Caused virtual global lockdown; social distancing and masking as primary control measures
- ~110 million cases with 2.45 million deaths by February 2021
2. HIV/AIDS
- Virus unknown until 1983
- ~38 million people living with HIV globally (2019)
- 1.2 million new cases with 690,000 deaths in 2019
- Spread accelerated by international travel, sexual behaviour changes
3. Ebola Virus Disease
- Member of family Filoviridae; 5 distinct species (Zaire, Reston, Sudan, Tai, Bundibugyo)
- First appeared in Zaire and Sudan in 1976
- Recent epidemic started December 2013 in Guinea; 25,515 cases, >10,000 deaths by April 2015
- Case fatality rate up to 70%
- Incubation period: 2-21 days (not infective during this period)
- Transmission: direct contact with blood/body fluids of infected animals (chimpanzees, gorillas, fruit bats) or symptomatic humans
- NOT transmitted via air, water, or food
- No specific treatment; no vaccine available
4. Hantavirus Pulmonary Syndrome
- Characterized by respiratory failure; CFR >50%
- First recognized in USA in 1993; spread to >20 states
- Carrier: rodents (deer mice)
- Other hantaviruses in Asia cause haemorrhagic fever with renal involvement
5. New E. coli Strains (O157:H7)
- First reported in 1982
- Causes serious diarrhoeal illness, sometimes leading to kidney failure
- Linked to undercooked hamburger beef and unpasteurized milk
6. Cholera O139
- Completely new strain appeared in south-eastern India in 1992
- Spread to China, Thailand, and SE Asia
B. Re-Emerging Diseases
| Disease | Reason for Re-emergence |
|---|---|
| Tuberculosis | Drug resistance (MDR/XDR-TB); HIV co-infection |
| Diphtheria | Relaxation of immunization (resurgence in former USSR) |
| Cholera | Spread to new geographical areas |
| Syphilis | Changes in sexual behaviour; increased sexual partners |
| Malaria | Drug resistance (chloroquine resistance) |
| Dengue | Urbanization, vector spread to new areas |
| Measles | Vaccine hesitancy, inadequate immunization coverage |
| Plague | Re-emergence in rodent reservoirs |
Global Distribution
The figure below (Sherris & Ryan's Medical Microbiology) shows the global examples of emerging and re-emerging infectious diseases:
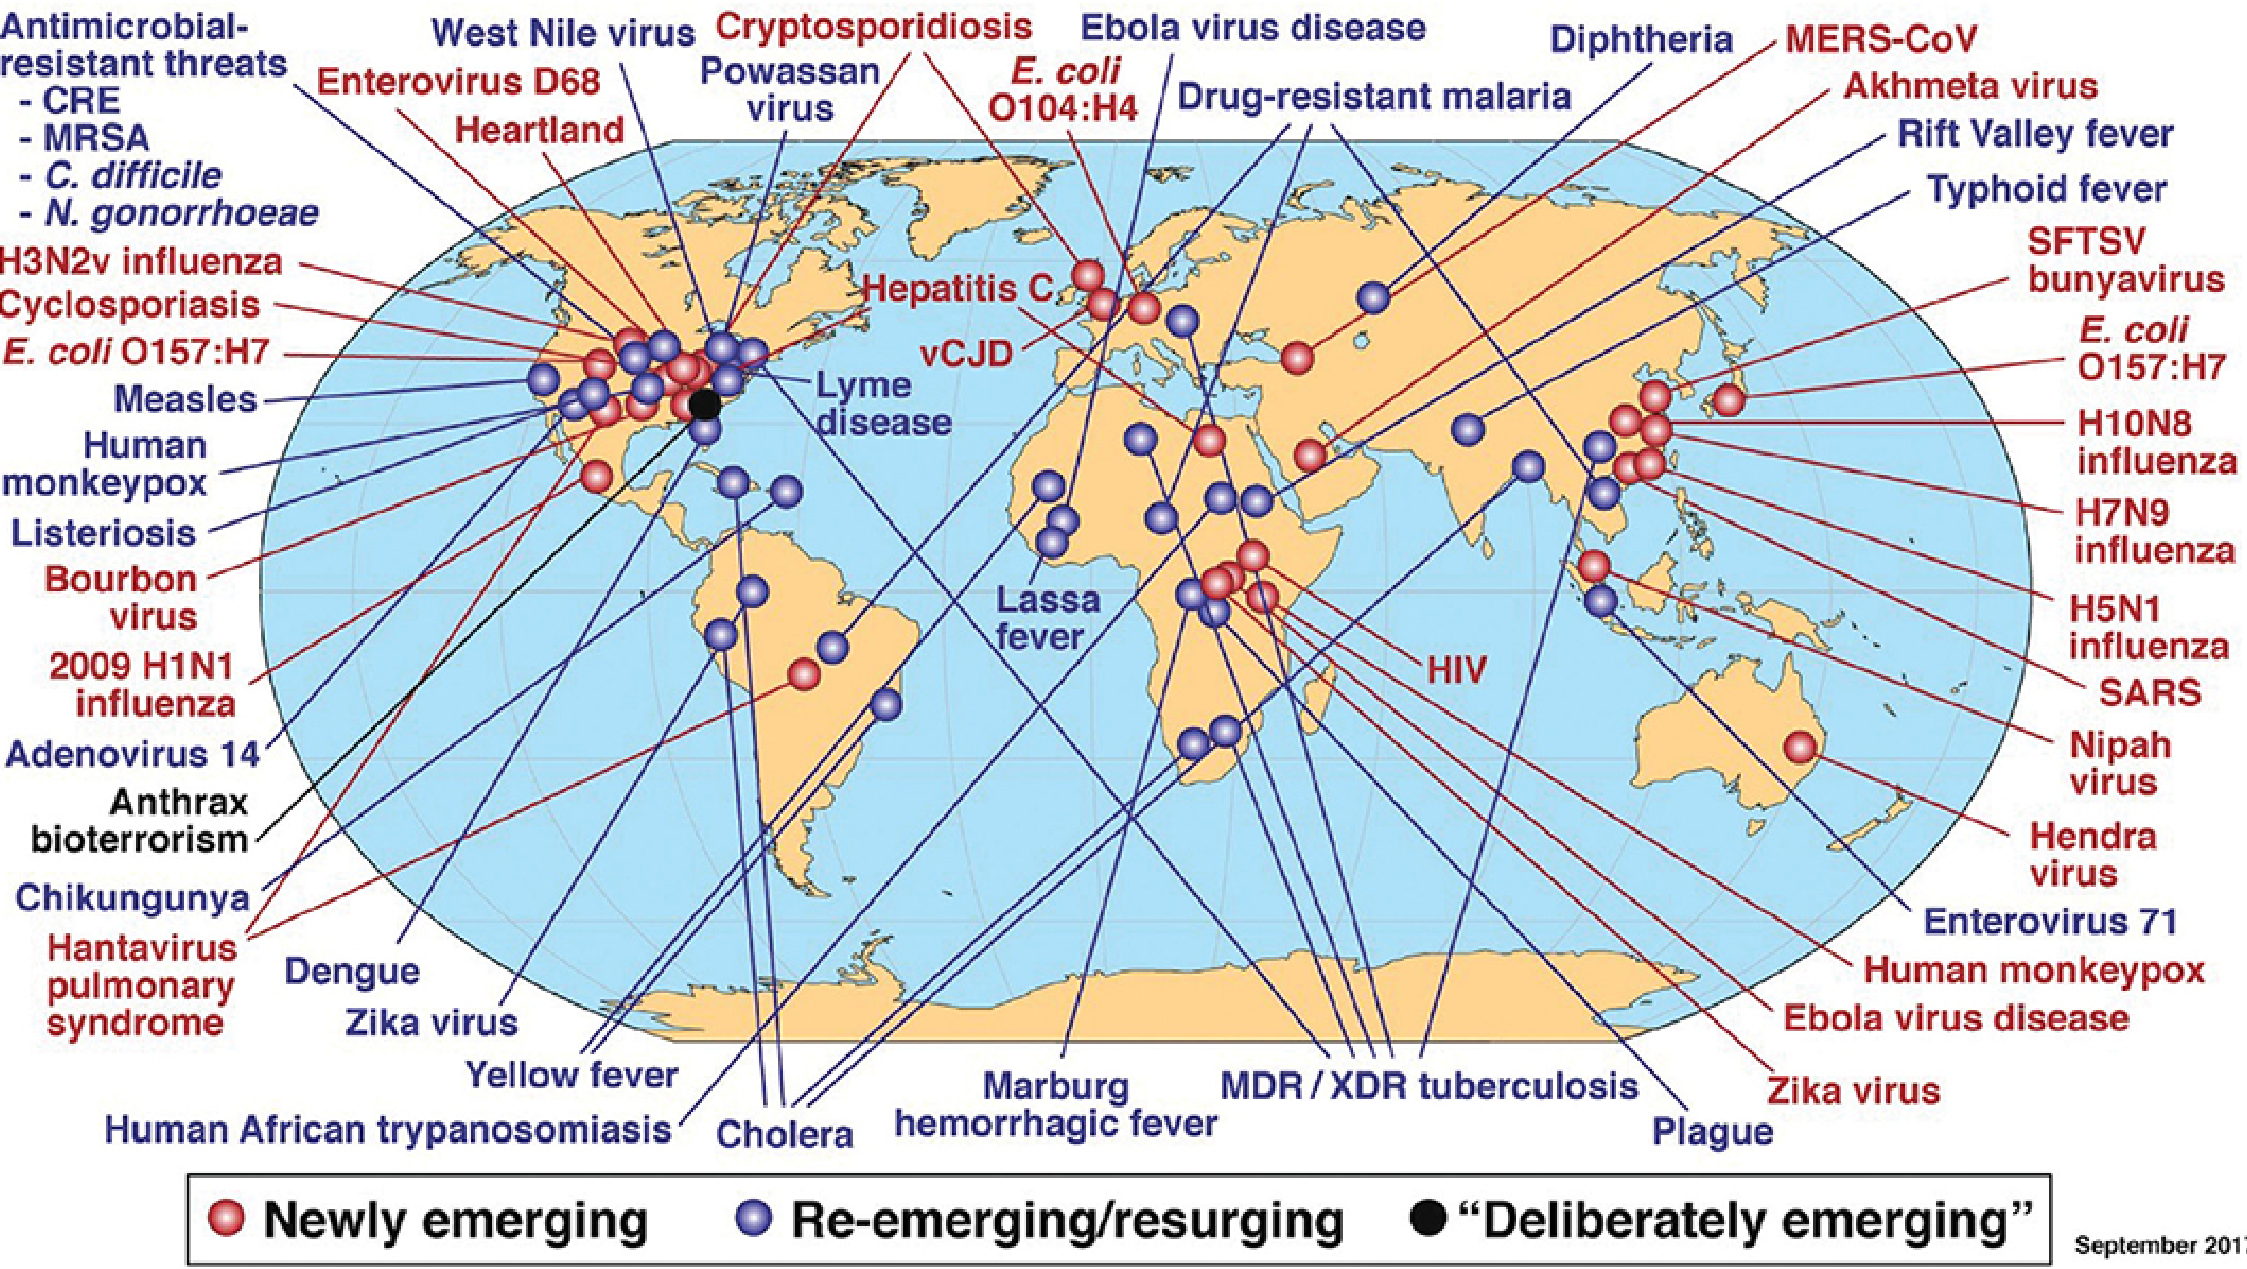
- Red dots = Newly emerging diseases (e.g., COVID-19, Ebola, Zika, Hantavirus, SARS, MERS-CoV, Nipah)
- Blue dots = Re-emerging/resurging diseases (e.g., Measles, Cholera, Dengue, TB, Diphtheria, Plague)
- Black dot = "Deliberately emerging" (e.g., Anthrax bioterrorism)
Antimicrobial Resistance - A Special Category
Resistance to antimicrobials is a key driver of re-emerging disease. It is promoted by:
- Treatments that do not result in cure
- Subtherapeutic doses of antibiotics
- Counterfeit drugs
- Increasing worldwide use of antimicrobials
This problem is projected to increase in the foreseeable future.
Public Health Significance
"National health has become an international challenge. An outbreak anywhere must now be seen as a threat to virtually all countries, especially those that serve as major hubs of international travel." - Park's
Despite the emergence of new diseases in the last 30 years, there remains a lack of national and international political will and resources to develop the systems needed to detect them and stop their spread.
Sources:
- Park's Textbook of Preventive and Social Medicine - Chapter on International Health, pp. 405-407
- Sherris & Ryan's Medical Microbiology, 8th Edition - Chapter 5
Hazards of urbanization
Finding Sources
Finding Sources
Finding Sources
Reading File
Reading File
The file went into literacy tables. Let me search specifically for the health hazards/problems section of urbanization:
Finding Sources
Finding Sources
Reading File
The urbanization section seems to continue elsewhere. Let me search more specifically:
Finding Sources
Finding Sources
Reading File
Let me search directly for the content that discusses urban problems/health hazards specifically in the context of urbanization in the social and preventive medicine context:
Finding Sources
Finding Sources
Found the relevant section - Park's discusses urbanization-related hazards under INDUSTRIALIZATION in block10. Let me read it:
Reading File
Now let me also read the earlier urbanization section in block7 that covers the problems of urban growth, and the dynamics of social change section that links urbanization to health:
Reading File
I now have enough content from Park's to compile a comprehensive answer. Let me also read the block7 urbanization section more fully for the health problems and social problems listed:
Reading File
I now have all the core content from Park's. I have the key paragraph from block10 that directly lists all health hazards of urbanization/industrialization, plus the urbanization definitions and context. Let me now compile the complete answer drawing from all sections read:
Hazards of Urbanization
(Source: Park's Textbook of Preventive and Social Medicine)
Definition of Urbanization
In the Indian context, an urban area is defined as:
"Towns (places with municipal corporation, municipal area committee, town committee, notified area committee or cantonment board); also, all places having 5,000 or more inhabitants, a density of not less than 1,000 persons per square mile or 390 per square kilometre, pronounced urban characteristics and at least three-fourths of the adult male population employed in pursuits other than agriculture."
As of 2019, the urban population of India stands at 471.828 million (34.5%).
Causes of Urbanization (Rural-to-Urban Migration)
- Employment opportunities
- Attraction of better living conditions
- Availability of social services (education, health, transport, entertainment)
"The continuous migration of people from the countryside to urban areas in India constitutes a social crisis, the ramification of which may eventually impair the quality of life." - Park's
Health Hazards of Urbanization
Park's lists the community health problems arising out of urbanization and industrialization under the following broad categories:
1. Environmental Pollution
| Type | Details |
|---|---|
| Air pollution | Industrial smoke, vehicular exhaust, burning of fossil fuels; causes respiratory diseases (bronchitis, asthma, COPD, lung cancer) |
| Water pollution | Industrial effluents and sewage contaminate water sources; causes waterborne diseases (cholera, typhoid, hepatitis A) |
| Noise pollution | Traffic, industries, construction; causes hearing loss, hypertension, stress, sleep disturbances |
| Radiation hazards | Increased use of electrical, electronic, and telecommunication devices |
2. Creation of Slums
- Rapid and unplanned migration leads to growth of slums and shanty towns
- Slums are characterized by:
- Extreme overcrowding
- Lack of safe drinking water
- Inadequate or absent sanitation
- Poor housing and ventilation
- Deficient refuse disposal
- Slum dwellers are among the most vulnerable populations for communicable disease
- NUHM (National Urban Health Mission) specifically targets slum dwellers and homeless, rag-pickers, street children, construction workers, sex workers, and temporary migrants
3. Overcrowding
- High population density in urban areas facilitates person-to-person spread of infectious diseases
- Promotes transmission of:
- Respiratory infections (TB, influenza, COVID-19)
- Meningitis
- Childhood infections (measles, chickenpox)
4. Communicable Disease Problems
- Tuberculosis (TB) - overcrowding + poor ventilation = major risk
- Sexually transmitted infections (STIs) - associated with urban lifestyle changes and sex work
- Vector-borne diseases - urban water stagnation breeds mosquitoes (dengue, malaria)
- Waterborne diseases - contaminated urban water supplies
5. Accidents and Injuries
- Road traffic accidents - rapid increase in vehicles; a major urban hazard
- Industrial accidents - unsafe working conditions in urban factories
- Domestic accidents
6. Mental Health Problems
| Problem | Urban Driver |
|---|---|
| Delinquency | Anonymity, social disorganization, poverty |
| Psychoneurosis | Stress, isolation, loss of social support |
| Depression and anxiety | Competitive lifestyle, loss of community bonds |
| Juvenile delinquency | Broken family structures, urban poverty |
People are removed from the warm intimacy of village life to the isolated and impersonal life in towns and cities - creating social and psychological stress.
7. Social Problems
Park specifically lists the following social hazards of urbanization:
- Alcoholism
- Drug dependence
- Prostitution
- Gambling
- Crime
8. Non-communicable Diseases (NCDs)
Urbanization promotes adoption of unhealthy lifestyles:
- Sedentary lifestyle → obesity, diabetes, cardiovascular disease
- Dietary changes → increased consumption of processed food; nutritional disorders
- Tobacco use → lung cancer, COPD
- Hypertension - related to stress, noise, sedentary work
The second evolutionary stage of industrialized countries is dominated by chronic diseases - particularly cardiovascular, cerebrovascular diseases, and cancer.
9. Inadequate Water Supply and Sanitation
- Urban growth outpaces infrastructure development
- Poor sewage disposal; open defecation in slums
- Inadequate refuse/solid waste management
- Stagnant water breeding grounds for vectors
10. Housing Problems
- Shortage of affordable housing
- Poor ventilation, inadequate natural light
- Overcrowded tenements; promotes spread of respiratory infections
- Lack of recreational spaces
11. Nutrition and Food Safety Issues
- Food adulteration common in urban markets
- Urban poor at risk of protein-energy malnutrition and micronutrient deficiencies
- Changes in food habits - unhealthy fast food consumption
Summary Table - Hazards of Urbanization
| Category | Specific Hazards |
|---|---|
| Environmental | Air pollution, water pollution, noise, radiation |
| Housing | Slums, overcrowding, poor sanitation |
| Communicable diseases | TB, STIs, waterborne, vector-borne |
| Non-communicable diseases | CVD, diabetes, cancer, obesity |
| Mental health | Delinquency, psychoneurosis, depression |
| Social | Alcoholism, drug dependence, prostitution, gambling, crime |
| Accidents | Road traffic, industrial, domestic |
| Nutrition | Food adulteration, changing food habits |
Public Health Response
India's National Urban Health Mission (NUHM) addresses these hazards by:
- Improving health status of urban slum dwellers and vulnerable populations
- Public health thrust on sanitation, clean drinking water, vector control
- Strengthening public health capacity of urban local bodies
- Deploying ASHAs/Link Workers (1 per 1000-2500 urban poor) for outreach services
Source: Park's Textbook of Preventive and Social Medicine - Chapter on Demography & Vital Statistics (Urbanization, p. 572), Social & Preventive Medicine (Industrialization & Health, p. 796), National Urban Health Mission
Enlist the types of epidemiological study designs. Describe the ditterent types of time trends in disease occurrence with suitable examples. Mention briefly the important difterences between case control and cohort study.
Finding Sources
Finding Sources
Finding Sources
Finding Sources
Finding Sources
Finding Sources
Found both key sections. Let me read them all in parallel now:
Reading File
Reading File
Excellent - got the time distribution section. Now let me read the cohort study section for the comparison table, and read more of the time trends (periodic fluctuations, secular trends):
Reading File
Reading File
Now let me read the periodic fluctuations + secular trends section, and the comparison table of case-control vs cohort study:
Reading File
Reading File
Now let me get the periodic fluctuations and secular trends sections, and the comparison table:
Reading File
Reading File
Let me get the periodic fluctuations section and the cohort vs case-control comparison table:
Reading File
Reading File
Let me now get the comparison table of case-control vs cohort:
Reading File
Let me specifically find the comparison table of case-control vs cohort study:
Finding Sources
Reading File
I have enough content from Park's now to write a comprehensive answer covering all three parts. Let me also read the advantages/disadvantages and cohort comparison part to round out the differences:
Reading File
Now let me get the cohort study advantages and disadvantages for the comparison:
Reading File
I now have all the content needed. Let me compile the complete, structured answer.
Epidemiological Study Designs, Time Trends & Case-Control vs Cohort Study
(Source: Park's Textbook of Preventive and Social Medicine)
PART 1: Types of Epidemiological Study Designs
Epidemiological studies are classified as:
EPIDEMIOLOGICAL STUDIES
│
├── 1. OBSERVATIONAL STUDIES
│   ├── A. DESCRIPTIVE STUDIES
│   │       – Describe disease by Time, Place, Person
│   │       – Generate hypothesis
│   │
│   └── B. ANALYTICAL STUDIES (test hypothesis)
│           ├── (i)  Ecological / Correlational     → Population as unit
│           ├── (ii) Cross-sectional / Prevalence   → Individual as unit
│           ├── (iii) Case-Control / Retrospective  → Individual as unit
│           └── (iv) Cohort / Prospective / Follow-up → Individual as unit
│
└── 2. EXPERIMENTAL STUDIES (Intervention Studies)
    ├── a. Randomized Controlled Trials (RCTs) / Clinical Trials → Patients
    ├── b. Field Trials                                          → Healthy people
    └── c. Community Trials / Community Intervention Studies    → Communities
"These studies cannot be regarded as watertight compartments; they complement one another." - Park's
PART 2: Types of Time Trends in Disease Occurrence
The pattern of disease may be described by the time of its occurrence - by week, month, year, day, hour of onset. Such studies yield important clues about the source or aetiology of disease.
Epidemiologists have identified three kinds of time trends:
I. Short-term Fluctuations (Epidemics)
The best-known short-term fluctuation is an epidemic, defined as:
"The occurrence in a community or region of cases of an illness or other health-related events clearly in excess of normal expectancy."
Epidemicity is relative to the usual frequency of the disease in the same area, among the same population, at the same season of the year.
Types of Epidemics:
A. Common-Source Epidemics
(a) Point-Source / Single-Exposure Epidemic:
- Exposure is brief and essentially simultaneous
- All cases develop within one incubation period
- Epidemic curve rises and falls rapidly, with no secondary waves
- Explosive clustering of cases within a narrow time interval
- Example: Food poisoning outbreak at a wedding banquet; Bhopal gas tragedy; Minamata disease (methyl mercury-contaminated fish in Japan)
(b) Continuous or Multiple Exposure Epidemic:
- Exposure from the same source is prolonged, repeated, or intermittent
- Epidemic curve is more extended and irregular
- Example: Legionnaire's disease (Philadelphia, 1976) - common-source, continuous exposure; gonorrhoea outbreak from a common source (prostitute)
B. Propagated Epidemics
- Results from person-to-person transmission
- Gradual rise, tails off over a much longer period
- Continues until susceptibles are depleted or no longer exposed
- Speed depends on herd immunity, opportunities for contact, secondary attack rate
- Sub-types:
- (a) Person-to-person: hepatitis A, polio
- (b) Arthropod vector: malaria, dengue
- (c) Animal reservoir: rabies, plague
C. Slow (Modern) Epidemics
- Gradual build-up over many years
- Example: HIV/AIDS epidemic; tobacco-related lung cancer epidemic
II. Periodic Fluctuations
These are regular, recurring patterns in disease occurrence:
(i) Seasonal Trend:
- Regular variation linked to a specific season
- Related to temperature, humidity, rainfall, vector life cycles, overcrowding
- Examples:
- Measles and varicella - peak in early spring
- Upper respiratory infections - peak in winter months
- Bacterial gastroenteritis - prominent in summer (fly multiplication)
- Dengue/DHF in India - starts in July, peaks in September-November (late summer and monsoon)
- Malaria - peaks in monsoon and post-monsoon season
- Non-infectious: sunstroke (summer), hay fever (spring), snakebite (monsoon)
(ii) Cyclic Trend:
- Regular recurrence every few years
- Depends on accumulation of susceptibles in the population
- Examples:
- Measles - used to show cyclic peaks every 2-3 years before vaccination
- Influenza - shows periodic cycles
- Meningococcal meningitis - shows cyclic periodicity
III. Long-term or Secular Trends
"The term 'secular trend' implies changes in the occurrence of disease (i.e., a progressive increase or decrease) over a long period of time, generally several years or decades."
Although it may have short-term fluctuations imposed on it, a secular trend implies a consistent tendency to change in a particular direction.
Examples of Increasing Secular Trends (Upward):
- Coronary heart disease (CHD) - consistent upward trend in developed countries over the past 50 years
- Lung cancer - progressive increase, linked to smoking
- Diabetes mellitus - progressive increase worldwide
- Mental health disorders
Examples of Decreasing Secular Trends (Downward):
- Tuberculosis - progressive decline with improved living standards and chemotherapy
- Typhoid fever - decline with improved water supply and sanitation
- Diphtheria - decline with immunization
- Poliomyelitis - decline with vaccination
Interpretation of Time Trends
The epidemiologist uses time trends to:
- Identify which diseases are increasing or decreasing
- Identify emerging health problems
- Assess effectiveness of control measures
- Formulate aetiological hypotheses
- Determine whether changes are due to: changes in aetiological agent; changes in diagnosis/reporting; changes in age distribution; or changes in quality of life/socioeconomic status
Classic example: "Time clustering" of adenocarcinoma of the vagina in young women (7 cases in Boston, 1966-1969) led to identification of in utero DES (diethylstilbestrol) exposure as the cause - discovered through a case-control study.
PART 3: Differences Between Case-Control and Cohort Study
| Feature | Case-Control Study | Cohort Study |
|---|---|---|
| Direction | Backward - from effect to cause (retrospective) | Forward - from cause to effect (prospective) |
| Starting point | Begins with people who have the disease (cases) and without disease (controls) | Begins with people without disease, classified by exposure |
| Exposure status | Both exposure and disease have already occurred when study begins | Exposure has occurred, but disease has not yet occurred |
| Time | Relatively quick - can be done rapidly | Takes years to decades (especially for chronic diseases) |
| Cost | Inexpensive | Expensive and resource-intensive |
| Sample size | Requires fewer subjects | Requires large numbers |
| Rare diseases | Suitable - ideal for rare diseases | Unsuitable for rare diseases (too many needed) |
| Rare exposures | Less suitable | Suitable (e.g., radiologists, industrial workers) |
| Measure of risk | Cannot measure incidence directly; only estimates Odds Ratio (OR) as surrogate for RR | Directly measures incidence and calculates Relative Risk (RR) and Attributable Risk (AR) |
| Bias | Prone to recall/memory bias, selection bias, Berkesonian bias | Less prone to recall bias (exposure recorded before disease occurs) |
| Follow-up | Not required - no attrition problems | Requires long follow-up; attrition is a major problem |
| Multiple exposures | Can study several aetiological factors simultaneously for one disease | Primarily suited to study one exposure and multiple disease outcomes |
| Multiple outcomes | Less suitable | Can study multiple disease outcomes from a single exposure |
| Ethical issues | Minimal | May have ethical issues (withholding treatment/intervention) |
| Incubation/latency | Suitable for diseases with long latency (e.g., cancers) | Requires very long follow-up for diseases with long latency |
| Classic examples | Smoking & lung cancer (Doll & Hill); OCP & DVT; DES & vaginal adenocarcinoma | Framingham Heart Study (smoking & CHD); Doll & Hill - British Doctors Cohort; RCGP OCP cohort study |
Key Differences Summary (Mnemonic):
| Aspect | Case-Control | Cohort |
|---|---|---|
| Direction | Backward | Forward |
| Risk measure | Odds Ratio | Relative Risk |
| Speed | Fast | Slow |
| Cost | Cheap | Expensive |
| Numbers | Small | Large |
| Bias | More | Less |
| Best for | Rare diseases | Rare exposures, incidence |
Source: Park's Textbook of Preventive and Social Medicine - Chapter on Epidemiology: Time Distribution (pp. 76-79), Case-Control Studies (pp. 83-87), Cohort Studies (pp. 88-92)
Health indicators
Finding Sources
Finding Sources
Found the main section. Let me read the full indicators section:
Reading File
Reading File
Reading File
Reading File
Reading File
I have comprehensive content. Now let me compile the complete answer:
Health Indicators
(Source: Park's Textbook of Preventive and Social Medicine)
Definition
"Indicators are variables which help to measure changes." (WHO guidelines for health programme evaluation)
A question often raised is: How healthy is a given community? Indicators are required:
- To measure the health status of a community
- To compare health status of one country with another
- For assessment of health care needs
- For allocation of scarce resources
- For monitoring and evaluation of health services, activities, and programmes
Health indicator vs. Health index:
- Health indicator - preferred for health trends (measures single variable)
- Health index - an amalgamation of multiple health indicators
Characteristics of Ideal Indicators (VRSSFR)
| Characteristic | Meaning |
|---|---|
| Valid | Actually measure what they are supposed to measure |
| Reliable and Objective | Same answers when measured by different people in similar circumstances |
| Sensitive | Sensitive to changes in the situation concerned |
| Specific | Reflect changes only in the situation concerned |
| Feasible | Ability to obtain the data needed |
| Relevant | Contribute to understanding of the phenomenon of interest |
"But in real life there are few indicators that comply with all these criteria. Health, like happiness, cannot be defined in exact measurable terms."
Classification of Health Indicators
Park classifies indicators into 12 groups:
- Mortality indicators
- Morbidity indicators
- Disability rates
- Nutritional status indicators
- Health care delivery indicators
- Utilization rates
- Indicators of social and mental health
- Environmental indicators
- Socio-economic indicators
- Health policy indicators
- Indicators of quality of life
- Other indicators
1. Mortality Indicators
(a) Crude Death Rate (CDR)
- Deaths per 1,000 population per year
- A "fair indicator" of comparative health
- Limitation: influenced by age-sex composition of population
- Decrease in death rate = good tool for assessing health improvement
(b) Expectation of Life (Life Expectancy at Birth)
- "The average number of years that will be lived by those born alive if current age-specific mortality rates persist"
- Positive health indicator - increase in life expectancy = improvement in health
- Good indicator of socio-economic development
- Life expectancy at age 1: excludes influence of infant mortality
- Life expectancy at age 5: excludes influence of child mortality
(c) Infant Mortality Rate (IMR)
- Deaths under 1 year per 1,000 live births
- Sensitive indicator of the health status of a community
- Reflects the level of nutrition, hygiene, and availability of healthcare
- Often used as a proxy for overall community health
- Widely used for international comparisons
(d) Child Mortality Rate (Under-5 Mortality Rate / U5MR)
- Deaths in children under 5 years per 1,000 live births
- Reflects child health and survival; used as SDG indicator (SDG 3.2.1)
(e) Maternal Mortality Rate (MMR)
- Deaths of women due to pregnancy/childbirth per 100,000 live births
- SDG indicator (SDG 3.1.1)
(f) Disease-specific mortality rates
- TB mortality rate, AIDS-related mortality, malaria mortality, NCD mortality
(g) Proportional Mortality Rate (PMR)
- Proportion of all deaths attributed to a specific cause
- Useful for describing the pattern of mortality in a population
- PMR > 50% for ages 50+ = "positive health indicator" (good health, most people dying in old age)
(h) Sickness Impact Profile
- Measures impact of disease on daily living
2. Morbidity Indicators
Used when mortality data alone is insufficient (e.g., chronic diseases, disabilities):
- Incidence and prevalence rates of specific diseases
- Notification rates (communicable diseases)
- Attendance rates at outpatient departments
- Admission rates / bed occupancy rates
- Sickness absence rates from work/school
- New cases of HIV, TB, malaria, STIs (SDG indicators)
3. Disability Rates
Measure functional limitations in population:
- Days of restricted activity
- Bed disability days
- Work-loss days
- Prevalence of blindness, deafness, mental retardation, physical disability
4. Nutritional Status Indicators
- Anthropometric measures: weight-for-age, height-for-age, weight-for-height in children
- Low birth weight (< 2.5 kg) percentage - reflects maternal nutrition
- Nutritional deficiency diseases: prevalence of anaemia, PEM, vitamin A deficiency, iodine deficiency
5. Health Care Delivery Indicators
- Doctor-population ratio (physician density per 10,000)
- Nurse-population ratio
- Hospital beds per 1,000 population
- Population per health facility
- Availability and accessibility of health services
6. Utilization Rates
- Percentage of infants fully immunized
- Percentage of deliveries conducted by trained personnel
- Antenatal care coverage
- Proportion of population using family planning methods
- Outpatient attendance per person per year
7. Indicators of Social and Mental Health
- Rates of mental disorders (depression, schizophrenia)
- Suicide rates (SDG 3.4.2)
- Homicide rates (SDG 16.1.1)
- Rates of road traffic accidents (SDG 3.6.1)
- Rates of crime, delinquency, drug abuse, alcohol consumption
- School drop-out rates
8. Environmental Indicators
- Proportion of population with access to safe drinking water
- Proportion with access to adequate sanitation
- Air quality - particulate matter levels, SO₂, NOx
- Water quality indices
- Solid waste disposal adequacy
9. Socio-Economic Indicators
These have a strong influence on health status:
- Per capita GNP/GDP
- Adult literacy rate (especially female literacy)
- Income distribution (Gini coefficient)
- Unemployment rate
- Food availability and nutritional adequacy
- Housing standards
- Rate of population growth
10. Health Policy Indicators
- Political commitment to Health for All
- Resource allocation for health (% GDP on health)
- Degree of equity in distribution of health services
- Community involvement in health programmes
- Organizational framework and managerial processes
11. Indicators of Quality of Life
(a) Physical Quality of Life Index (PQLI)
- Composite of: Infant Mortality Rate + Life Expectancy at age 1 + Literacy rate
- Scale: 0 to 100
(b) Human Development Index (HDI)
- UNDP composite index of:
- Life expectancy
- Adult literacy + mean years of schooling
- Per capita income (PPP)
(c) QALY (Quality-Adjusted Life Year)
- Combines quantity (years of life) + quality of life
- Used in health economic assessments
- 1 QALY = 1 year of life in perfect health (value = 1.0)
- Death = 0.0
(d) DALY (Disability-Adjusted Life Year)
"DALY is a measure of overall disease burden, expressed as number of years lost due to ill-health, disability, or early death."
Formula: DALY = YLL + YLD
-
YLL = Years of Life Lost (premature mortality)
-
YLD = Years Lived with Disability (morbidity)
-
1 DALY = 1 year of healthy life lost
-
Developed by Harvard University for World Bank (1990); adopted by WHO in 2000
-
Japanese life expectancy used as standard (longest in world)
(e) Disability-Free Life Expectancy (DFLE)
- Average years expected to live free of disability
WHO "Health for All" Indicators (4 Categories)
| Category | Examples |
|---|---|
| Health Policy Indicators | Political commitment, resource allocation, equity, community involvement |
| Social & Economic Indicators | Population growth rate, GNP, income distribution, literacy, housing |
| Health Care Provision Indicators | Availability, accessibility, utilization, quality of care |
| Health Status Indicators | LBW%, IMR, U5MR, MMR, life expectancy, morbidity, disability |
WHO Global Reference List of Health Indicators (SDG Era)
These cover 4 domains:
- Health status (mortality, morbidity, fertility)
- Risk factors (tobacco, obesity, alcohol, unsafe water)
- Service coverage (immunization, ANC, HIV treatment)
- Health systems (health workers density, UHC index)
Source: Park's Textbook of Preventive and Social Medicine - Chapter on Concept of Health, Indicators of Health, pp. 28-42
Types of sampling
Finding Sources
Finding Sources
Finding Sources
Your credits are exhausted. You can purchase a top-up or subscribe to a plan to continue using Orris. If you're already subscribed, your daily credits will reset tomorrow.
This is a shared conversation. Sign in to Orris to start your own chat.