
the great preponderance of normal females are in reality mosaics and have two populations of cells, one with an inactivated maternal X chromosome and the other with an inactivated paternal X chromosome. Herein lies the explanation of why females have the same dosage of X-linked active genes as males. The inactive X chromosome can be seen in the interphase nucleus as a darkly staining small mass in contact with the nuclear membrane known as the Barr body, or X chromatin.
X-inactivation Lyon hypothesis Barr body mosaicism females
Barr body X chromatin interphase nucleus inactive X chromosome
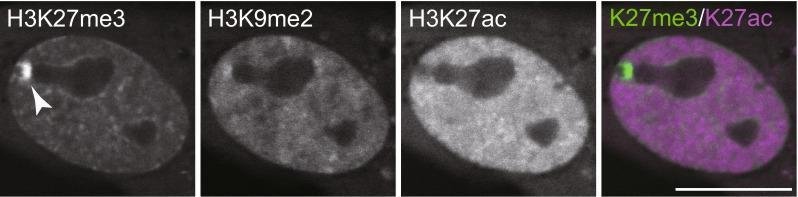
This set of four diagnostic fluorescence images demonstrates the live-cell imaging of histone modifications in a human hTERT-RPE1 nucleus using Fab-based live endogenous modification labeling (FabLEM). Three individual channels show different histone marks: H3K27me3 (trimethylation associated with gene silencing), H3K9me2 (dimethylation), and H3K27ac (acetylation associated with active transcription). The H3K27me3 channel exhibits a highly concentrated, localized signal (indicated by an arrowhead), which identifies the inactive X chromosome. In contrast, the H3K27ac channel shows a broad, uniform distribution across the nucleus but is distinctly excluded from the inactive X chromosome territory. The H3K9me2 channel shows a relatively uniform nuclear distribution with slight enrichment in the same region as K27me3. A fourth composite image overlays H3K27me3 (green) and H3K27ac (magenta), highlighting the mutual spatial exclusion between these epigenetic marks. This visual comparison illustrates the organization of chromatin into distinct functional domains, specifically contrasting heterochromatin (inactive) and euchromatin (active) states within a living human cell.
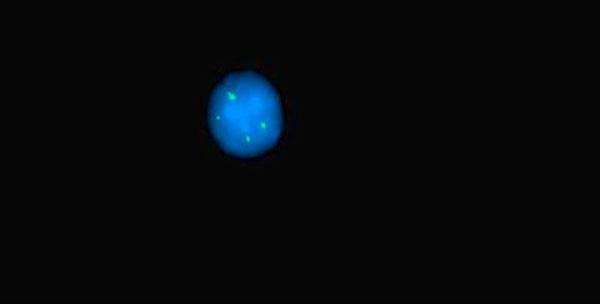
This diagnostic image demonstrates a fluorescence in situ hybridization (FISH) analysis of a human cell nucleus. The interphase nucleus is visualized with a blue counterstain, likely DAPI, highlighting the chromatin within the nuclear envelope. Inside the nucleus, four distinct bright green punctate signals are visible, representing fluorescently labeled probes targeting the 1p subtelomere region. The spatial arrangement shows a cluster of three signals in close proximity, with a fourth signal located separately within the nuclear territory. Clinically, the presence of four signals instead of the typical two indicates an abnormal copy number, such as tetrasomy or gain of the 1p chromosomal region, which is a significant finding in cytogenetics for diagnosing certain hematologic malignancies or solid tumors. This image is used to teach concepts of clinical genetics, chromosomal abnormalities, and molecular pathology techniques.
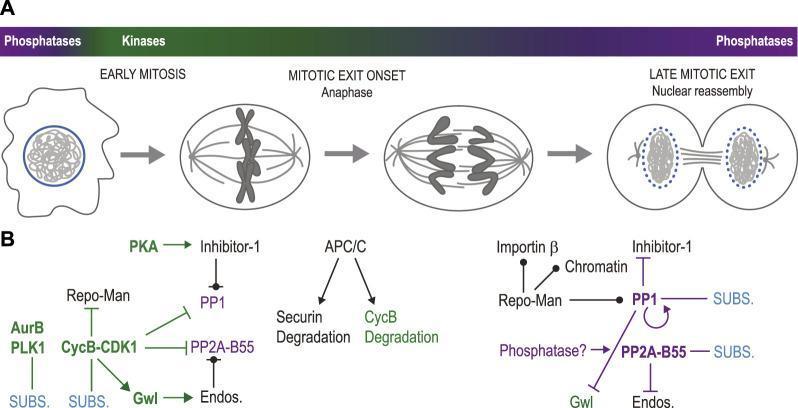
This medical illustration depicts the temporal regulation of mitosis and nuclear reassembly through signaling pathways. Panel A shows a cell cycle timeline from early mitosis to late mitotic exit. Key visual milestones include nuclear envelope breakdown (NEBD), chromosome condensation and alignment on the metaphase plate, sister chromatid separation during anaphase, and eventual cytokinesis with nuclear reassembly around decondensing chromatin. A color-coded bar indicates the shifting dominance between kinases (green) and phosphatases (purple) across these stages. Panel B details the molecular signaling network. At mitotic entry (left), Cyclin B-CDK1, Aurora B, and PLK1 dominate, inhibiting phosphatases like PP1 and PP2A-B55 via regulatory proteins like Repo-Man and Greatwall (Gwl)/Endos. At the onset of mitotic exit (center), the Anaphase Promoting Complex/Cyclosome (APC/C) triggers the degradation of Securin and Cyclin B. In late mitotic exit (right), PP1 and PP2A-B55 regain activity, dephosphorylating substrates (SUBS.) and regulatory proteins to promote the reformation of the interphase nucleus and completion of cell division.
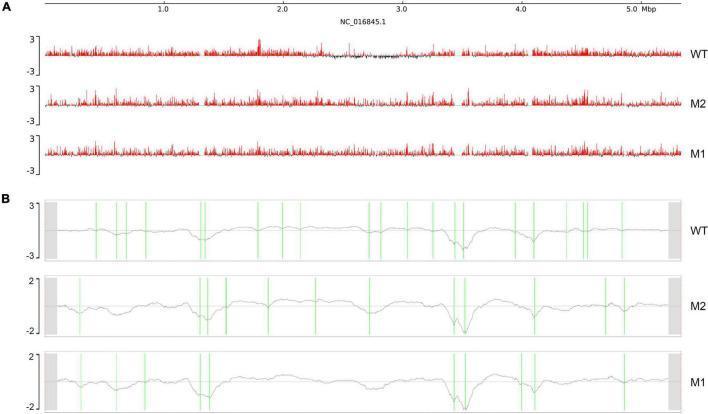
This figure presents genomic data visualizations illustrating chromosome interaction structures in Klebsiella pneumoniae for wild-type (WT) and mutant (M1, M2) strains. Panel A displays Chromosome A/B compartments across the genome (0 to 5.0 Mbp). The x-axis represents genomic coordinates, and the y-axis shows eigenvector values ranging from -3 to 3. Positive values (red) denote compartment A (transcriptionally active), while negative values (black) denote compartment B (inactive). The WT shows alternating A/B patterns, whereas M1 and M2 exhibit increased red signal intensity, suggesting a shift toward more open, active chromatin. Panel B illustrates Chromosomal Interaction Domains (CIDs). The y-axis represents the insulation index, with grey lines tracing chromatin density. Vertical green lines demarcate CID boundaries. Visual comparison shows a higher density of boundaries in WT compared to mutants, indicating that smaller CIDs in the WT have merged into larger, less defined domains in M1 and M2. These diagrams are used in microbial genetics and pathophysiology to study how environmental stressors like simulated microgravity alter chromosome folding and gene expression.
X-Chromosome Inactivation and the Barr Body
What the Passage Is Describing
The Lyon Hypothesis - Core Tenets
| # | Principle |
|---|---|
| 1 | Only one X chromosome is genetically active in any somatic cell |
| 2 | The other X - whether of maternal or paternal origin - undergoes heteropyknosis and is rendered inactive |
| 3 | Inactivation of either the maternal or paternal X is random among all cells of the blastocyst, occurring around day 5.5 of embryonic life (or ~16 days after conception) |
| 4 | Once inactivated, the same X chromosome remains inactive in all daughter cells (clonal propagation) |
- Basic Medical Biochemistry, 6e, p. 645-646
- Robbins & Cotran Pathologic Basis of Disease, p. 166
Why Females Are Mosaics
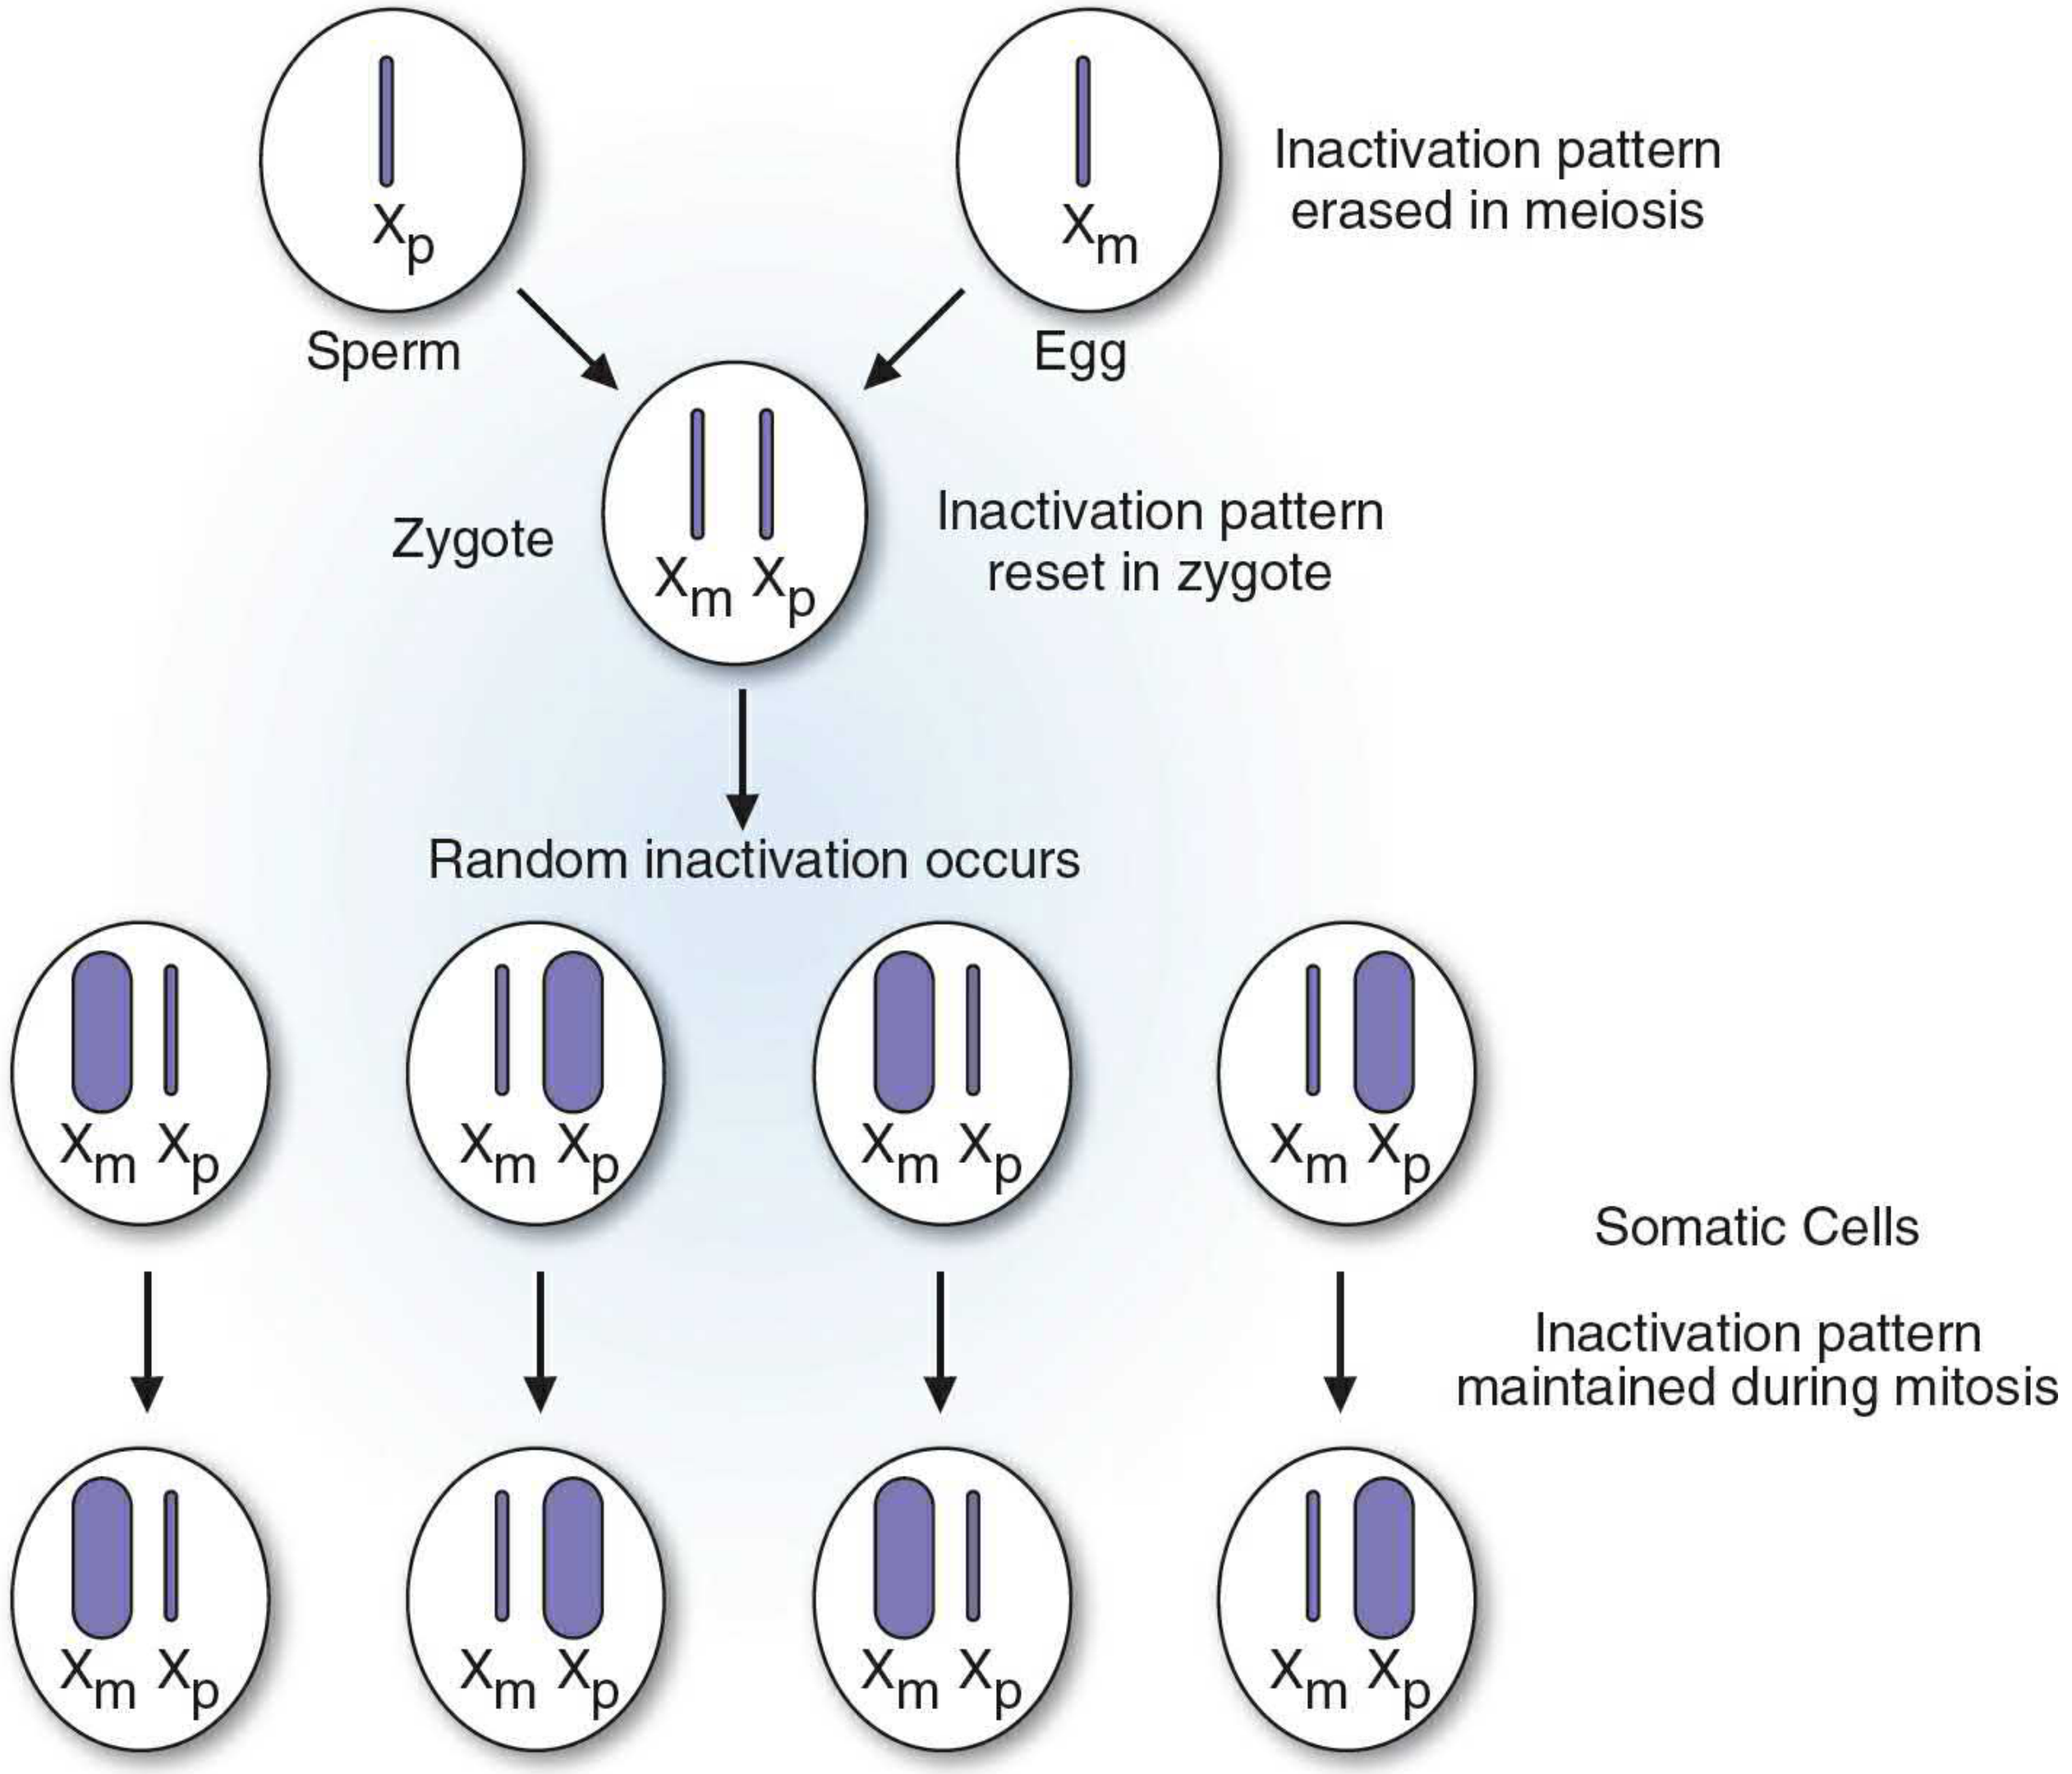
- In the zygote, both Xm and Xp are active
- At the ~8-16 cell stage, random inactivation occurs - some cells silence Xm, others silence Xp
- That inactivation pattern is maintained through all mitotic divisions in the daughter cells
- The result: a normal female has two distinct clonal populations of cells in her body
Gene Dosage Compensation: Why This Matters
- Every somatic cell in a female ends up with exactly one active X, matching males
- This is called dosage compensation
- Basic Medical Biochemistry, 6e states: "To keep gene dosage equal between the sexes, X-chromosome inactivation occurs when there is more than one X chromosome in a somatic cell"
The Barr Body
- It appears as a darkly staining, condensed mass at the inner edge of the nuclear membrane in interphase cells
- It is a region of heterochromatin - tightly packed, transcriptionally silent DNA
- The number of Barr bodies = total X chromosomes minus one (n - 1)
| Karyotype | X chromosomes | Barr bodies |
|---|---|---|
| 46,XY (normal male) | 1 | 0 |
| 46,XX (normal female) | 2 | 1 |
| 47,XXX (triple X) | 3 | 2 |
| 47,XXY (Klinefelter) | 2 | 1 |
| 48,XXXX | 4 | 3 |
Molecular Mechanism: XIST RNA
- The XIST gene (X-Inactive Specific Transcript) on the X chromosome produces a long non-coding RNA (lncRNA)
- XIST RNA is retained in the nucleus and "coats" the X chromosome it is transcribed from
- This initiates gene silencing via chromatin modification (histone deacetylation, H3K27 methylation) and DNA methylation
- On the active X, the XIST allele is switched off, so no coating occurs
- Inactivation begins as early as the 8-cell stage of the preimplantation embryo
Important Modification to the Original Hypothesis
- Approximately 30% of genes on Xp (the short arm) escape X-inactivation
- A smaller number (~3% on Xq) also escape
- This explains why Turner syndrome (45,X) - where females have only one X - still shows abnormal phenotypes: the single dose of genes that normally "escape" inactivation (and thus need two copies) is insufficient for normal development
Clinical Relevance
-
Carrier females for X-linked recessive diseases (e.g., hemophilia A, Duchenne muscular dystrophy) can sometimes show mild manifestations if - by chance - a greater proportion of their cells happen to inactivate the normal X rather than the mutant X. This is called skewed X-inactivation.
-
The Barr body count was historically used in clinical cytogenetics to screen for sex chromosome abnormalities before karyotyping became routine.
-
Turner syndrome (45,X) has no Barr bodies; Klinefelter syndrome (47,XXY) has one - demonstrating the "n-1" rule.
-
Robbins & Cotran Pathologic Basis of Disease, p. 166-167
-
Robbins & Kumar Basic Pathology, p. 166
-
Emery's Elements of Medical Genetics and Genomics, p. 135