
Heart failure every thing
"heart failure"[MeSH Terms] AND "treatment"[MeSH Terms]
heart failure pathophysiology diagram Frank-Starling
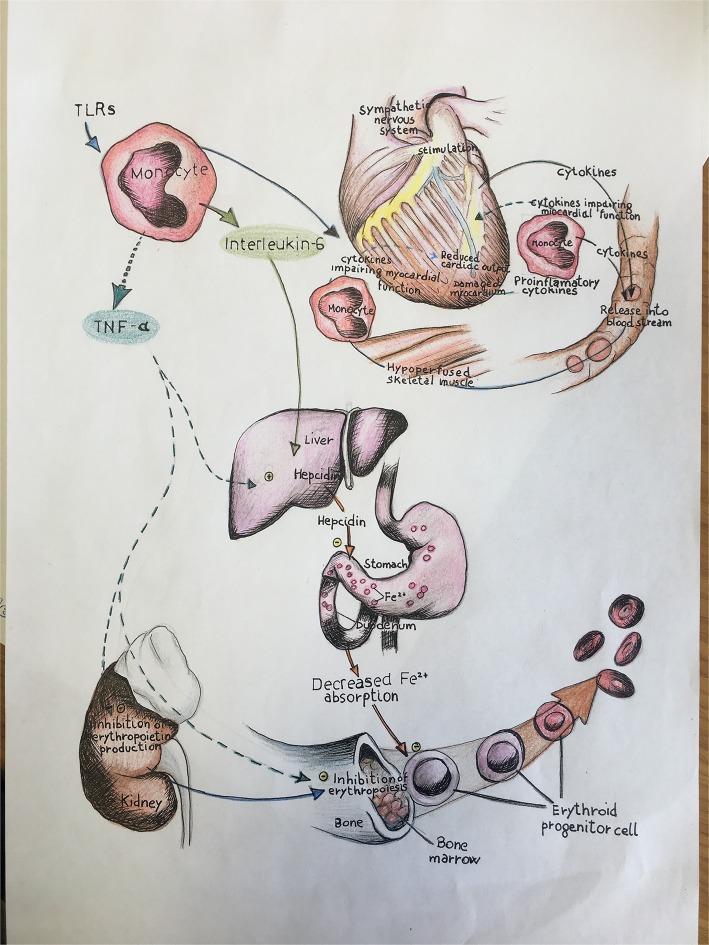
A pathophysiology diagram illustrating the multi-organ impact of immune-mediated inflammation in heart failure, specifically linking systemic cytokines to iron deficiency and anemia. The top of the schematic depicts a heart under stress, showing sympathetic nervous system stimulation, damaged myocardium, and reduced cardiac output. Monocytes activated via Toll-like receptors (TLRs) release pro-inflammatory cytokines, including Interleukin-6 (IL-6) and Tumor Necrosis Factor-alpha (TNF-α). The diagram shows IL-6 stimulating the liver to produce hepcidin, which inhibits Fe2+ absorption in the duodenum. Concurrently, TNF-α is shown causing the inhibition of erythropoietin production in the kidney and directly inhibiting erythropoiesis in the bone marrow. This suppression of erythroid progenitor cells, combined with decreased iron bioavailability, illustrates the mechanism behind the anemia of chronic disease and its role in worsening heart failure progression. The visual integrates cardiology, immunology, and hematology concepts, specifically targeting the clinical triad of inflammation, iron deficiency, and myocardial dysfunction.
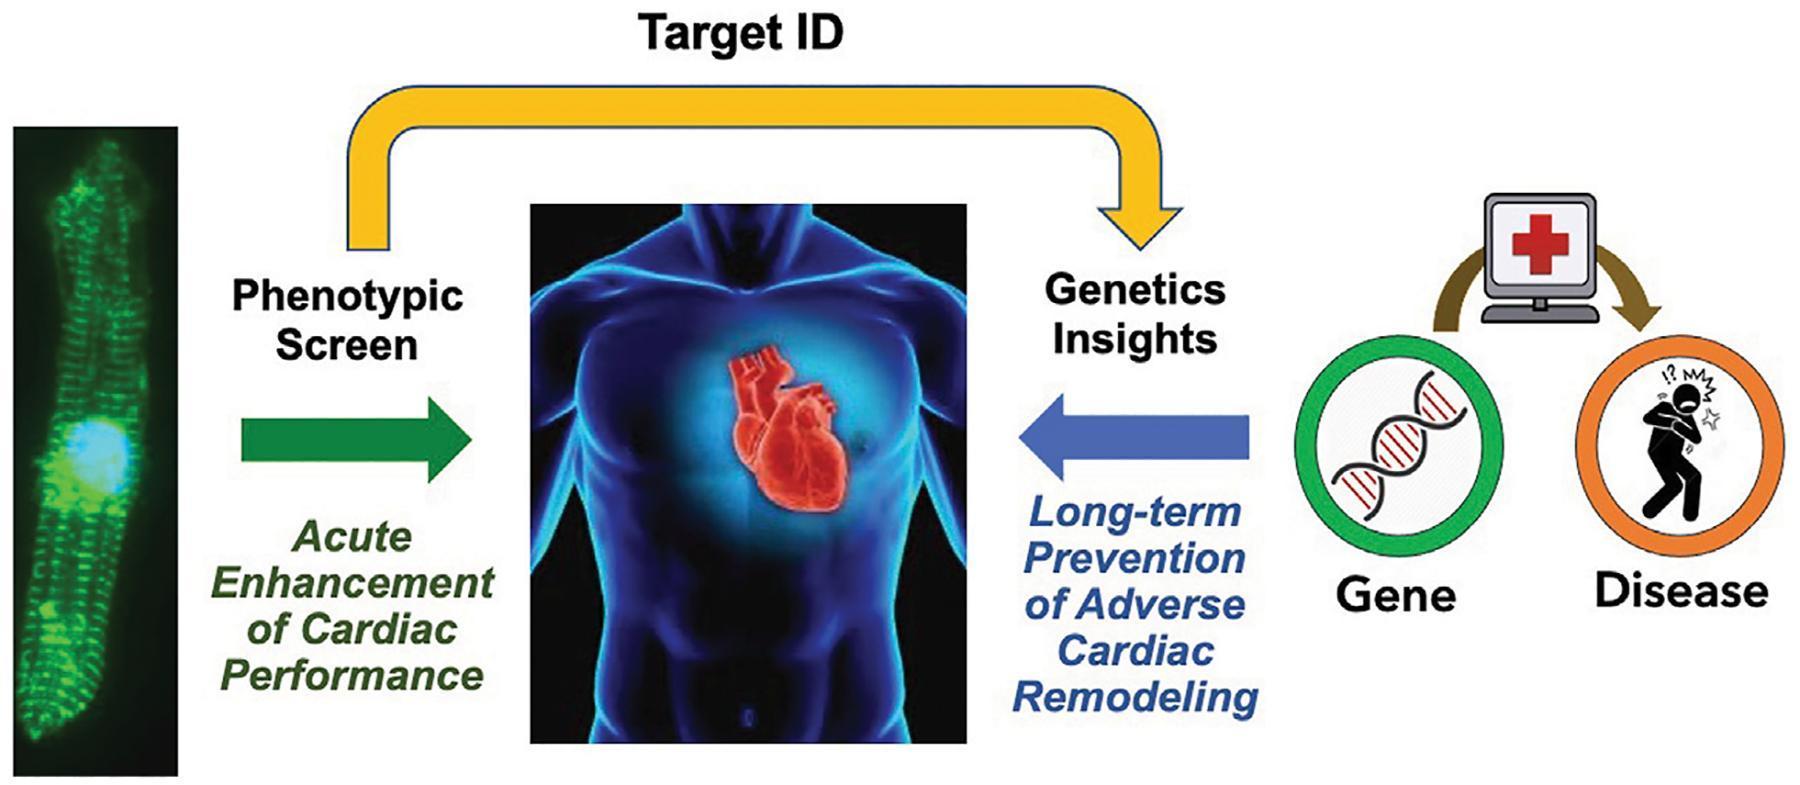
This pathophysiology and drug discovery diagram illustrates a conceptual framework for bridging the 'therapeutic divide' in heart failure treatment. The flowchart progresses from left to right, starting with a fluorescence microscopy image of a cardiomyocyte, representing a 'Phenotypic Screen.' A green arrow labeled 'Acute Enhancement of Cardiac Performance' points toward a blue anatomical rendering of a human torso with a highlighted red heart. A yellow overhead arc labeled 'Target ID' connects the phenotypic screen to a 'Genetics Insights' section. This section features a green 'Gene' icon containing a DNA double helix. A blue arrow directed back toward the heart represents the 'Long-term Prevention of Adverse Cardiac Remodeling.' On the far right, a brown arc connects the genetic data to a 'Disease' icon, depicting a human figure in distress, signifying the clinical phenotype. The diagram summarizes a translational approach that combines acute functional screening with genomic validation to identify therapeutics that provide both immediate hemodynamic benefits and favorable long-term cardiac remodeling outcomes.
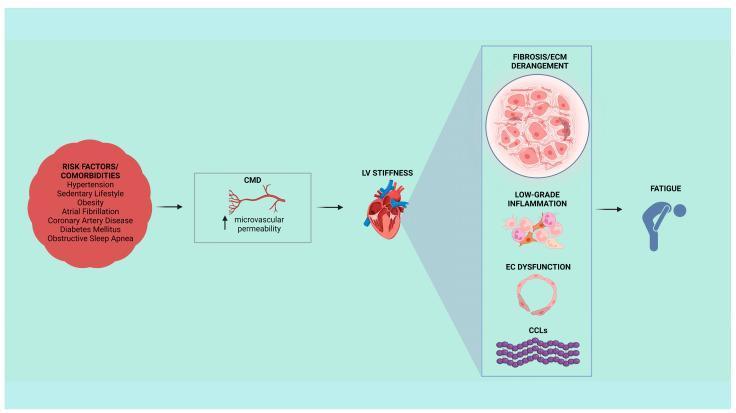
This pathophysiology diagram illustrates the clinical and cellular progression of heart failure with preserved ejection fraction (HFpEF). The flowchart begins with a list of risk factors and comorbidities (Hypertension, Sedentary Lifestyle, Obesity, Atrial Fibrillation, Coronary Artery Disease, Diabetes Mellitus, and Obstructive Sleep Apnea). These factors lead to Coronary Microvascular Dysfunction (CMD), characterized by increased microvascular permeability. The progression continues to Left Ventricular (LV) stiffness, depicted by a cardiac anatomical model. A magnified panel details the underlying molecular mechanisms of LV stiffness: 1) Fibrosis/Extracellular Matrix (ECM) derangement showing disorganized tissue, 2) Low-grade inflammation featuring activated immune cells, 3) Endothelial cell (EC) dysfunction represented by a circular vessel structure, and 4) Collagen Cross-Links (CCLs) depicted as wavy purple fibrils. The final stage of the cascade results in the clinical symptom of fatigue, symbolized by a silhouette of a person bent over. This diagram is designed for intermediate to advanced medical learners to understand the multifaceted etiology and structural changes driving HFpEF symptoms.
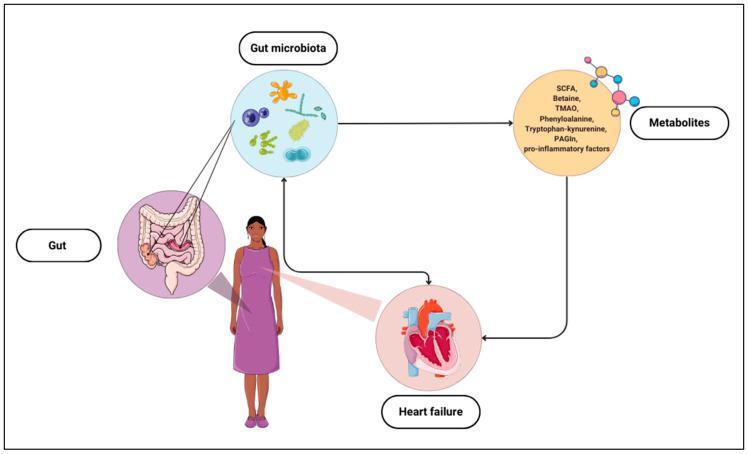
A pathophysiology diagram illustrating the bidirectional relationship between the gut microbiome and heart failure. The schematic features a central female human figure connected to circular insets representing the 'Gut' (anatomical intestine illustration) and 'Heart failure' (pathological heart cross-section). A light blue circle labeled 'Gut microbiota' displays various bacterial morphologies, with a directed arrow leading to a 'Metabolites' circle. This metabolite list includes short-chain fatty acids (SCFA), Betaine, Trimethylamine N-oxide (TMAO), Phenylalanine, Tryptophan-kynurenine, Phenylacetylglutamine (PAGIn), and pro-inflammatory factors. Further arrows indicate a feedback loop where the gut microbiota influences systemic metabolites, which in turn impact heart failure progression. Conversely, heart failure is shown to exert a reciprocal influence back on the gut microbiota, emphasizing the 'gut-heart axis.' This diagram is intended for medical education regarding cardiovascular disease mechanisms and the metabolic role of microbial dysbiosis in systemic health.
heart failure ECG chest X-ray cardiomegaly pulmonary edema
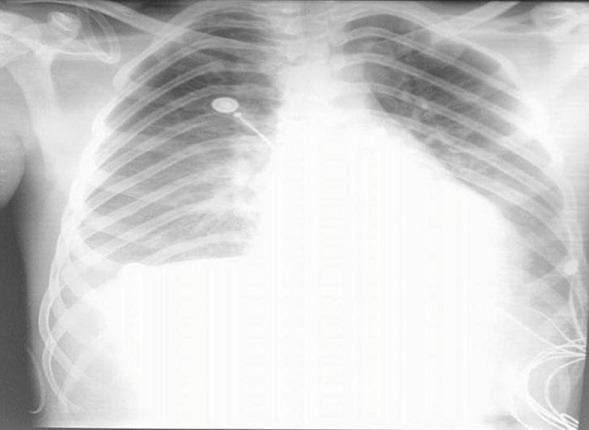
Frontal chest X-ray (radiography) demonstrating classic findings of cardiogenic pulmonary edema and cardiomegaly. The image shows a markedly enlarged cardiac silhouette with indistinct borders, occupying a significant portion of the thoracic cavity. Diffuse, bilateral hazy opacities are present throughout the lung fields, appearing most dense in the perihilar ('bat-wing' distribution) and basal regions, which obscure the normal pulmonary vascular markings. Blunting of the costophrenic angles is visible, particularly on the right, suggesting associated pleural effusions. Several medical devices are present, including a radiopaque central venous catheter entering from the right and terminating near the mediastinum, as well as external electrocardiogram (ECG) leads and wires projected over the chest wall. The clinical significance of these findings relates to acute heart failure or myocarditis, causing fluid extravasation into the lung parenchyma and pleural space. This image serves as a teaching tool for identifying radiological signs of congestive heart failure and cardiomegaly in an acute clinical setting.
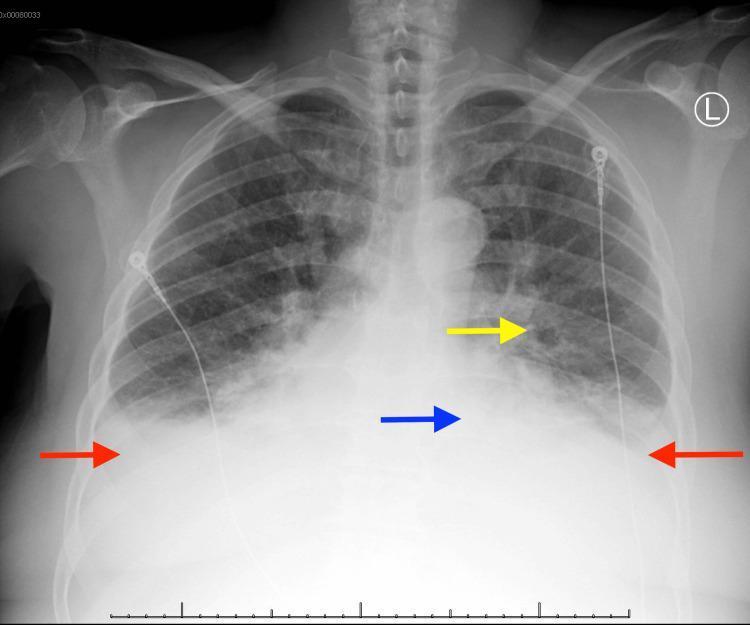
This diagnostic image is an anteroposterior (AP) chest x-ray demonstrating clinical features of congestive heart failure and pulmonary edema. The image is annotated with colored arrows to highlight key findings: cardiomegaly is indicated by an enlarged cardiac silhouette (blue arrow); bilateral pleural effusions are visible as increased basal opacities with blunting of the costophrenic angles (red arrows); and pulmonary vascular congestion is shown through increased prominence and blurring of the hilar and pulmonary vessels (yellow arrow). Diffuse bilateral pulmonary opacities are present throughout the lung fields, consistent with alveolar edema. Radiopaque ECG leads are visible across the thoracic surface, and a radiopaque tube or catheter is seen descending along the right side of the patient. The skeletal structures, including the ribs and clavicles, are visible. This visual serves as an educational example of the radiological manifestations of cardiogenic shock and reduced ejection fraction.
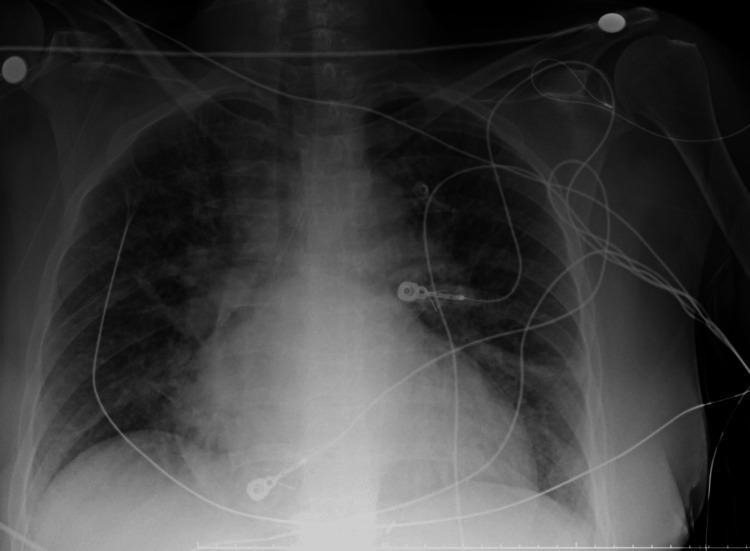
This anterior-posterior (AP) chest X-ray illustrates a case of acute pulmonary edema and cardiomegaly. The primary findings include diffuse, bilateral alveolar opacities and patchy infiltrates that exhibit a predominantly perihilar 'bat-wing' distribution. These densities obscure normal vascular markings and contribute to a mottled, ground-glass appearance throughout the mid-to-lower lung zones. The cardiac silhouette is significantly enlarged, with a widened mediastinum and indistinct heart borders consistent with congestive heart failure. Multiple supportive medical devices are present: a right-sided central venous catheter with its tip at the level of the superior vena cava, several circular radiopaque ECG electrode markers with associated lead wires traversing the anterior chest, and a vertical enteric tube passing through the lower mediastinum. The costophrenic angles are partially blunted by overlying infiltrates or potential pleural effusion. This diagnostic image serves as a classic representation of cardiogenic pulmonary edema for clinical educational purposes.
Heart Failure - Complete Overview
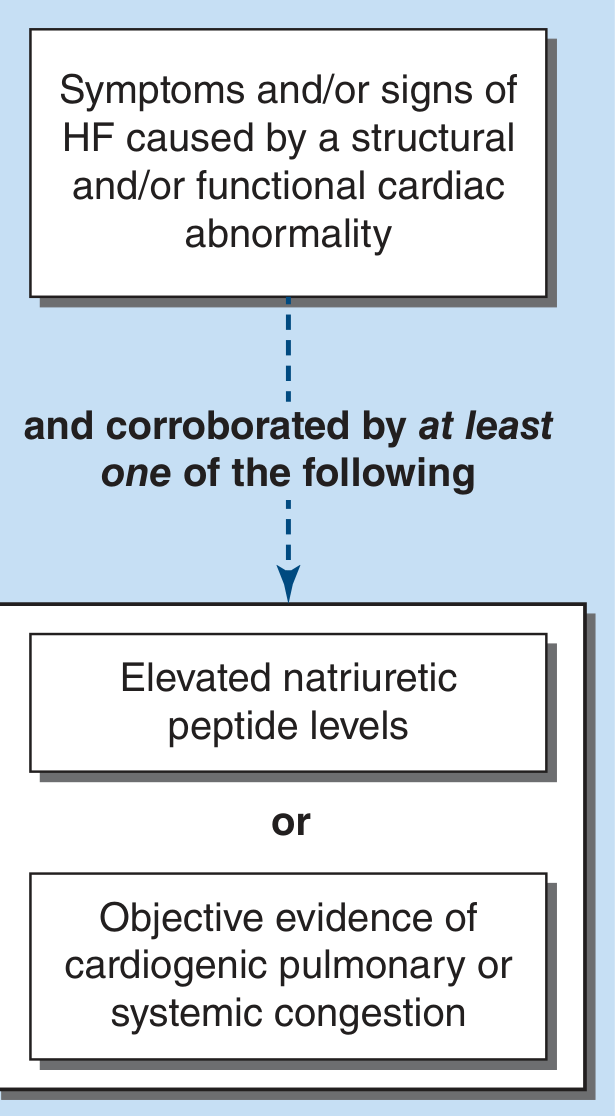
Universal Definition
- Elevated natriuretic peptide levels (BNP/NT-proBNP)
- Objective evidence of cardiogenic pulmonary or systemic congestion
Epidemiology
- ~6.7 million American adults are treated for HF; over 600,000 new cases per year
- Globally, an estimated 56.2 million people live with HF
- Prevalence: 1-2% in adults aged 40-49; >10% in those over 80
- Lifetime risk: ~24% (approximately 1 in 4 persons will develop HF)
- Leading cause of hospitalization in adults >65 years old
- HF is a major cause of morbidity and mortality worldwide - Harrison's, p. 2020
Classification by Ejection Fraction (EF)
| Type | EF | Description |
|---|---|---|
| HFrEF (Heart Failure with Reduced EF) | <40% | Systolic dysfunction; reduced pump function |
| HFmrEF (Mildly Reduced EF) | 40-49% | Intermediate; may have features of both |
| HFpEF (Preserved EF) | ≥50% | Diastolic dysfunction; stiff, non-compliant ventricle |
ACC/AHA Staging (A to D)
| Stage | Description | Examples |
|---|---|---|
| A | At risk - no structural disease, no symptoms | Hypertension, DM, obesity, family history |
| B | Pre-HF - structural disease, no symptoms | Asymptomatic LV dysfunction post-MI |
| C | Symptomatic HF - structural disease + symptoms | Dyspnea, fatigue, reduced exercise tolerance |
| D | Advanced/refractory HF - symptoms at rest despite optimal therapy | Requires LVAD, transplant, or palliative care |
- Goldman-Cecil Medicine, p. 477-478
NYHA Functional Classification
| Class | Description |
|---|---|
| I | No symptoms with ordinary activity |
| II | Mild symptoms with moderate exertion |
| III | Symptoms with minimal exertion, comfortable at rest |
| IV | Symptoms at rest or with any activity |
Pathophysiology
Overview Diagram
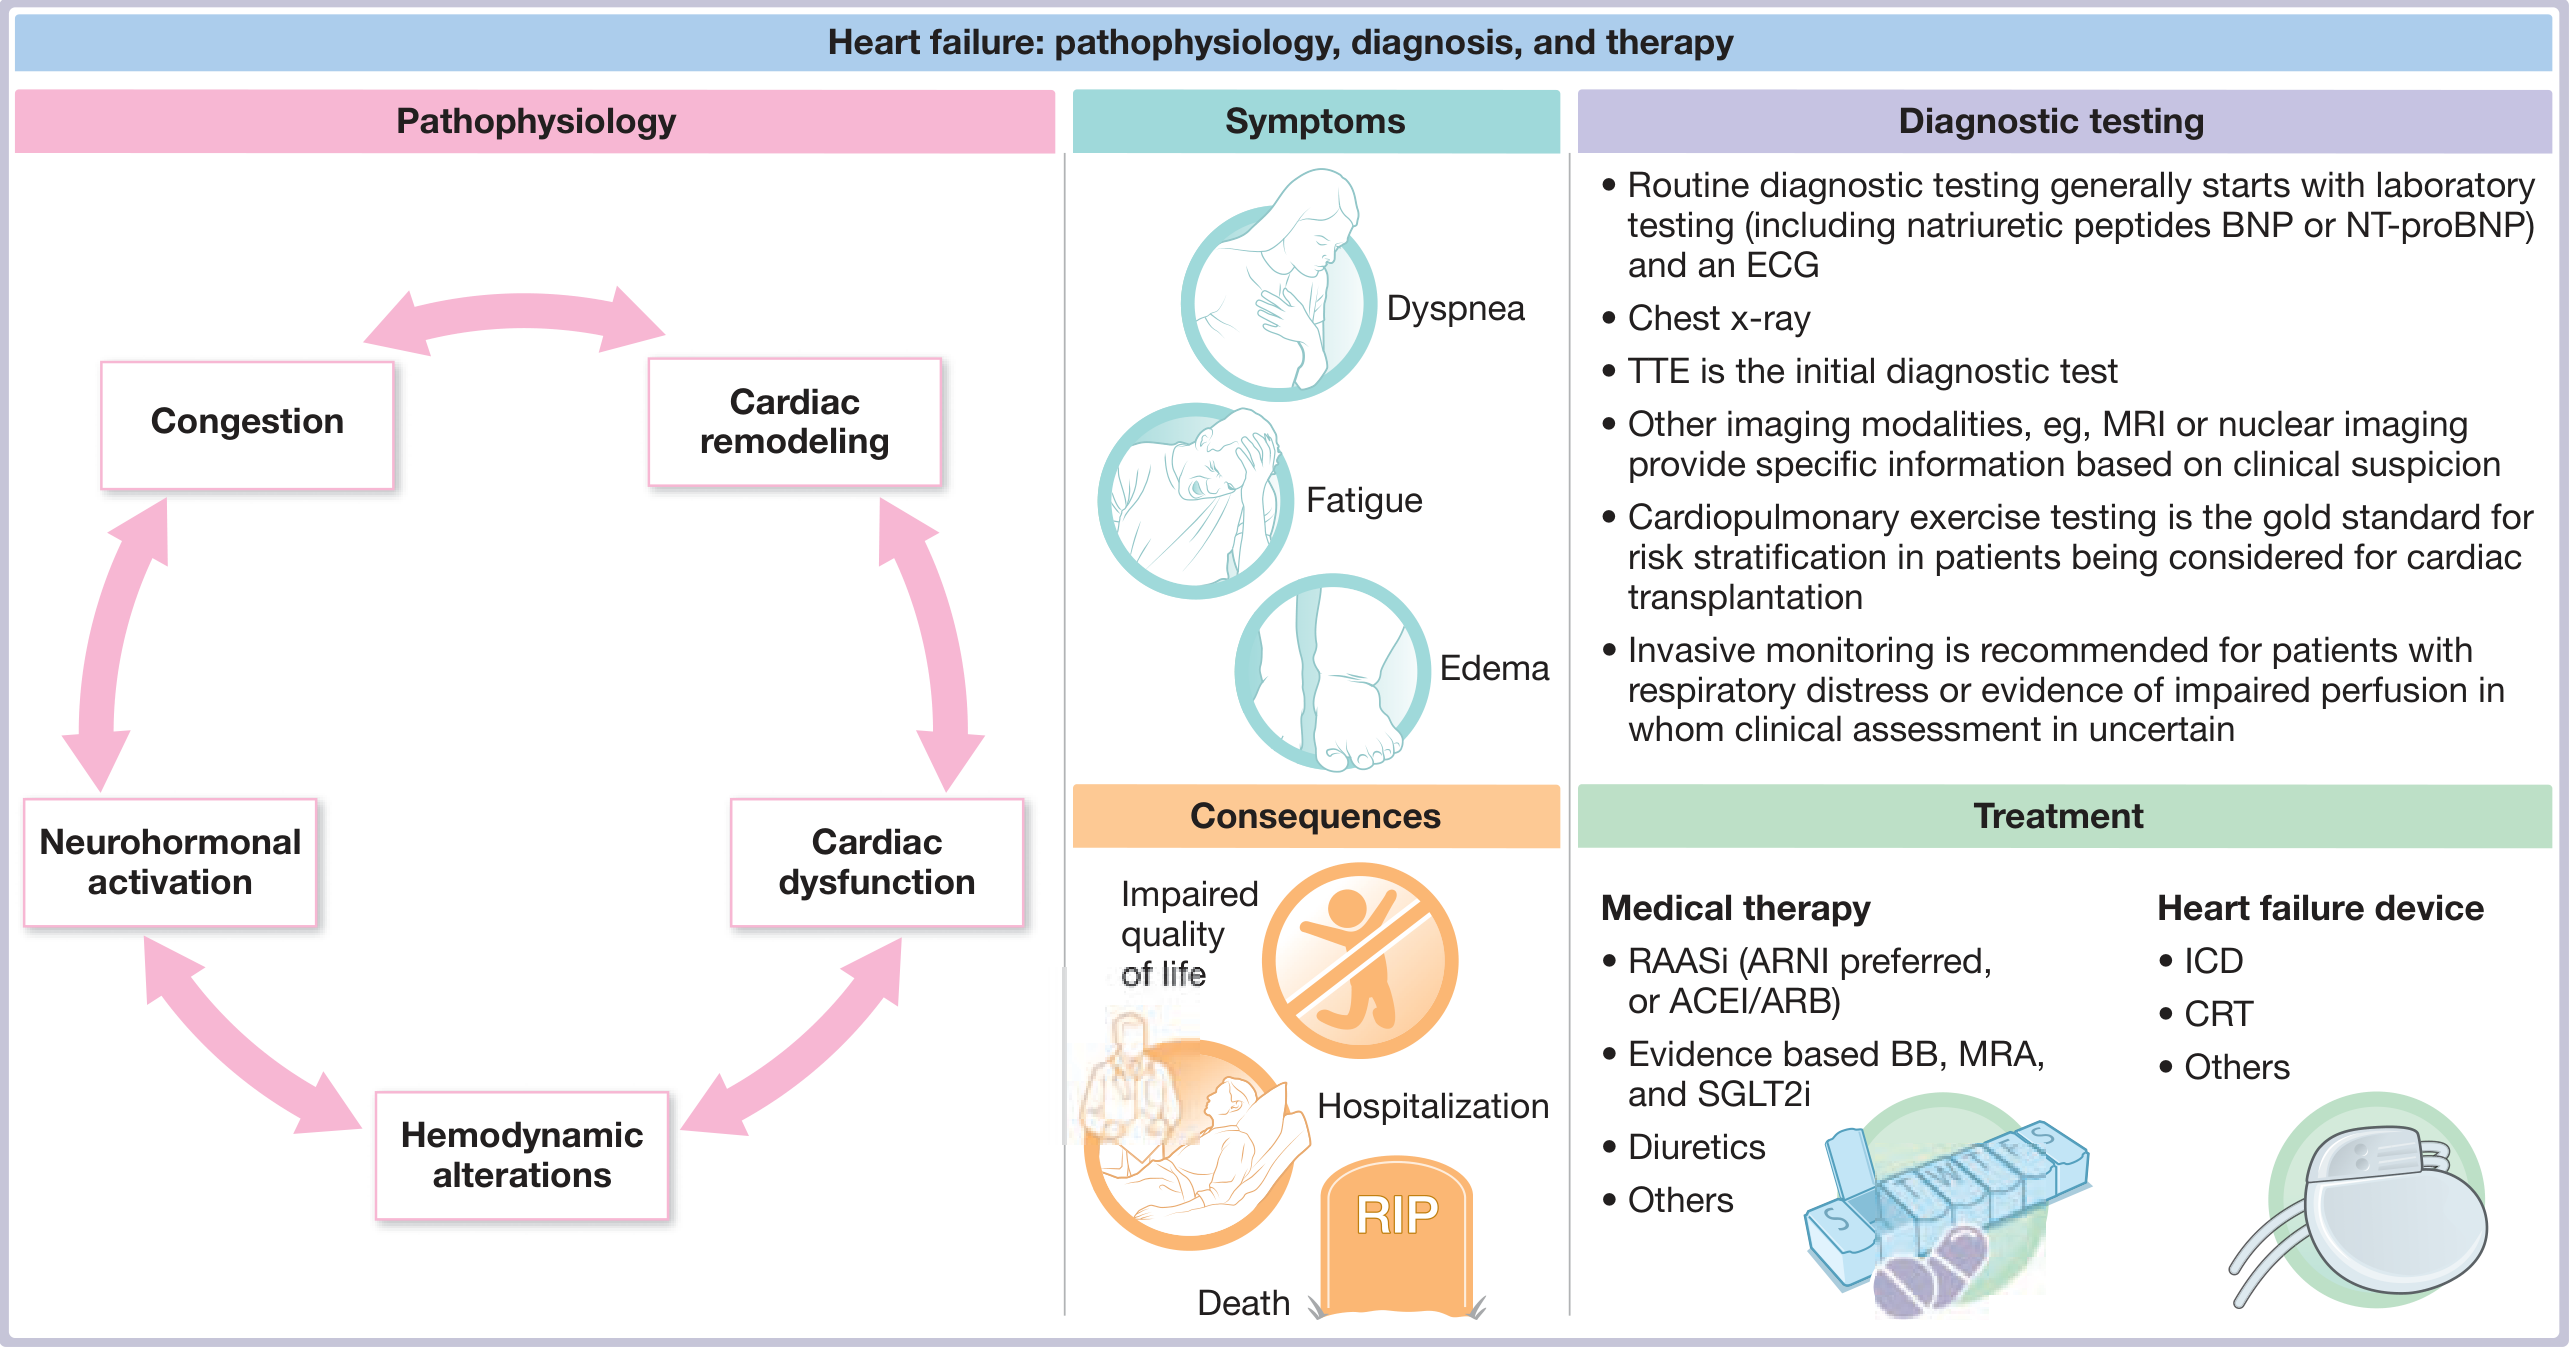
1. Hemodynamic Alterations
2. Neurohormonal Activation
- Sympathetic nervous system (SNS) - activated early, increases HR, BP, contractility. Chronically causes vasoconstriction, arrhythmias, and direct myocardial toxicity via catecholamines
- RAAS - renin-angiotensin-aldosterone system activation causes sodium and water retention, vasoconstriction, ventricular remodeling, and fibrosis
- ADH (vasopressin) - increased water retention, hyponatremia
- These initially compensatory responses ultimately become maladaptive and cause disease progression - Harrison's, p. 2022-2023
3. Ventricular Remodeling
- Abnormal excitation-contraction coupling
- Fetal gene re-expression (e.g., beta-myosin heavy chain)
- Beta-adrenergic receptor desensitization
- Myocyte hypertrophy and impaired cytoskeletal proteins
- Myocyte necrosis, apoptosis, and autophagy
- Interstitial and perivascular fibrosis
- Matrix metalloproteinase activation with matrix degradation
- Ventricular dilation and wall thinning
- Increased sphericity; displacement of papillary muscles
- Functional atrioventricular valve regurgitation (worsens MR)
4. Counterregulatory Hormones (Vasodilatory)
- Natriuretic peptides (ANP, BNP) - secreted in response to wall stress; promote natriuresis and vasodilation. These are used diagnostically (elevated in HF)
- Prostaglandins and bradykinin also oppose RAAS effects
5. HFpEF-Specific Pathophysiology
- Myocardial fibrosis
- Coronary microvascular dysfunction
- Low-grade inflammation (driven by obesity, DM, hypertension)
- Collagen cross-linking
- This leads to elevated filling pressures at rest or exercise, causing dyspnea despite normal EF
Common Causes (Etiology)
- Ischemic heart disease / MI (most common in developed world)
- Dilated cardiomyopathy (idiopathic, viral, alcoholic, familial)
- Hypertension (long-standing)
- Valvular heart disease (especially aortic stenosis, mitral regurgitation)
- Myocarditis
- Chemotherapy / cardiotoxic drugs (doxorubicin, trastuzumab)
- Arrhythmia-induced (tachycardia-mediated)
- Hypertension (most common cause)
- Hypertrophic cardiomyopathy
- Restrictive cardiomyopathy (amyloidosis, sarcoidosis, hemochromatosis)
- Constrictive pericarditis
Precipitating Factors for Decompensation
Clinical Features
Symptoms
- Dyspnea (exertional > orthopnea > PND - paroxysmal nocturnal dyspnea) - left HF
- Fatigue and reduced exercise tolerance
- Ankle edema / leg swelling - right HF
- Nocturia (recumbency improves renal perfusion, triggering diuresis overnight)
- Abdominal bloating, right upper quadrant discomfort (hepatic congestion)
- Cardiac cachexia in advanced HF (unintentional edema-free weight loss >5% over 12 months)
Signs
- Tachycardia
- Displaced apex beat (cardiomegaly)
- S3 gallop (ventricular gallop) - highly specific for HF; indicates rapid ventricular filling in dilated LV
- S4 gallop - indicates impaired relaxation (HFpEF, LVH)
- Fine bibasal crackles (pulmonary edema)
- Cardiac wheeze ("cardiac asthma")
- Raised JVP (jugular venous pressure)
- Hepatomegaly (tender); may progress to ascites
- Peripheral pitting edema (ankles, sacrum in bedridden)
- Hepatojugular reflux
- Right-sided S3
- Tricuspid regurgitation murmur
- Cheyne-Stokes respirations
- Cool peripheries, cyanosis, pallor
- Low pulse pressure; pulsus alternans (alternating strong/weak pulse)
- Cardiac cachexia, muscle wasting
Investigations
Biomarkers
- BNP >100 pg/mL or NT-proBNP >300 pg/mL - highly sensitive for HF
- BNP <35 pg/mL / NT-proBNP <125 pg/mL essentially rules out HF in outpatients
- Troponin - elevated in acute decompensation or myocarditis
- Newer markers: Galectin-3, soluble ST2 (for prognosis, less used clinically) - Harrison's, p. 2449
ECG
- May show LVH, Q waves (ischemia), LBBB (common in HFrEF), AF, prolonged QRS
- No finding is specific; normal ECG makes HF less likely
Chest X-Ray
- Cardiomegaly (cardiothoracic ratio >0.5)
- Pulmonary venous congestion: upper lobe diversion, Kerley B lines
- Interstitial or alveolar edema (bat-wing perihilar opacities)
- Pleural effusions (usually bilateral or right-sided)
Echocardiography
- EF measurement (HFrEF vs HFpEF vs HFmrEF)
- LV size, wall thickness, regional wall motion
- Diastolic function assessment (E/A ratio, tissue Doppler e')
- Valvular lesions
- Right heart assessment (RVSP, RV size)
- Pericardial disease
Additional Tests
- Cardiac MRI - gold standard for myocardial structure, function, fibrosis, infiltrative disease
- Coronary angiography - to exclude ischemic etiology
- Cardiopulmonary exercise test (CPET) - VO2 max; gold standard for HF severity and transplant listing (VO2 max <14 mL/kg/min indicates high-risk)
- Pulmonary artery catheter (Swan-Ganz) - in ICU for hemodynamic guidance; measures PCWP (elevated in left HF), CO
- Endomyocardial biopsy - for myocarditis, amyloidosis, rejection post-transplant
Management
Overview of the "Four Pillars" in HFrEF
| Pillar | Drug Class | Key Examples |
|---|---|---|
| 1 | ARNI (preferred) or ACEi/ARB | Sacubitril/valsartan; Ramipril, Lisinopril |
| 2 | Beta-blocker | Bisoprolol, Carvedilol, Metoprolol CR/XL |
| 3 | Mineralocorticoid Receptor Antagonist (MRA) | Spironolactone, Eplerenone |
| 4 | SGLT2 inhibitor | Dapagliflozin, Empagliflozin |
1. RAAS Inhibition
- Reduce mortality, hospitalizations, and improve NYHA class in all grades of symptomatic HF
- Also delay or prevent symptomatic HF in asymptomatic LV dysfunction (Stage B)
- Start low, titrate up; monitor K+ and creatinine
- Contraindications: History of angioedema, bilateral renal artery stenosis, K+ >5.0, creatinine ≥2.5 mg/dL
- Side effect: Dry cough in ~5% - switch to ARB
- Used when ACEi not tolerated (cough, angioedema)
- Similar efficacy; Candesartan reduces CV death + HF hospitalization
- Do NOT combine ACEi + ARB (increased toxicity without benefit) - Goldman-Cecil, p. 478
- Combines ARB (valsartan) + neprilysin inhibitor (sacubitril)
- Neprilysin degrades natriuretic peptides; inhibiting it augments BNP, vasodilation, natriuresis, and anti-fibrotic effects
- Now preferred as first-line over ACEi/ARB
- PARADIGM-HF trial: Sacubitril/valsartan reduced CV death and HF hospitalization vs enalapril by 20%
- Must wait 36 hours after last ACEi dose before starting (risk of angioedema)
- Target dose: 97/103 mg twice daily - Goldman-Cecil, p. 3247-3249
2. Beta-Blockers
| Drug | Starting Dose | Target Dose |
|---|---|---|
| Bisoprolol | 1.25 mg OD | 10 mg OD |
| Carvedilol | 3.125 mg BD | 25-50 mg BD |
| Metoprolol CR/XL | 12.5-25 mg OD | 200 mg OD |
| Nebivolol | 1.25 mg OD | 10 mg OD |
- Reduce mortality, hospitalizations, and improve symptoms when added to standard therapy
- Carvedilol is substantially more effective than short-acting metoprolol
- Start only in euvolemic (compensated) patients; do NOT initiate during acute decompensation
- Contraindications: asthma, 2nd/3rd degree AV block - Goldman-Cecil, p. 3140-3170
3. Mineralocorticoid Receptor Antagonists (MRA)
- Spironolactone and Eplerenone
- Block aldosterone-mediated sodium retention and fibrosis
- RALES trial: Spironolactone reduced mortality by 30% in class III-IV HFrEF
- Used in NYHA class II-IV; EF ≤35%
- Monitor K+ closely (risk of hyperkalemia, especially with ACEi/ARB)
- Eplerenone: more selective, less gynecomastia
4. SGLT2 Inhibitors
- Dapagliflozin (DAPA-HF) and Empagliflozin (EMPEROR-Reduced)
- Fourth pillar of HFrEF therapy; also benefit HFpEF (EMPEROR-Preserved, DELIVER trials)
- Reduce hospitalization for HF, CV death, and all-cause death when added to standard therapy
- Mechanisms in HF: osmotic diuresis, reduce cardiac preload/afterload, improve ketone metabolism, anti-fibrotic effects, weight loss
- Also reduce serum uric acid (beneficial in gout comorbidity)
- Preferred antidiabetic agents in HF patients with type 2 DM - Goldman-Cecil, p. 3460
5. Diuretics (Symptomatic Relief)
- Loop diuretics (furosemide, bumetanide, torsemide) - mainstay for congestion
- No proven mortality benefit, but essential for symptom control
- Thiazides can be combined for diuretic resistance
- Adjust dose based on daily weights, BP, and renal function
- IV furosemide in acute decompensation
6. Other Pharmacological Agents
- Sinus node If-channel blocker; reduces heart rate without affecting contractility
- Used in sinus rhythm, HR ≥70 bpm, despite maximally tolerated beta-blocker dose, NYHA II-III
- Reduces HF hospitalization
- For patients intolerant of both ACEi and ARB
- Proven mortality benefit specifically in Black patients (A-HeFT trial)
- Reduces afterload (hydralazine) and preload (nitrate)
- Weak positive inotrope; reduces hospitalizations (not mortality)
- Useful in HF + atrial fibrillation for rate control
- Narrow therapeutic window; risk of toxicity
- Soluble guanylate cyclase stimulator; for worsening HFrEF
- Reduces HF hospitalizations in high-risk patients
Device Therapy
- Indicated: EF ≤35%, NYHA II-III, on optimal medical therapy, life expectancy >1 year
- Prevents sudden cardiac death from ventricular arrhythmias
- Stage B: EF <30% post-MI also benefits
- Biventricular pacing for electro-mechanical dyssynchrony
- Indicated: LBBB + QRS ≥150 ms + EF ≤35% + NYHA II-IV
- Reverses adverse remodeling (improves EF), reduces hospitalizations and mortality
- Mechanical pump for Stage D (refractory) HF
- Used as: Bridge to transplantation, destination therapy, or bridge to recovery
- HeartMate and HVAD devices; modern continuous-flow LVADs have improved survival
Advanced / Stage D Therapies
- Heart Transplantation - gold standard for end-stage HF
- Indications: VO2 max <14 mL/kg/min, NYHA IV despite optimal therapy
- 1-year survival ~85%, 5-year ~70%
- Limited by donor availability; contraindications include irreversible pulmonary hypertension, malignancy, significant comorbidities
- Chronic IV inotropes (dobutamine, milrinone) - palliative use
- Palliative care / hospice - for those not transplant candidates
HFpEF Management
- SGLT2 inhibitors (dapagliflozin: DELIVER trial; empagliflozin: EMPEROR-Preserved) - now recommended
- Spironolactone (TOPCAT trial: modest benefit, especially in Americas subgroup)
- Sacubitril/valsartan - PARAGON-HF showed marginal benefit, especially in women
- Main treatment: aggressive risk factor control - hypertension (systolic <130 mmHg), AF rate/rhythm control, weight loss, diuretics for symptom relief
Comorbidities
Prognosis
- 1-year mortality after first hospitalization: ~20-30%
- 5-year mortality after diagnosis: ~50%
- Worse prognosis with: lower EF, higher NYHA class, lower Na+ (hyponatremia), elevated BNP/troponin, low VO2 max, renal dysfunction, right ventricular dysfunction, cardiac cachexia
Acute Heart Failure (Decompensated)
- Wet vs Dry (congestion) - elevated JVP, crackles, edema
- Cold vs Warm (perfusion) - cool peripheries, low BP, oliguria
| Profile | Treatment Strategy |
|---|---|
| Wet + Warm | Diuretics, vasodilators |
| Wet + Cold | Diuretics + inotropes; consider mechanical support |
| Dry + Cold | Volume challenge; inotropes |
| Dry + Warm | Optimize oral therapy |
- IV loop diuretics (furosemide IV) - first-line for congestion
- Oxygen (maintain SpO2 >94%); consider CPAP/BiPAP for pulmonary edema
- IV vasodilators (nitrates, nitroprusside) - reduce preload/afterload in normotensive/hypertensive patients
- Inotropes (dobutamine, dopamine) - for low-output/cardiogenic shock
- Vasopressors (norepinephrine) - in cardiogenic shock with hypotension
- Treat triggering arrhythmias (e.g., cardioversion for AF with rapid ventricular rate)
- Mechanical support: IABP (intra-aortic balloon pump), Impella, or VA-ECMO in cardiogenic shock
Key Drug Dose Summary (HFrEF)
| Drug | Start | Target |
|---|---|---|
| Sacubitril/valsartan | 24/26 mg BD | 97/103 mg BD |
| Enalapril | 2.5 mg BD | 10-20 mg BD |
| Ramipril | 1.25-2.5 mg OD | 10 mg OD |
| Bisoprolol | 1.25 mg OD | 10 mg OD |
| Carvedilol | 3.125 mg BD | 25-50 mg BD |
| Spironolactone | 25 mg OD | 50 mg OD |
| Dapagliflozin | 10 mg OD | 10 mg OD |
| Empagliflozin | 10 mg OD | 10 mg OD |
Prevention (Stage A)
- Control hypertension (target <130/80 mmHg)
- Treat atherosclerotic risk factors (statins, aspirin)
- Diabetes management (SGLT2 inhibitors protect against HF development)
- Smoking cessation, weight control, Mediterranean diet, regular aerobic exercise
- Avoid cardiotoxic drugs when possible; cardioprotection during chemotherapy (dexrazoxane, SGLT2i)
- Screen with natriuretic peptides in high-risk asymptomatic individuals - Goldman-Cecil, p. 2936