
Coagulase and methyl red test
coagulase test tube slide Staphylococcus aureus
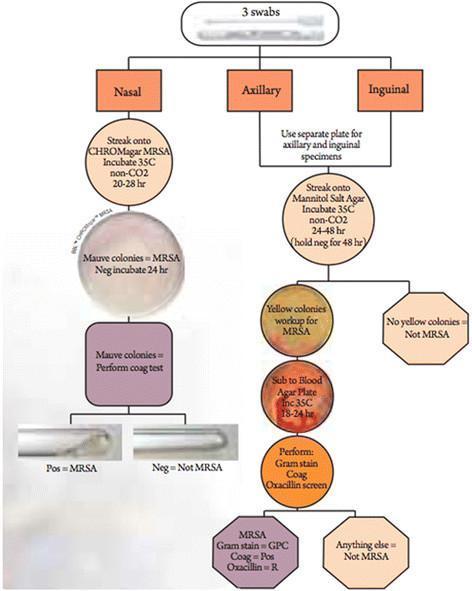
A clinical microbiology flowchart detailing the systematic isolation and identification of Methicillin-resistant Staphylococcus aureus (MRSA) from three anatomical sites: nasal, axillary, and inguinal. The nasal pathway utilizes CHROMagar MRSA, where mauve colonies indicate presumptive MRSA, followed by a confirmatory coagulase plasma test shown in test tubes. The axillary and inguinal pathways use Mannitol Salt Agar (MSA) for initial screening. Yellow colonies on MSA (indicating mannitol fermentation) are subcultured onto Blood Agar Plates for 18-24 hours. Final identification of MRSA requires a battery of tests confirming Gram-positive cocci (GPC) morphology, positive coagulase production, and oxacillin resistance via screening agar. The diagram incorporates photographs of culture plates and biochemical test results to illustrate the diagnostic criteria. This algorithm is designed for laboratory medicine and infectious disease training to demonstrate standard microbial culture protocols and differential media selection based on sample source.
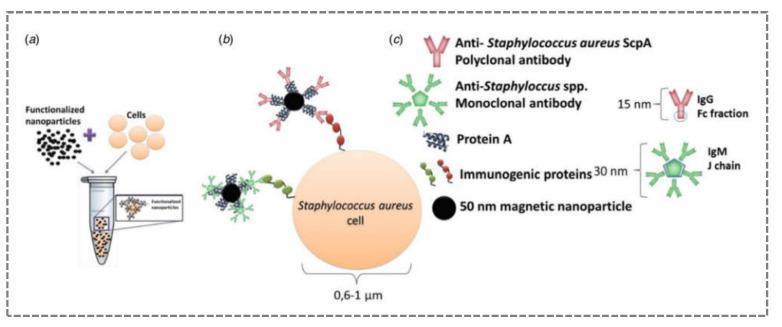
This medical diagram illustrates the immunomagnetic detection and capture of Staphylococcus aureus cells using functionalized magnetic nanoparticles (MNPs). The process is divided into three stages: (a) incubation of functionalized 50 nm magnetic nanoparticles with bacterial cells (0.6-1.0 µm) in a microcentrifuge tube; (b) the binding mechanism between MNPs and the bacterial cell wall via specific biological affinities; and (c) a detailed legend of the molecular components involved. The binding is mediated by two types of antibodies: anti-S. aureus ScpA polyclonal antibodies (represented as 15 nm Y-shaped IgG Fc fractions) and anti-Staphylococcus spp. monoclonal antibodies (represented as star-shaped IgM J chains). Additionally, the diagram highlights the role of Protein A and 30 nm immunogenic proteins on the cell surface. This methodology is utilized in clinical diagnostic biosensors for rapid pathogen identification, leveraging high-affinity antibody-antigen interactions to isolate specific bacteria from complex samples for quantification and analysis.
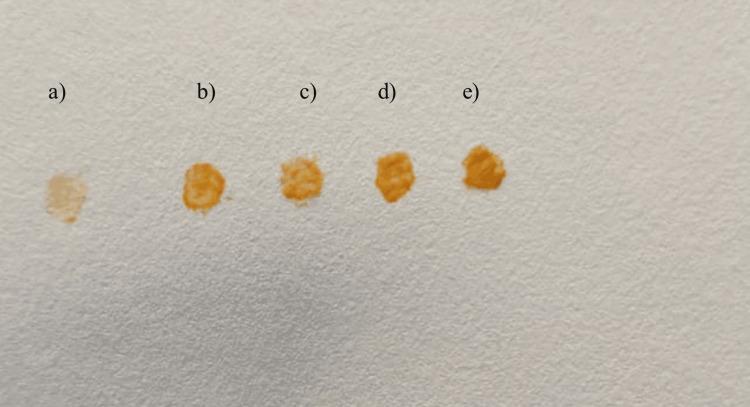
This Comparison Chart illustrates the results of a filter paper test used to evaluate the intensity of staphyloxanthin pigment production by Staphylococcus aureus clinical isolates across five different growth media. The image displays five distinct pigmented spots labeled (a) through (e) on a white filter paper background. From left to right, the spots correspond to cultures grown on: (a) Nutrient agar, (b) Milk agar, (c) Carrot agar, (d) Beetroot with carrot agar, and (e) Beetroot agar. A clear progression in color intensity and hue is visible, shifting from a very pale, translucent tan in spot (a) to a deeply saturated orange-gold in spot (e). The visual evidence demonstrates that beetroot-supplemented media (d and e) promotes the highest levels of staphyloxanthin expression, a key virulence factor in S. aureus. This diagnostic comparison is used in microbiology and clinical pathology research to study the influence of nutritional components on bacterial phenotypic characteristics and biosynthetic pathways.
methyl red test MR VP positive negative Enterobacteriaceae
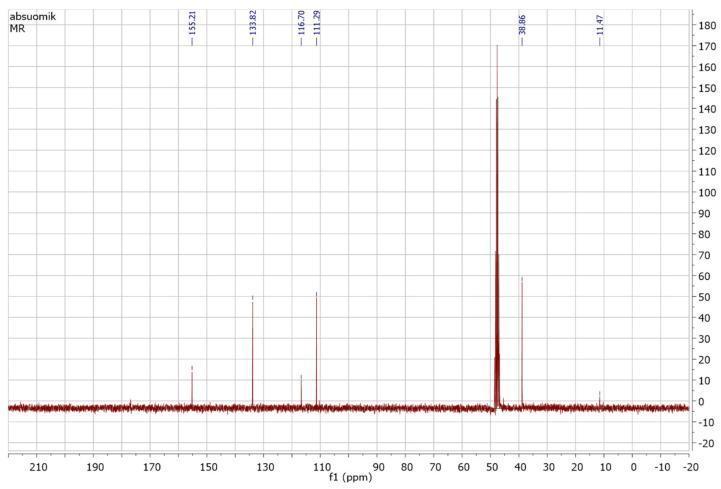
This diagnostic image shows a Carbon-13 Nuclear Magnetic Resonance (13C NMR) spectrum of methyl red dye, a common indicator used in microbiology for the MR-VP (Methyl Red and Voges-Proskauer) tests to detect bacterial mixed-acid fermentation. The spectrum is plotted on a grid where the x-axis represents the chemical shift (f1) in parts per million (ppm), ranging from -20 to 210, and the y-axis indicates signal intensity ranging from -20 to 180. Key characteristic signals are observed as vertical peaks at specific chemical shifts: 155.21 ppm (likely representing the carboxylic acid or azo-related aromatic carbons), a cluster of aromatic signals between 111.29 and 133.82 ppm, and the most prominent peak at 38.86 ppm. An additional signal is noted at 11.47 ppm. This spectroscopic data serves as a reference for the chemical structure of the dye before its biodegradation by organisms such as Pseudomonas aeruginosa. This material is relevant for advanced medical microbiology and biochemistry studies focusing on bacterial metabolism, enzyme activity (e.g., azoreductase), and the chemical analysis of metabolic byproducts.
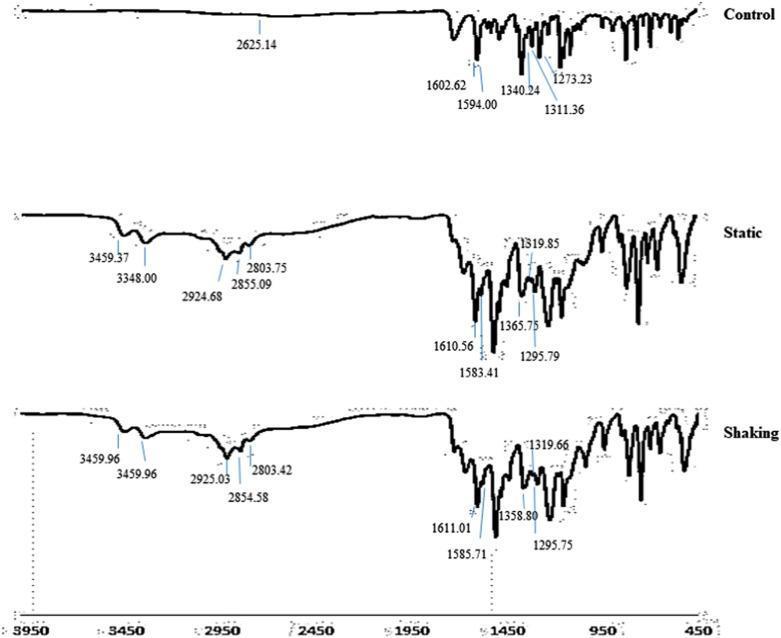
This Comparison Chart displays three Fourier Transform Infrared (FTIR) spectra illustrating the biodegradation of Methyl Red (MR) by the bacterium Lysinibacillus fusiformis strain W1B6. The x-axis represents the wavenumber (cm-1) ranging from 3950 to 450, and the y-axis shows transmittance/intensity. The top spectrum (Control) represents pure Methyl Red, showing characteristic peaks at 2625.14, 1602.62, and 1273.23 cm-1. The middle (Static) and bottom (Shaking) spectra show the chemical transformation under different culture conditions. Significant changes include the emergence of new bands between 3459 and 3348 cm-1, corresponding to primary amine (NH2) stretching resulting from the reductive cleavage of the azo bond (-N=N-). Additional new peaks at approximately 2925, 2855, and shifts in the 1610-1580 cm-1 region indicate the formation of metabolites like 2-aminobenzoic acid (2-ABA) and N,N-dimethyl-p-phenylenediamine (DMPD). This diagnostic comparison is used in medical and environmental biotechnology to characterize microbial bioremediation and enzymatic degradation pathways.
![Multi-panel figure demonstrating preclinical diagnostic imaging using a hen’s egg test–chorioallantoic membrane (HET-CAM) xenograft model for prostate cancer research. The figure is organized into four cases (a–d), each containing T2-weighted magnetic resonance (MR) images (left), [68Ga]Ga-PSMA-11 PET/MR fusion images (middle), and time–activity curves (right). The MR images highlight tumor xenografts: green arrows indicate PSMA-positive tumors (LNCaP C4-2 or LNCaP) showing clear morphology, while red arrows indicate PSMA-negative control tumors (PC-3). White arrows point to the chorioallantoic membrane (CAM). PET/MR fusion images demonstrate target-specific radiotracer accumulation, characterized by high-intensity signal (red/yellow) in PSMA-positive tumors compared to minimal, background-level accumulation in PSMA-negative tumors. Accompanying graphs quantify this via Mean Activity Concentration (Bq/cc) over time, showing consistently higher uptake in the PSMA-positive regions of interest. This illustrates the utility of the HET-CAM model for longitudinal molecular imaging and evaluation of PSMA-targeted tracers in oncology.](https://cdn.orris.care/cdss_images/pmc_clinical_VQA_f65a98efad30f89f3cd7e2e8db8246a11d9ed4a57b9bf943eefc0d1da84452d6.jpg)
Multi-panel figure demonstrating preclinical diagnostic imaging using a hen’s egg test–chorioallantoic membrane (HET-CAM) xenograft model for prostate cancer research. The figure is organized into four cases (a–d), each containing T2-weighted magnetic resonance (MR) images (left), [68Ga]Ga-PSMA-11 PET/MR fusion images (middle), and time–activity curves (right). The MR images highlight tumor xenografts: green arrows indicate PSMA-positive tumors (LNCaP C4-2 or LNCaP) showing clear morphology, while red arrows indicate PSMA-negative control tumors (PC-3). White arrows point to the chorioallantoic membrane (CAM). PET/MR fusion images demonstrate target-specific radiotracer accumulation, characterized by high-intensity signal (red/yellow) in PSMA-positive tumors compared to minimal, background-level accumulation in PSMA-negative tumors. Accompanying graphs quantify this via Mean Activity Concentration (Bq/cc) over time, showing consistently higher uptake in the PSMA-positive regions of interest. This illustrates the utility of the HET-CAM model for longitudinal molecular imaging and evaluation of PSMA-targeted tracers in oncology.
Coagulase Test and Methyl Red (MR) Test
COAGULASE TEST
What is Coagulase?
| Form | Name | What it Does |
|---|---|---|
| Bound coagulase | Clumping factor | Cell-wall associated; directly agglutinates bacteria |
| Free coagulase | True coagulase | Released into medium; binds a serum factor and converts fibrinogen to fibrin |
Purpose
Two Methods
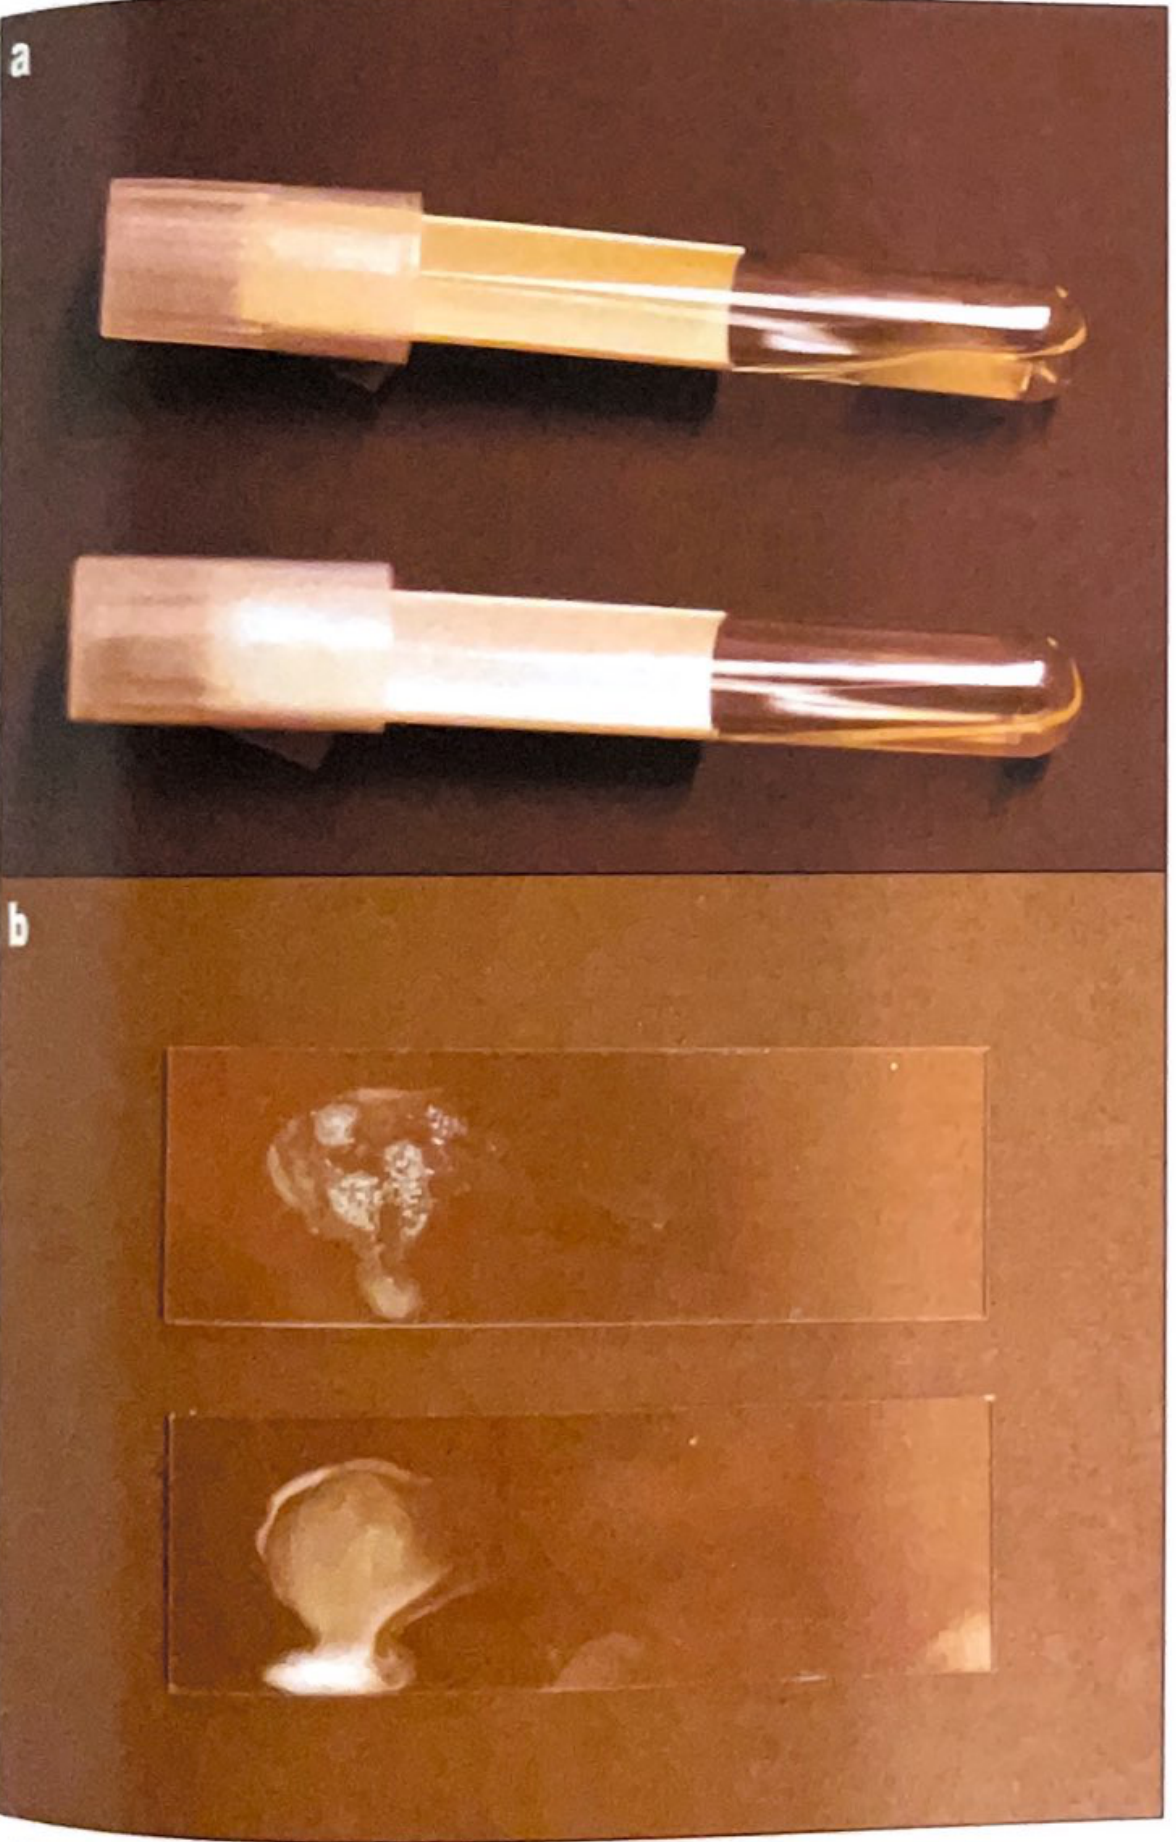
1. Slide Coagulase Test (detects bound coagulase)
- Method: A dense emulsion of the organism is mixed with rabbit/human plasma on a glass slide
- Reading: Positive if clumping (agglutination) occurs within 30 seconds to 2 minutes
- Advantages: Rapid; useful as a screening test
- Limitations: Requires confirmation by tube test; false positives can occur due to autoagglutination (always run a saline control)
- Pitfall: S. lugdunensis and S. schleiferi may also give a positive slide coagulase test
2. Tube Coagulase Test (detects free coagulase)
- Method: Several colonies are emulsified in 0.5 mL rabbit plasma with EDTA and incubated at 35°C
- Reading: Examined at 4 hours and 24 hours for clot formation; positive = clot formation
- Why check at both times?: Most S. aureus clot within 4 hours. Some strains produce fibrinolysin that can lyse the clot at 24 hours, giving a false-negative if only read at 24h
- Gold standard: Detects nearly 100% of S. aureus isolates
- Also positive with S. intermedius and S. hyicus, but these are primarily animal pathogens
Organisms and Coagulase Status
| Result | Organisms |
|---|---|
| Coagulase-positive | S. aureus, S. intermedius, S. hyicus (rare in humans) |
| Slide positive, tube negative | S. lugdunensis |
| Coagulase-negative | S. epidermidis, S. saprophyticus, S. haemolyticus, most other CoNS |
Commercial latex agglutination kits can also detect protein A and clumping factor and are widely used for rapid S. aureus identification.
- Henry's Clinical Diagnosis and Management by Laboratory Methods, p. 178-184
- Tietz Textbook of Laboratory Medicine 7th Ed, Table 84.4
METHYL RED (MR) TEST
Principle
Method
- Inoculate the organism into MR-VP broth (glucose phosphate broth)
- Incubate at 35°C for 48-72 hours (must be fully incubated - early reading gives false positives)
- Add a few drops of methyl red indicator
- Positive: Distinct red color (pH ≤ 4.4) - large amounts of stable acid produced
- Negative: Yellow/orange color (pH ≥ 6.0) - acids neutralized or not produced
Results by Organism
| MR Result | Organisms |
|---|---|
| Positive (red) | Escherichia coli, Salmonella, Shigella, Yersinia, Proteus |
| Negative (yellow) | Klebsiella pneumoniae, Enterobacter, Serratia, Hafnia, Pantoea |
MR-VP Relationship (Complementary Tests)
| Test | Detects | E. coli | Klebsiella/Enterobacter |
|---|---|---|---|
| MR | Mixed acid fermentation | + (red) | - (yellow) |
| VP | Acetoin (butanediol pathway) | - | + |
- These two tests are almost always inversely related - organisms that are MR+ tend to be VP-, and vice versa
- The Voges-Proskauer test detects acetylmethylcarbinol (acetoin), an intermediate in the butene glycol pathway of glucose fermentation (Sherris & Ryan's Medical Microbiology 8th ed.; Jawetz, Melnick & Adelberg's Medical Microbiology 28th ed.)
Quick Summary Table
| Feature | Coagulase Test | Methyl Red Test |
|---|---|---|
| Purpose | ID S. aureus | Distinguish E. coli from Klebsiella/Enterobacter |
| Organism group | Gram-positive cocci (Staphylococci) | Gram-negative rods (Enterobacteriaceae) |
| Detects | Coagulase enzyme (clots plasma) | Stable mixed acid production from glucose |
| Positive indicator | Clot (tube) / Clumping (slide) | Red color (methyl red indicator) |
| Positive organisms | S. aureus | E. coli, Salmonella, Shigella, Proteus |
| Negative organisms | CoNS (S. epidermidis) | Klebsiella, Enterobacter, Serratia |
| Timing | 30 sec (slide), 4 & 24 hr (tube) | 48-72 hours |