
ventricular tachycardia ECG wide QRS tachycardia 12-lead
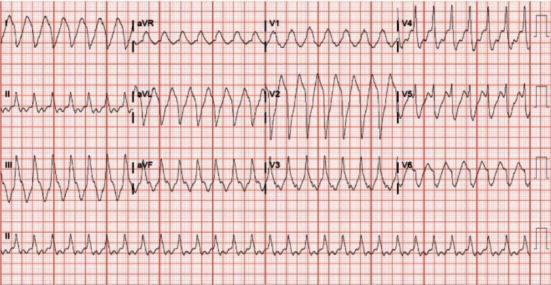
A 12-lead electrocardiogram (ECG) demonstrating a regular, wide-complex tachycardia. The ventricular rate is approximately 170-174 beats per minute with a significantly prolonged QRS duration of approximately 270 ms. The rhythm is monomorphic, showing consistent QRS morphology across all leads. Distinct P waves are not clearly visible, appearing to be obscured by the wide QRS complexes or the subsequent T waves. The tracing shows a classic 'sine-wave' or slurred appearance in several leads, particularly the precordial leads V2-V4, which is characteristic of severe QRS widening. The clinical context suggests a differential diagnosis including ventricular tachycardia, supraventricular tachycardia with aberrancy (bundle branch block), or toxicological effects causing slowed intraventricular conduction, such as flecainide toxicity. The image serves as a key educational example for identifying wide-complex tachycardias and assessing QRS morphology and intervals in an acute cardiology or emergency medicine setting.
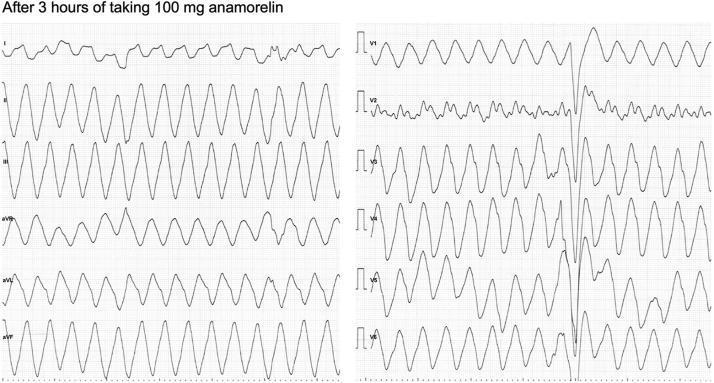
A 12-lead electrocardiogram (ECG) demonstrating a wide-complex tachycardia consistent with monomorphic ventricular tachycardia (VT). The recording shows a regular, rapid ventricular rate of approximately 202 beats per minute. Key diagnostic features include markedly prolonged QRS complexes (measured at 280 ms), indicative of significantly delayed ventricular depolarization. In most leads, including limb leads (I, II, III, aVR, aVL, aVF) and precordial leads (V1, V3-V6), the QRS morphology is uniform and repetitive with a characteristic 'sine-wave' appearance in certain leads. Lead V2 shows lower voltage or less discernible complexes compared to the others. There is a complete absence of preceding P waves, confirming a non-sinus origin of the rhythm. The clinical significance of this ECG relates to drug-induced sodium channel blockade (anamorelin toxicity), causing life-threatening ventricular arrhythmia and hemodynamic instability. The visual data is essential for medical education regarding wide QRS tachycardia differential diagnosis and the recognition of drug-related cardiotoxicity.
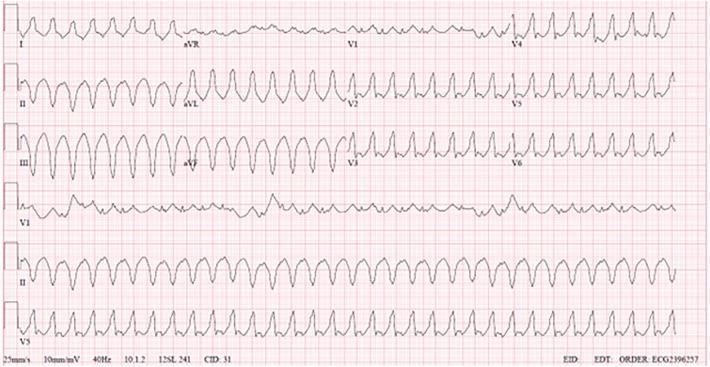
This diagnostic image is a 12-lead electrocardiogram (ECG) demonstrating a wide-complex tachycardia consistent with monomorphic ventricular tachycardia (VT). The tracing shows high-amplitude, wide QRS complexes with a rapid, regular rhythm. Key features include a superior axis (negative QRS in leads II, III, and aVF) and positive concordance across the precordial leads (V1-V6), where the QRS complexes are predominantly positive and uniform in morphology. The complexes exhibit a notched, somewhat sinusoidal appearance with prolonged ventricular depolarization time. Leads I, aVR, and V1 show an unstable baseline with erratic electrical activity and reduced signal amplitude, possibly indicating lead interference or specific conduction patterns in this clinical scenario. The ECG lacks visible P waves preceding the QRS complexes, and the overall morphology is indicative of an ectopic ventricular origin, often associated with structural heart disease such as dilated cardiomyopathy or post-surgical scars.
ECG Report - Krrishan Gopal Sharma | Age: 63 | HDU | 25-07-2025
Recorded Parameters (from the printout)
| Parameter | Value |
|---|---|
| Heart Rate | 156 bpm |
| P interval | 91 ms |
| PR (P-Q) | 109 ms |
| QRS | 88 ms |
| QT/QTc | 297/465 ms |
| P/QRS/T axis | 90°/23°/123° |
| RV5/SV1 | 0.648/0.623 mV |
| RV5+SV1 | 1.271 mV |
Rhythm Analysis
Key Findings
- The rate of 156 bpm places this in the range of supraventricular tachycardia (SVT), atrial flutter with 2:1 block, sinus tachycardia, or atrial tachycardia. At exactly 150 bpm (±10), atrial flutter with 2:1 AV conduction must be the first consideration - a rate of 156 is highly classic for this.
- QRS of 88 ms is borderline - may reflect slight intraventricular conduction delay or rate-related aberrancy
- The mean QRS axis is +23° (normal)
- The QTc is borderline prolonged (normal <440 ms in men, <460 ms in women). At this heart rate, a QTc of 465 ms needs monitoring.
- The PR interval is noted as 109 ms (very short-normal range). In a tachycardia at 156 bpm, identifying discrete P waves vs flutter waves is critical. At this rate, flutter waves (saw-tooth pattern at ~300/min with 2:1 block giving a ventricular rate of ~150) are a top differential.
- QRS axis +23° (normal)
- T wave axis +123° - this represents a T wave axis discordant from QRS axis by ~100°, suggesting T wave abnormality / repolarization changes
Differential Diagnosis for This Tachycardia
| Diagnosis | Key Supporting Feature |
|---|---|
| Atrial flutter with 2:1 block | Rate ~150 bpm, regular, saw-tooth flutter waves in inferior leads |
| Sinus tachycardia | P waves visible before each QRS, clinical cause (fever, pain, hypovolemia) |
| Atrial tachycardia | Abnormal P wave morphology, rate 150-250 |
| AVNRT/AVRT | Abrupt onset/offset, P waves buried in or just after QRS |
| Junctional tachycardia | No clear P waves or retrograde P waves |
Repolarization Concerns
- The QTc of 465 ms is borderline prolonged - important if this patient is on QT-prolonging drugs (amiodarone, sotalol, quinolones, antipsychotics)
- The T-wave axis discordance (+123° vs QRS +23°) may indicate ST-T wave changes consistent with ischemia, strain, or the tachycardia itself
Clinical Impression
Regular tachycardia at 156 bpm, most consistent with atrial flutter (2:1 AV conduction) or SVT. Borderline prolonged QTc at 465 ms. T-wave axis abnormality. Patient is in HDU - urgent clinical correlation required.
Recommended Actions (for the treating physician)
- Vagal maneuvers or IV adenosine - will transiently block the AV node; if atrial flutter, will briefly expose the flutter waves; if AVNRT/AVRT, may terminate it
- Check electrolytes - K⁺, Mg²⁺ (especially relevant given borderline QTc)
- Review medications - any QT-prolonging agents?
- Assess hemodynamics - if unstable, synchronized DC cardioversion
- If flutter is confirmed: rate control (beta-blocker, calcium channel blocker, or digoxin), anticoagulation assessment (CHA₂DS₂-VASc score), and consideration of cardioversion or ablation