
/handwritten notes for thyroid tumors crisp for fmge
thyroid cancer papillary follicular medullary histology
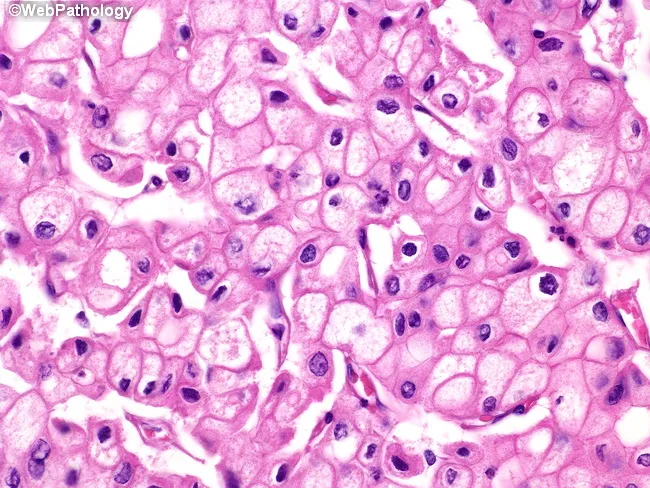
This is a histopathology slide of thyroid tissue prepared by hematoxylin and eosin staining, examined under brightfield light microscopy at high magnification. The specimen demonstrates epithelial neoplasm consistent with papillary thyroid carcinoma (PTC). The neoplastic cells are arranged in sheets and, where present, papillary fronds with fibrovascular cores are recognizable. The predominant cytoplasm is finely reticular and eosinophilic, with blander nuclear features. The nuclei show characteristic raisinoid appearance with nuclear grooves, giving an Orphan Annie eye look; the nuclear membranes are distinct and often thickened. Perinuclear halos, i.e., clear nuclear clearing around the chromatin, are evident. Some tumor cells exhibit voluminous cytoplasm, and in the plane of section, nuclei may be absent in those cells, a phenomenon of sectioning rather than true anuclear cells. The cytoplasmic clearing and grooves are diagnostic, aiding differentiation from benign nodules. The histology carries diagnostic significance, with PTC carrying generally favorable prognosis but potential for lymphatic metastasis; differential includes follicular carcinoma, medullary carcinoma, Hashimoto-related changes, and benign adenomas. Clinically, presence of these features correlates with occult metastasis risk and guides surgical planning, post-operative radioiodine therapy considerations, and molecular testing (e.g., BRAF V600E). This image is relevant for medical education, pathology teaching files, digital atlases, and research on thyroid cancer morphology.
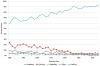
This line graph illustrates the epidemiological trends in the distribution of thyroid cancer cases by histological type from 1980 to 2012. The data, expressed as a percentage of all thyroid cancer cases, shows a prominent increase in papillary carcinoma, which rose from approximately 60% in 1980 to over 90% by 2012. Conversely, other histological subtypes show a steady decline in relative proportion over the same period. Follicular carcinoma, which initially accounted for nearly 25% of cases, decreased significantly. Medullary and anaplastic carcinomas, along with a category labeled as 'others,' remained at low percentages and trended downward toward the end of the study period. This visualization emphasizes the shifting landscape of thyroid pathology, highlighting the increasing dominance of papillary carcinoma in clinical diagnosis and incidence relative to non-papillary types. The graph serves as an educational resource for oncology and endocrinology, illustrating longitudinal changes in cancer subtypes within a specific population context.
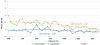
This line graph illustrates a joinpoint analysis of time trends for the age-standardized incidence of non-papillary thyroid cancer (including follicular, medullary, and anaplastic histological types) in Israel from 1980 to 2012. The data is stratified by gender within the Jewish population. The y-axis represents the rate per 100,000, while the x-axis denotes the calendar years. The visual demonstrates a statistically significant downward trend in the incidence for both Jewish women and Jewish men over the 32-year period. Jewish women (indicated by the upper green line) started with a higher incidence rate in 1980 compared to Jewish men (indicated by the lower blue line). Both groups show fluctuations year-over-year but exhibit a clear overall decline, with incidence rates narrowing and approaching lower, more similar values by 2012. This epidemiological data highlights shifting patterns in thyroid cancer pathology, contrasting the decreasing incidence of non-papillary types with the concurrent rise of papillary carcinoma observed in the same period.
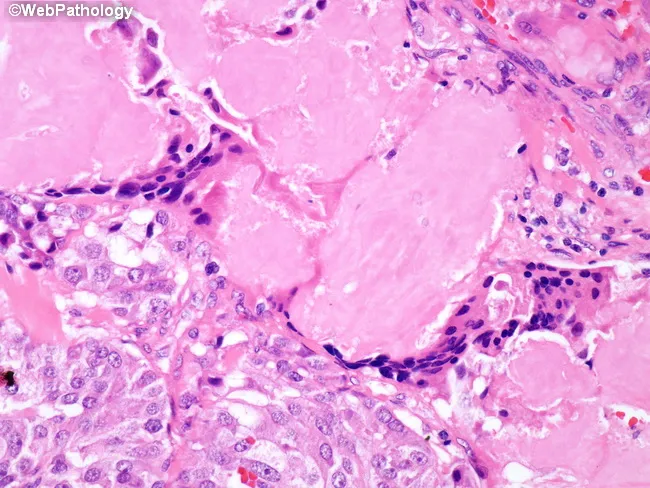
Histology image obtained from thyroid tissue showing medullary thyroid carcinoma with extracellular amyloid deposits in the tumor stroma and a foreign body-type giant cell reaction surrounding the amyloid. The slide is a paraffin-embedded tissue section stained with Hematoxylin and Eosin, visualized under light microscopy. The malignant parafollicular C-cells form nests and sheets with uniform, round to polygonal cells and granular cytoplasm, displaying salt-and-pepper nuclear characteristics. A conspicuous, pink, amorphous extracellular matrix represents calcitonin-derived amyloid within and around tumor nests; multinucleated giant cells and macrophages are present at the periphery, reflecting a foreign body-type granulomatous response to amyloid deposition. Congo red staining (not shown here) would typically reveal apple-green birefringence under polarized light, confirming amyloid. This histology is characteristic of medullary thyroid carcinoma (MTC) and helps distinguish it from papillary, follicular, or anaplastic thyroid cancers. Diagnostic significance rests on the co-occurrence of C-cell neoplasia and amyloid, a hallmark of MTC, with possible associations to calcitonin gene-related peptide and RET oncogene alterations. Clinically, MTC presents with a neck mass and elevated serum calcitonin and CEA; amyloid-rich stroma reflects tumor biology and has prognostic implications. The image supports educational and diagnostic use in pathology, endocrine oncology, and medical education.
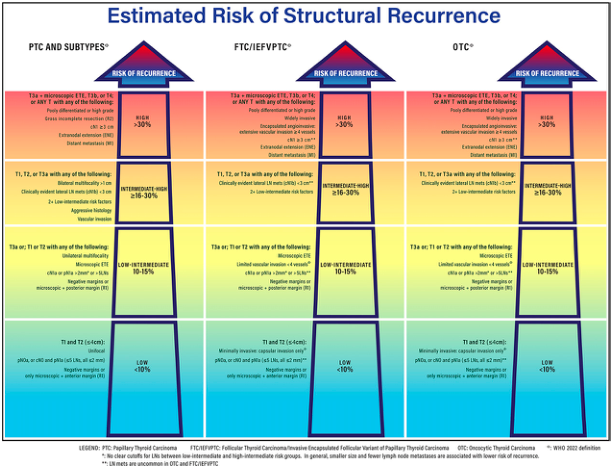
Summary : This figure presents a structured risk stratification chart for the estimated risk of structural recurrence in thyroid carcinoma, comparing three types: Papillary Thyroid Carcinoma (PTC) and subtypes, Follicular Thyroid Carcinoma/Invasive Encapsulated Follicular Variant of Papillary Thyroid Carcinoma (FTC/IEFVPTC), and Oncocytic Thyroid Carcinoma (OTC). The chart categorizes risk into four levels (High, Intermediate-High, Low-Intermediate, Low) based on specific clinical and pathological criteria. flowchart: # Risk Categories : • High (>30%) • Intermediate-High (≥16–30%) • Low-Intermediate (10–15%) • Low (<10%) # Cancer Types Compared : • PTC and Subtypes • FTC/IEFVPTC • OTC # Criteria for Each Risk Category : ## High (>30%) : • T3a + microscopic ETE, T3b, or T4; or ANY of the following: – Poorly differentiated or high grade – Gross incomplete resection (R2) – Encapsulated extension (EN) – Distant metastasis (M1) – Widely invasive (FTC/IEFVPTC, OTC) – Extensive vascular invasion (FTC/IEFVPTC, OTC) – Extrathyroidal extension (EN) (FTC/IEFVPTC, OTC) ## Intermediate-High (≥16–30%) : • T1, T2, or T3a with any of the following: – Clinically evident lateral LN mets (cN1b) or >5 pathologic LN mets (pN1b) – 2+ low-intermediate risk factors – Aggressive histology – Vascular invasion ## Low-Intermediate (10–15%) : • T3a or T2, T1 with any of the following: – Unilateral multifocality (>2 foci) – Limited vascular invasion (<5 vessels) (FTC/IEFVPTC, OTC) – cN1a or pN1a >5mm or >5 LNs – Microscopic + posterior margin (R1) – Microscopic ETE (OTC) ## Low (<10%) : • T1 and T2 (≤4cm): – Minimally invasive/capsular invasion only (FTC/IEFVPTC, OTC) – pN0/x or cN0 and pN1a (≤5 LNs, all ≤2mm) – Only microscopic + anterior margin (R1) # Colour Coding : • High risk: Red • Intermediate-High risk: Orange • Low-Intermediate risk: Yellow • Low risk: Green/Blue # Legend : • PTC: Papillary Thyroid Carcinoma • FTC/IEFVPTC: Follicular Thyroid Carcinoma/Invasive Encapsulated Follicular Variant of Papillary Thyroid Carcinoma • OTC: Oncocytic Thyroid Carcinoma • WHO 2022 definition • Notes on cutoffs and risk group distinctions # Layout : • Three vertical columns for each cancer type, each subdivided into four horizontal risk bands. • Each band lists specific clinical/pathological criteria for risk assignment. # Analysis : • The chart visually stratifies recurrence risk for three thyroid carcinoma types using consistent risk categories and criteria. • High risk is associated with advanced disease features (e.g., distant metastasis, extensive invasion). • Intermediate and low-intermediate risks are defined by combinations of nodal involvement, multifocality, and limited invasion. • Low risk is reserved for small, minimally invasive tumors with limited nodal involvement. • The structure allows for rapid comparison of risk factors and recurrence likelihood across carcinoma types.
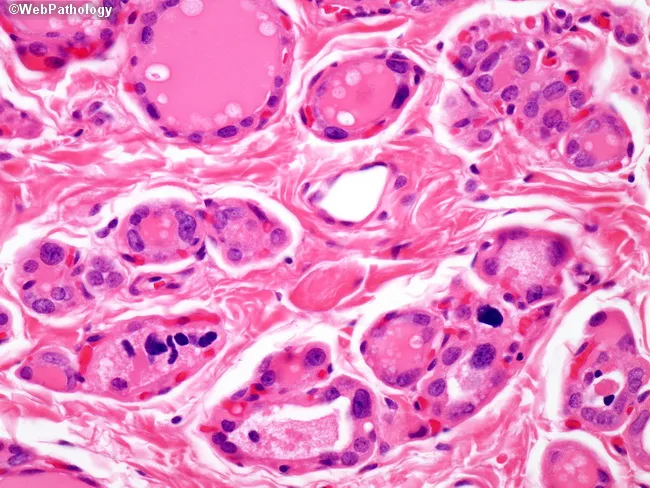
This is a light-micrograph of thyroid parenchyma illustrating dyshormonogenetic goiter with prominent cytologic atypia in follicular cells. Acquired from a thyroid tissue specimen, the slide is stained with Hematoxylin and Eosin (H&E) and examined at high magnification under light microscopy. The architectural pattern shows numerous small follicles embedded in a fibrous stroma with variable colloid content and papillary-like nuclear changes. Follicular cells display marked variation in size and shape, hyperchromatic nuclei, nuclear crowding, and occasional grooves or grooves-like features that can mimic papillary carcinoma. The presence of abundant cytoplasm, irregular nucleo-cytoplasmic borders, and pseudoinclusions contribute to diagnostic confusion. In dyshormonogenetic goiter, these cytologic changes can be striking, and in up to about 20% of cases may lead to misinterpretation as follicular, papillary, medullary, or undifferentiated carcinoma, underscoring a clinically significant pitfall. Notable benign features include preservation of follicular arrangement, presence of colloid within many follicles, and absence of unequivocal invasion or stromal desmoplasia. This image highlights the key diagnostic challenge: the need to differentiate benign dyshormonogenetic changes from malignant thyroid neoplasia on cytology or limited histology. Clinically, dyshormonogenesis is associated with congenital hypothyroidism and goiter; diagnosis relies on correlating cytology with clinical data, family history, and, when needed, molecular testing.
🩺 THYROID TUMORS — FMGE RAPID NOTES
📊 OVERVIEW & FREQUENCY
| Type | % of Thyroid Ca | Key Point |
|---|---|---|
| Papillary | ~85% | Most common; best prognosis |
| Follicular | ~10% | Iodine deficiency areas |
| Medullary | ~5% | C-cell; calcitonin; amyloid |
| Anaplastic | ~1-5% | Most aggressive; ~100% fatal |
| Lymphoma | ~1-5% | NHL; Hashimoto's association |
FMGE pearl: Papillary = most common + best prognosis. Anaplastic = rarest + worst prognosis.
1. PAPILLARY THYROID CARCINOMA (PTC)
Epidemiology
- Most common thyroid malignancy (~85%)
- F > M (3:1); peak age: 30-50 years
- Strongly linked to prior ionizing radiation exposure (neck irradiation)
Molecular Markers
- BRAF V600E mutation - most common (>60%)
- RET/PTC rearrangement (especially in radiation-related PTC)
- RAS mutations (follicular variant)
Morphology (HIGH YIELD)
- Solitary or multifocal; may be well-circumscribed or infiltrative
- Papillary fronds visible on cut surface
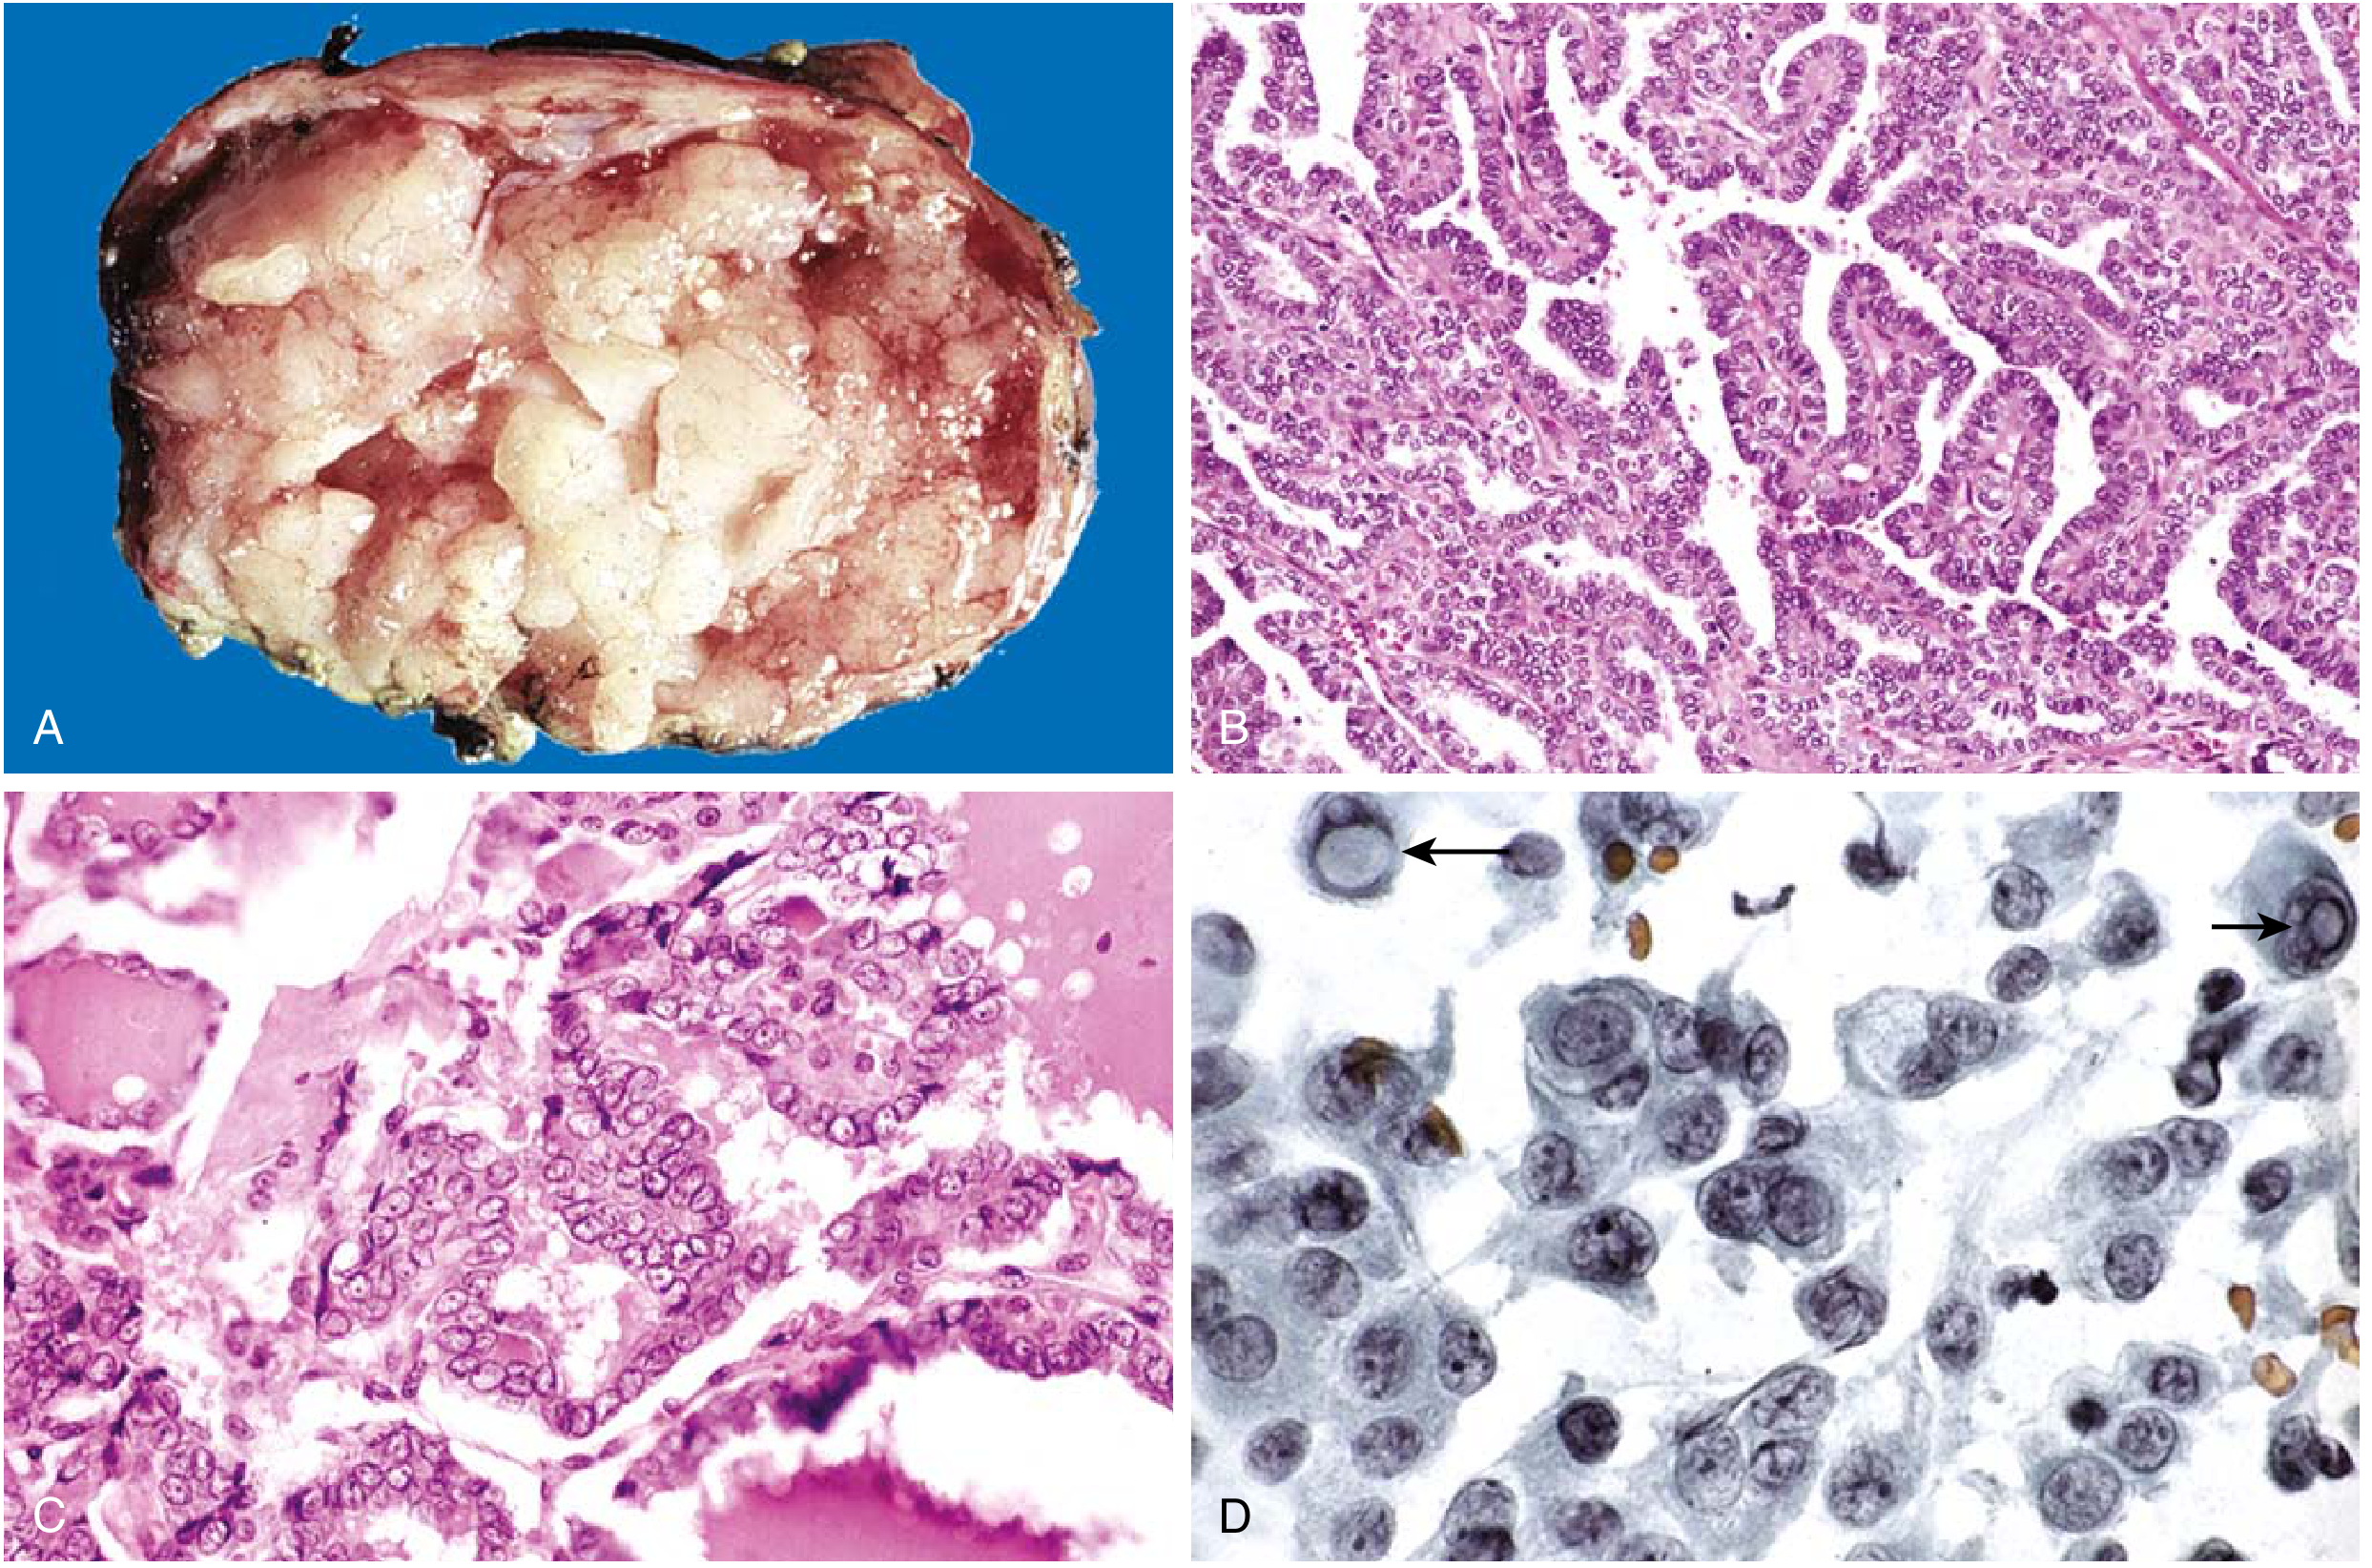
Fig. 18.12 from Robbins: (A) Gross papillary carcinoma, (B) Well-formed papillae, (C) "Orphan Annie eye" nuclei - ground-glass/empty appearance, (D) FNA showing characteristic intranuclear inclusions (arrows)
- Branching papillae with fibrovascular stalks covered by cuboidal epithelium
- "Orphan Annie eye" nuclei = ground-glass / optically clear nuclei (finely dispersed chromatin)
- Intranuclear pseudo-inclusions and nuclear grooves (cytoplasmic invaginations)
- Psammoma bodies = concentrically calcified lamellated structures in papillae cores
- Almost NEVER in follicular or medullary carcinoma
- Lymphatic invasion common; blood vessel invasion uncommon in small tumors
Mnemonic for PTC nuclear features: "OOIP"
- Orphan Annie eye
- Overlapping nuclei
- Intranuclear inclusions/grooves
- Psammoma bodies
Clinical Features
- Presents as painless neck mass (in thyroid or cervical LN metastasis)
- FNAC can establish preoperative diagnosis
- Spreads via lymphatics - cervical LN mets in up to 50% of cases
- Distant mets (hematogenous) to lung - uncommon
- 10-year survival >95% - excellent prognosis
- Prognosis worse if: age >40 years, extrathyroidal extension, distant mets
Treatment
- Total thyroidectomy
- Post-op I-131 ablation (TSH-stimulated) for high-risk patients
- I-131 ablation reduces local + regional recurrence and disease-specific mortality
- T4 suppression post-treatment to suppress TSH
- Repeat thyroid scintigraphy when thyroglobulin >5 ng/mL
2. FOLLICULAR THYROID CARCINOMA (FTC)
Epidemiology
- F > M (3:1); peak age: 40-60 years (older than PTC)
- More common in areas of dietary iodine deficiency
Molecular Markers
- RAS mutations (most common)
- PAX8-PPARG fusion (translocation - seen in up to 1/3 of encapsulated follicular variant PTC too)
- PIK3CA mutations
Morphology (HIGH YIELD)
- Usually a single nodule; may look like a follicular adenoma grossly
- Uniform cells forming small follicles, resembling normal thyroid
- KEY diagnostic criterion = Capsular AND/OR vascular invasion (cannot distinguish adenoma from carcinoma without this!)
- If nuclear features are like PTC → classify as follicular VARIANT of PTC, not FTC
FMGE pearl: Adenoma vs. Carcinoma in follicular lesions is determined ONLY by capsular/vascular invasion on histology - NOT by cytology alone!
Clinical Features
- Manifests as solitary cold nodule
- Rare cases: hyperfunctional
- Metastasizes hematogenously - lungs, bone, liver (NOT lymphatics - opposite to PTC!)
- Widely invasive FTC: up to 50% mortality at 10 years
- Minimally invasive FTC: <10% mortality at 10 years
- Treatment: surgical excision; well-differentiated mets may take up radioactive iodine
3. MEDULLARY THYROID CARCINOMA (MTC)
Cell of Origin
- Parafollicular C cells (NOT follicular epithelium)
- Secretes CALCITONIN and CEA (tumor markers)
Epidemiology
- 75% sporadic, 25% familial
- Familial forms occur in MEN-2A and MEN-2B
MEN Associations (HIGH YIELD for FMGE!)
| Syndrome | Components |
|---|---|
| MEN 2A | MTC + Pheochromocytoma + Hyperparathyroidism |
| MEN 2B | MTC + Pheochromocytoma + Mucosal neuromas (lips, tongue, eyelids) |
| Familial non-MEN MTC (FMTC) | Only MTC |
- RET proto-oncogene mutations → constitutive activation of RET tyrosine kinase
- RET = REarranged during Transfection
- Germline RET mutation → familial MTC/MEN-2
- Somatic RET mutation → ~50% of sporadic MTC
Morphology
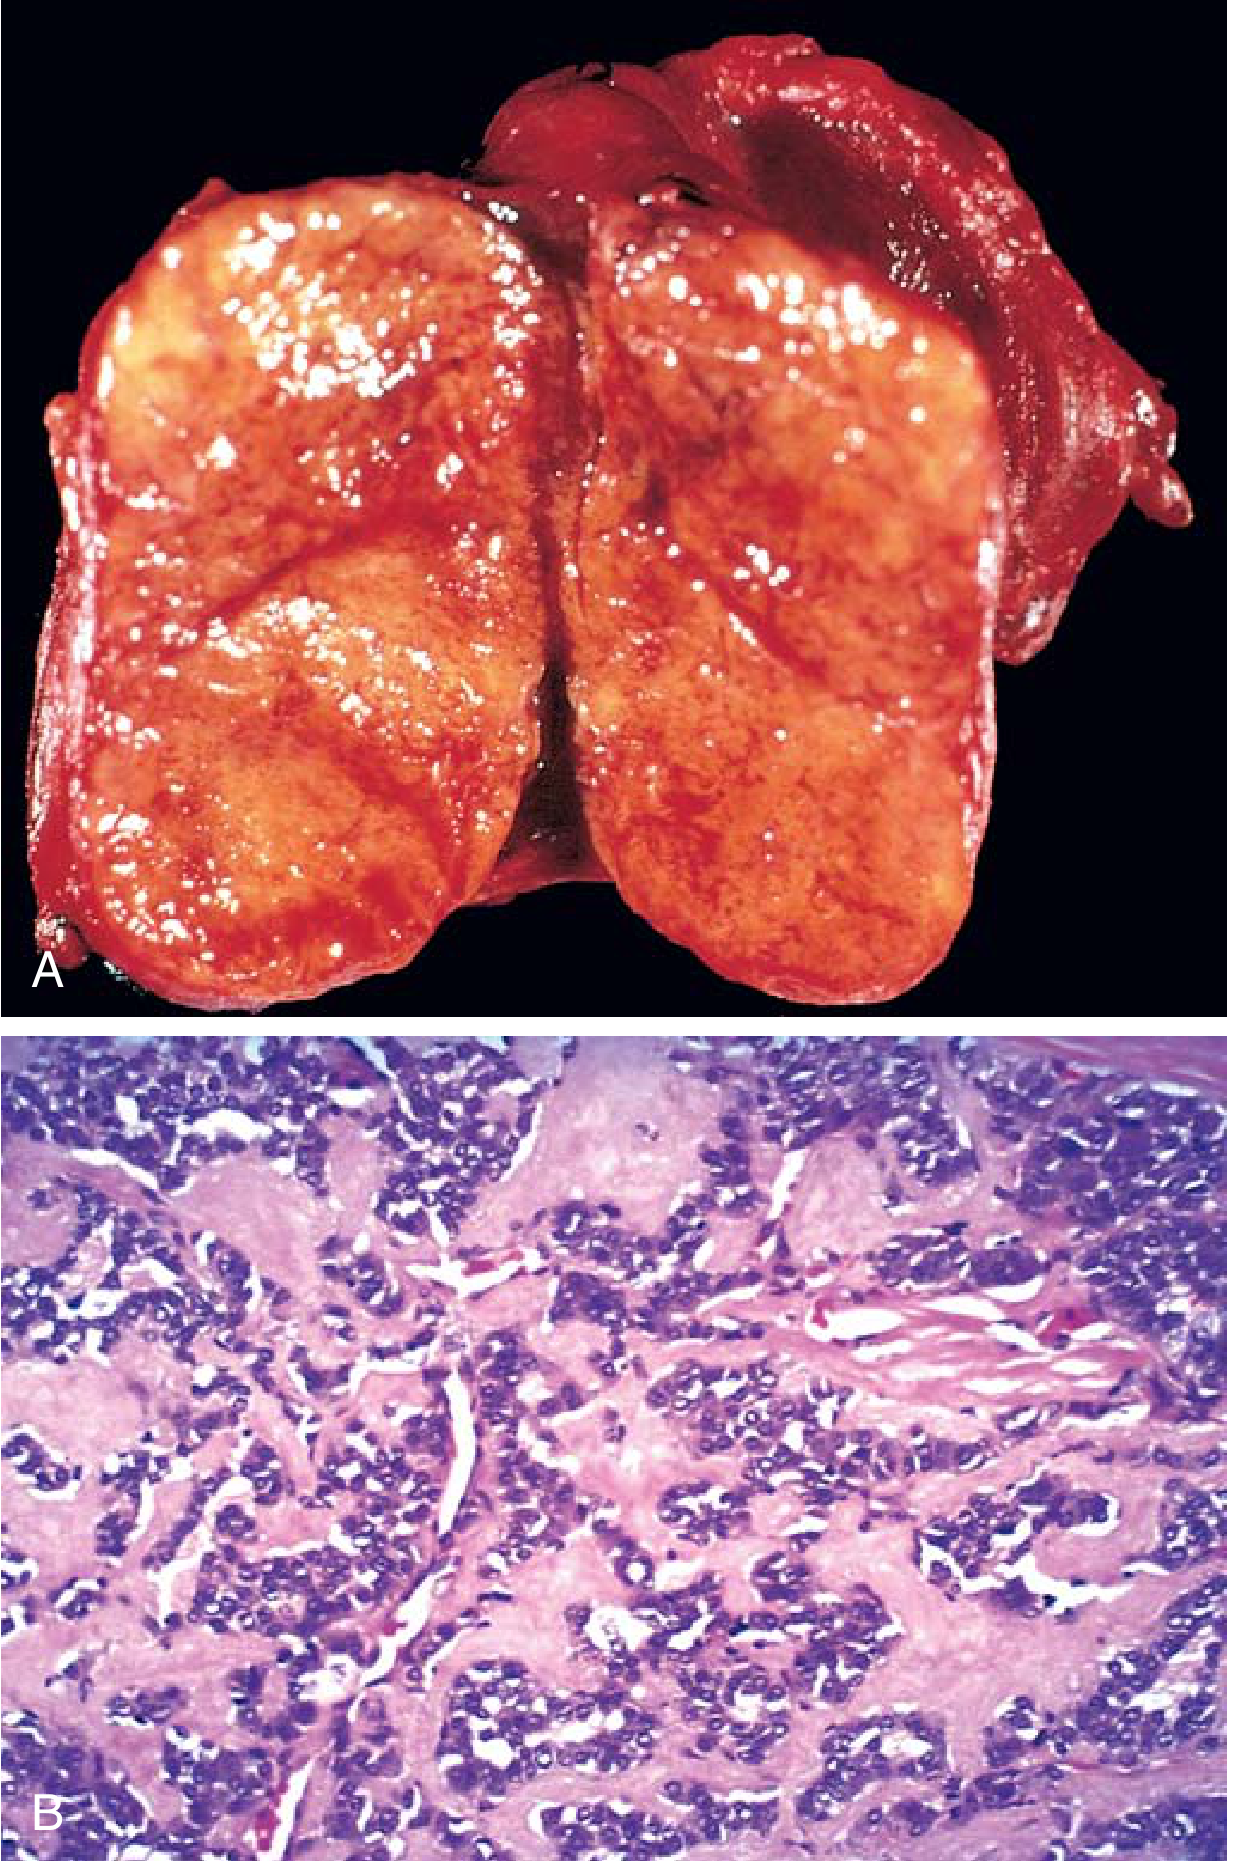
Fig. 18.16 from Robbins: (A) Solid mass without fibrous capsule, (B) Abundant amyloid (pink homogeneous extracellular material)
- Polygonal to spindle-shaped cells in nests, trabeculae, gland-like structures
- AMYLOID deposits in stroma (derived from altered calcitonin molecules) - DISTINCTIVE FEATURE
- Amyloid: Congo red stain → apple-green birefringence under polarized light
- Familial cases: bilateral and multicentric; surrounded by C-cell hyperplasia (precursor lesion)
Clinical Features
- Neck mass ± compression (dysphagia, hoarseness)
- Diarrhea if secreting VIP (vasoactive intestinal peptide)
- Serum calcitonin - screening + follow-up marker
- CEA - also elevated
- Tendency for paratracheal and lateral lymph node involvement
Screening & Prevention
- Screen relatives with serum calcitonin or RET mutation testing
- Prophylactic thyroidectomy for RET mutation carriers:
- MEN 2B: age 2 years
- MEN 2A: age 6 years
Treatment
- Total thyroidectomy + neck dissection for cervical disease
- Follow-up with serum calcitonin levels
- Does NOT take up radioactive iodine (not from follicular epithelium)
4. ANAPLASTIC THYROID CARCINOMA (ATC)
Key Points (HIGH YIELD)
- Undifferentiated tumors of follicular epithelium
- Most aggressive thyroid cancer; mortality approaching 100%
- Mean age: 65 years (oldest age group)
- 25% have a history of prior well-differentiated thyroid Ca (PTC or FTC)
- 25% have a concurrent well-differentiated carcinoma in the resected specimen
Molecular Markers
- TP53 loss-of-function mutations (most characteristic - NOT seen in differentiated carcinomas)
- Also carries RAS, PIK3CA mutations (shared with differentiated carcinomas)
Morphology
- Bulky mass growing rapidly beyond thyroid capsule into adjacent neck structures
- Cells: large pleomorphic OR spindle-shaped (or both)
- Foci of papillary/follicular differentiation may be present
- 90% have regional or distant spread at presentation
Clinical Features
- Rapid enlargement of neck mass
- Death in <1 year due to aggressive local growth and compromise of vital neck structures
- Treatment: palliative - chemoradiation / XRT
5. THYROID LYMPHOMA
- Non-Hodgkin Lymphoma (NHL)
- Strong association with Hashimoto's thyroiditis (autoimmune)
- Treatment: XRT (local disease) or chemotherapy (metastatic disease)
6. FOLLICULAR ADENOMA (Benign)
- Most common benign thyroid neoplasm
- True benign neoplasm from follicular cells
- Encapsulated; NO capsular or vascular invasion (vs. FTC)
- FNA cannot reliably distinguish from FTC - requires excision + histology
⚡ HIGH-YIELD FMGE COMPARISON TABLE
| Feature | PTC | FTC | MTC | ATC |
|---|---|---|---|---|
| Cell of Origin | Follicular | Follicular | C cell (parafollicular) | Follicular |
| Frequency | Most common (~85%) | ~10% | ~5% | ~1-5% |
| Peak age | 30-50 | 40-60 | Any | ~65 |
| Spread | Lymphatic | Hematogenous | Both | Both |
| Metastasis sites | Cervical LN | Lung, bone, liver | Paratracheal LN | Everywhere |
| Tumor markers | Thyroglobulin | Thyroglobulin | Calcitonin, CEA | - |
| Radioiodine uptake | Yes | Yes | No | No |
| Prognosis | Excellent (>95% 10yr) | Good-intermediate | Moderate | Lethal |
| Key mutation | BRAF V600E | RAS, PAX8-PPARG | RET | TP53 |
| Special histology | Orphan Annie, Psammoma | Capsular/vascular invasion | Amyloid stroma | Pleomorphic/spindle |
⚡ ONE-LINERS FOR RAPID RECALL
- Most common thyroid cancer = Papillary
- Best prognosis = Papillary (>95% 10-year survival)
- Worst prognosis = Anaplastic (~100% fatal)
- Psammoma bodies = Papillary (almost NEVER in follicular or medullary)
- Amyloid stroma = Medullary thyroid carcinoma
- Orphan Annie nuclei = Papillary
- Capsular/vascular invasion distinguishes FTC from follicular adenoma
- Calcitonin marker = Medullary
- CEA marker = Medullary
- RET mutation = Medullary (familial / MEN-2)
- BRAF V600E = Papillary (most common mutation)
- TP53 mutation = Anaplastic
- Radioiodine NOT useful in Medullary and Anaplastic
- MEN 2A = MTC + Pheo + Hyperparathyroidism
- MEN 2B = MTC + Pheo + Mucosal neuromas
- Lymphoma + thyroid = Hashimoto's association (NHL)
- Hematogenous spread (lung/bone) = Follicular
- Lymphatic spread (cervical LN) = Papillary
- Iodine deficiency - linked to Follicular > Papillary
- Radiation - strongly linked to Papillary carcinoma
🔢 PROPHYLACTIC THYROIDECTOMY AGE (MEN-2)
| Syndrome | Age for Prophylactic Thyroidectomy |
|---|---|
| MEN 2B | 2 years (most aggressive) |
| MEN 2A | 6 years |
| FMTC | Based on mutation/calcitonin |
📌 RISK STRATIFICATION - Quick (for Recurrence)
- High risk (>30%): T4, distant mets, gross ETE, poorly differentiated, R2 resection
- Intermediate risk (16-30%): Lateral LN mets (cN1b), aggressive histology, vascular invasion
- Low-intermediate (10-15%): T3a, limited vascular invasion, cN1a >5mm
- Low risk (<10%): T1-T2, minimally invasive, small nodal mets <2mm
Make a flowchart for thyroid nodule FNA interpretation (Bethesda)
A clean medical flowchart titled "Thyroid Nodule FNA – Bethesda System (2023)" showing all 6 Bethesda categories as a vertical flowchart with color-coded boxes, risk percentages, and management recommendations. Layout: Central vertical spine with 6 numbered category boxes flowing downward, each branching right to show "Malignancy Risk %" and "Recommended Management". Category I – Non-Diagnostic / Unsatisfactory | Risk: 5–10% | Management: Repeat US-guided FNA Category II – Benign | Risk: 0–3% | Management: Clinical follow-up / US surveillance Category III – AUS / FLUS (Atypia of Undetermined Significance) | Risk: 10–30% | Management: Repeat FNA, Molecular testing, or Lobectomy Category IV – Follicular Neoplasm / Suspicious for FN | Risk: 25–40% | Management: Molecular testing or Lobectomy Category V – Suspicious for Malignancy | Risk: 50–75% | Management: Near-total thyroidectomy or Lobectomy Category VI – Malignant | Risk: 97–99% | Management: Near-total thyroidectomy Color coding: Cat I = grey, Cat II = green, Cat III = yellow, Cat IV = orange, Cat V = salmon/light red, Cat VI = red. Each box has bold category name, italic subtitle, risk badge, and management arrow. Include a small legend box bottom-right explaining AUS = Atypia of Undetermined Significance, FLUS = Follicular Lesion of Undetermined Significance, FN = Follicular Neoplasm. Clean white background, medical illustration style, professional typography.
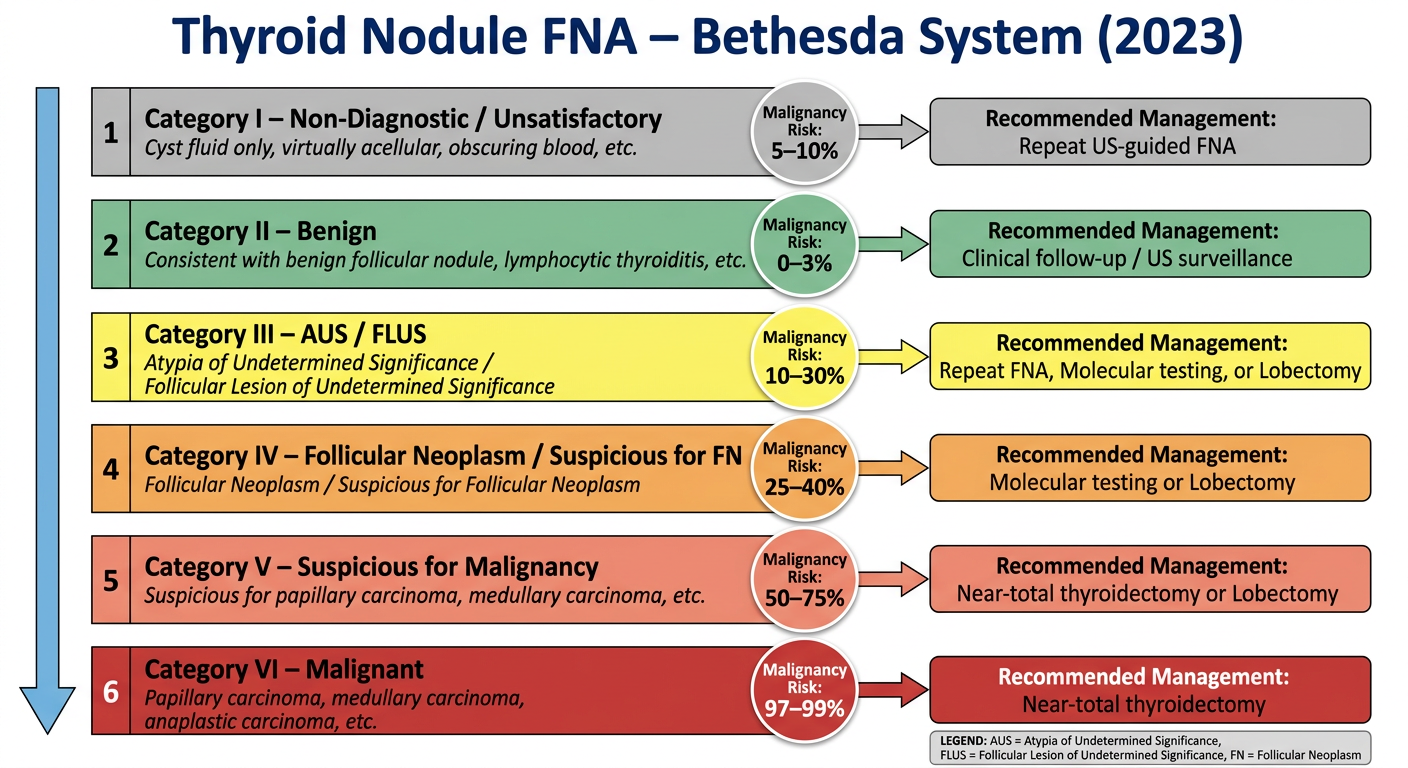
Bethesda System - FMGE One-Liner Summary
| Bethesda | Category Name | Malignancy Risk | Action |
|---|---|---|---|
| I | Non-diagnostic / Unsatisfactory | 5-10% | Repeat US-guided FNA |
| II | Benign | 0-3% | Clinical follow-up / US surveillance |
| III | AUS / FLUS | 10-30% | Repeat FNA / Molecular testing / Lobectomy |
| IV | Follicular Neoplasm (Suspicious for FN) | 25-40% | Molecular testing or Lobectomy |
| V | Suspicious for Malignancy | 50-75% | Near-total thyroidectomy or Lobectomy |
| VI | Malignant | 97-99% | Near-total thyroidectomy |
- AUS = Atypia of Undetermined Significance; FLUS = Follicular Lesion of Undetermined Significance (both = Bethesda III)
- Bethesda II (Benign) is the most common result - over 60% of FNAs
- Bethesda VI (Malignant) is most often PTC on cytology
- Bethesda IV cannot distinguish adenoma from carcinoma - requires lobectomy + histology
- Molecular testing (e.g., ThyroSeq, Afirma) is now used for Bethesda III and IV to guide surgery vs. observation