
Discuss Immune Profiling and its role in cancer- make me an answer with current updates, standard book references, and suitable for md exam
immune profiling cancer tumor microenvironment
immune profiling cancer immunophenotyping tumor 2025 2026 clinical significance
https://link.springer.com/article/10.1007/s12032-025-03002-x
tumor immune microenvironment T cells macrophages cancer
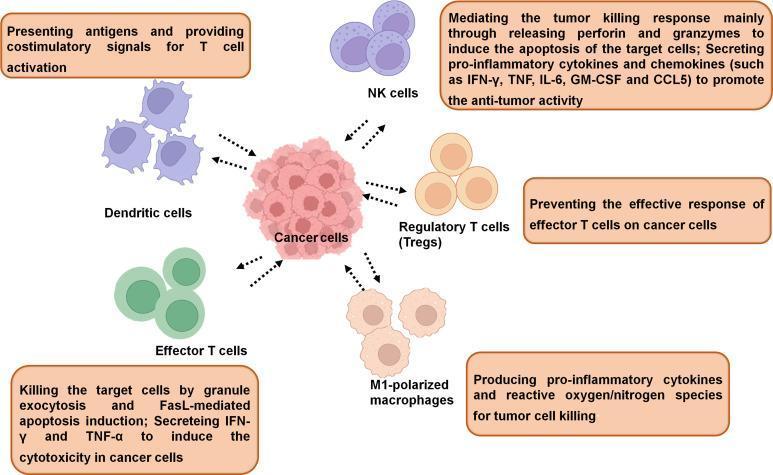
A medical illustration of the tumor microenvironment (TME) depicting the cellular interactions between a central cluster of cancer cells and various infiltrating immune cells. The diagram categorizes immune cells into tumor-antagonizing and tumor-promoting types. Tumor-antagonizing cells include: 1) Dendritic cells (blue, with cytoplasmic projections) shown presenting antigens for T cell activation; 2) NK cells (purple, round) which mediate tumor killing via perforin/granzyme release and pro-inflammatory cytokine secretion (e.g., IFN-γ, TNF, IL-6); 3) Effector T cells (green, round) which induce apoptosis via granule exocytosis and FasL signaling; and 4) M1-polarized macrophages (tan, ruffled) which produce reactive oxygen species and pro-inflammatory cytokines for tumor destruction. In contrast, Regulatory T cells (Tregs, tan, round) are shown as tumor-promoting agents that suppress the effective response of effector T cells. Dotted arrows indicate bidirectional and unidirectional functional interactions within the TME. The illustration highlights key mechanisms of cancer immunotherapy and immune evasion.
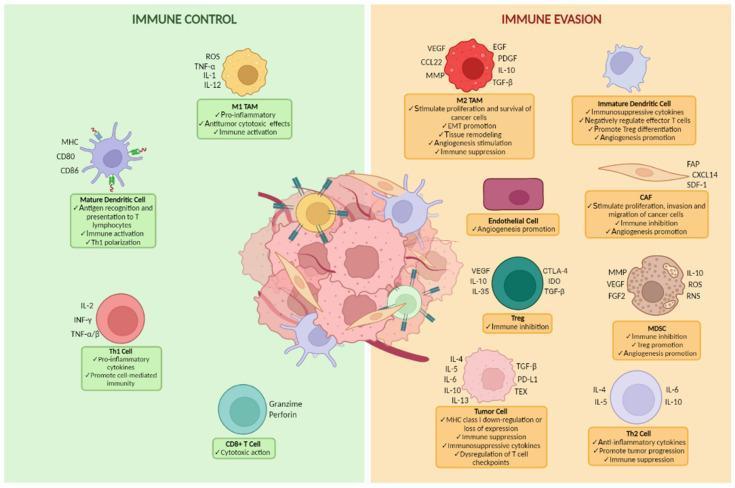
A comparative medical illustration detailing the dualistic nature of the ovarian cancer tumor microenvironment (TME), categorized into 'Immune Control' (green panel) and 'Immune Evasion' (orange panel). The central figure depicts a tumor mass surrounded by various stromal and immune cells. The 'Immune Control' arm illustrates pro-inflammatory and antitumor components: M1 tumor-associated macrophages (TAMs) secreting ROS, TNF-α, and IL-12; mature dendritic cells expressing MHC, CD80, and CD86; Th1 cells producing IL-2 and IFN-γ; and CD8+ cytotoxic T cells utilizing granzyme and perforin. Conversely, the 'Immune Evasion' arm focuses on immunosuppressive elements promoting tumor progression, including M2 TAMs (secreting VEGF and TGF-β), immature dendritic cells, cancer-associated fibroblasts (CAFs), endothelial cells, regulatory T cells (Tregs), myeloid-derived suppressor cells (MDSCs), Th2 cells, and tumor cells. Key mechanisms highlighted include angiogenesis, epithelial-mesenchymal transition (EMT), MHC class I downregulation, and the expression of checkpoint molecules like CTLA-4, IDO, and PD-L1. This diagram serves as an educational summary of the competitive signaling pathways and cellular interactions influencing cancer survival versus elimination.
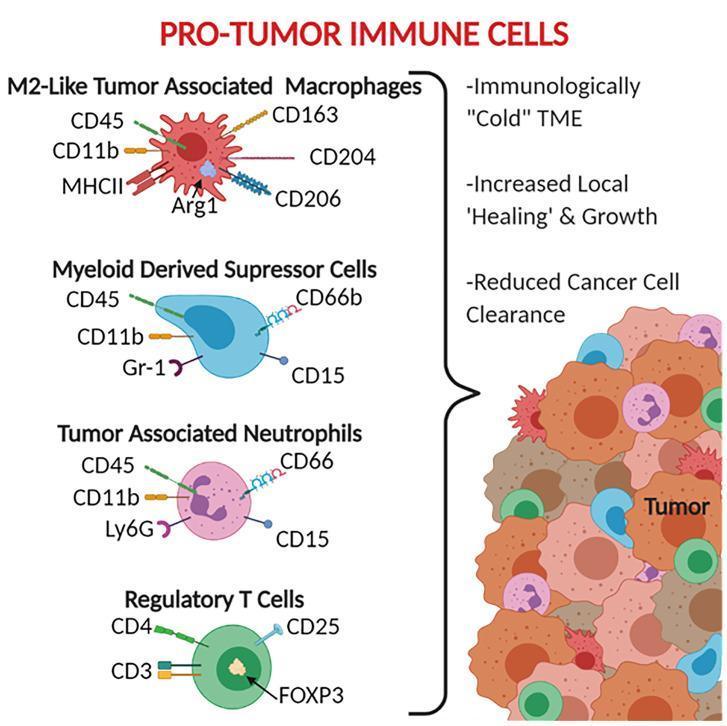
An educational infographic titled 'Pro-Tumor Immune Cells' illustrating the phenotypes and characteristics of immunosuppressive cells within the tumor microenvironment (TME). The diagram is divided into four cell categories with their respective surface and intracellular markers: 1) M2-Like Tumor Associated Macrophages (TAMs) showing markers CD45, CD11b, MHCII, CD163, CD204, CD206, and intracellular Arg1; 2) Myeloid Derived Suppressor Cells (MDSCs) identified by CD45, CD11b, Gr-1, CD66b, and CD15; 3) Tumor Associated Neutrophils (TANs) labeled with CD45, CD11b, Ly6G, CD66, and CD15; and 4) Regulatory T Cells (Tregs) defined by CD4, CD3, CD25, and the transcription factor FOXP3. A summary bracket indicates that these cells collectively contribute to an immunologically 'cold' TME, characterized by increased local tissue healing and growth, and reduced cancer cell clearance. A visual schematic on the right depicts these immune cells infiltrating a heterogeneous tumor mass, representing their physical distribution in the stroma and margins.
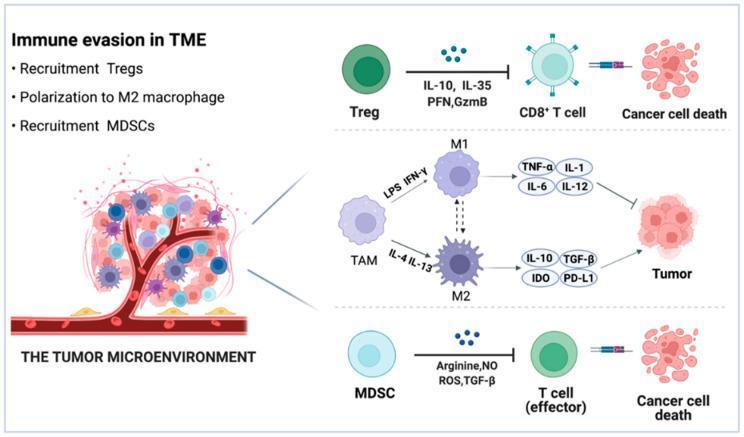
A medical pathophysiology diagram illustrating immune evasion mechanisms within the tumor microenvironment (TME). The schematic is divided into three horizontal panels detailing the roles of specific immunosuppressive cells. The top panel shows Regulatory T cells (Tregs) secreting inhibitory factors (IL-10, IL-35, PFN, and GzmB) to block CD8+ T cell-mediated cancer cell death. The middle panel depicts Tumor-Associated Macrophage (TAM) polarization; M1-polarized macrophages (via LPS and IFN-γ) release pro-inflammatory cytokines (TNF-α, IL-1, IL-6, IL-12) to inhibit the tumor, while M2-polarized TAMs (via IL-4 and IL-13) promote tumor growth by releasing IL-10, TGF-β, IDO, and PD-L1. The bottom panel demonstrates Myeloid-Derived Suppressor Cells (MDSCs) releasing arginine, NO, ROS, and TGF-β to suppress effector T cell activity. A central anatomical illustration on the left shows these cells infiltrating a vascularized tumor mass. The diagram serves as an educational tool for understanding oncology and immunology concepts related to cancer immunotherapy and the suppressive TME signaling pathways.
Immune Profiling and Its Role in Cancer
1. Definition and Concept
"There is an increasing awareness that the tumor microenvironment (stromal cells, immune cells, and extracellular matrix) plays an important role in breast cancer initiation, progression, and dissemination."
- Robbins & Cotran Pathologic Basis of Disease
2. Immunological Basis - The Tumor Microenvironment (TME)
A. Anti-tumor (Immunogenic/"Hot") TME
| Cell Type | Mechanism |
|---|---|
| CD8+ Cytotoxic T Lymphocytes (CTLs) | Kill via perforin/granzyme; Fas-FasL pathway |
| CD4+ Th1 cells | Produce IFN-γ, IL-2; activate macrophages and CTLs |
| NK Cells | Kill via NKG2D activation; ADCC; respond to MHC-I downregulation |
| M1 Macrophages | Produce ROS, nitric oxide, TNF-α, IL-12 |
| Dendritic Cells (DCs) | Cross-present tumor antigens; activate naive T cells |
B. Pro-tumor (Immunosuppressive/"Cold") TME
| Cell Type | Mechanism |
|---|---|
| Regulatory T cells (Tregs) | Secrete IL-10, IL-35, TGF-β; suppress effector T cells |
| M2 Tumor-Associated Macrophages (TAMs) | Secrete VEGF, TGF-β, IL-10; promote angiogenesis and EMT |
| Myeloid-Derived Suppressor Cells (MDSCs) | Secrete arginase, NO, ROS; suppress T cell activation |
| Tumor-Associated Neutrophils (TANs) | Promote metastasis in certain contexts |
| Cancer-Associated Fibroblasts (CAFs) | Create mechanical and cytokine barriers |
Cellular and Molecular Immunology (Abbas, Lichtman & Pillai) describes how M2 macrophages and Tregs create the immunosuppressive microenvironment that works against the adaptive immune response.
3. Methods / Technologies Used in Immune Profiling
A. Histological / Tissue-Based Methods
- Immunohistochemistry (IHC): Detects CD3, CD8, CD45RO, FOXP3, PD-L1 on fixed tissue sections. Most widely used in clinical pathology.
- Multiplex IHC / Immunofluorescence: Simultaneously detects 5-10 markers on a single tissue slide; allows spatial characterization.
- Tumor-Infiltrating Lymphocyte (TIL) scoring: H&E-based or IHC-based assessment; standardized scoring criteria used in breast cancer (TILs Working Group).
B. Flow Cytometry and Mass Cytometry
- Flow Cytometry: Multi-parameter analysis of surface/intracellular markers on single cells from blood, bone marrow, or tumor disaggregates. Standard for hematologic malignancy immunophenotyping (ALL, CLL, AML, lymphomas).
- Mass Cytometry (CyTOF): Uses metal-isotope-tagged antibodies; allows simultaneous detection of 40+ markers per cell. High-dimensional immune profiling without spectral overlap.
C. Genomic and Transcriptomic Methods
- Next-Generation Sequencing (NGS): Detects tumor mutational burden (TMB), microsatellite instability (MSI), neoantigen load - all key predictors of immunotherapy response.
- Single-cell RNA Sequencing (scRNA-seq): Maps transcriptional states of individual immune cells within tumors; identifies rare subpopulations (e.g., exhausted CD8+ T cells, Treg subsets).
- Spatial Transcriptomics: Combines gene expression with spatial tissue architecture - maps "who is where" in the tumor.
- Bulk RNA-seq + Deconvolution (CIBERSORT, TIMER): Computationally infers immune cell composition from bulk tumor RNA data; used in large database studies (TCGA).
D. Proteomics
- Mass Spectrometry-Based Proteomics: Profiles immune-related proteins in tumor lysates and serum.
- Cytokine multiplex assays (Luminex): Simultaneous quantification of multiple cytokines (IL-2, IFN-γ, TNF-α, IL-10, TGF-β) in plasma or supernatants.
E. Liquid Biopsy
- Circulating Tumor Cells (CTCs) + immune cell co-analysis: Characterizes immune-tumor cell interactions in peripheral blood.
- Cell-free DNA (cfDNA): TMB and MSI assessment without tissue biopsy.
4. Key Biomarkers in Immune Profiling
| Biomarker | Method | Clinical Significance |
|---|---|---|
| PD-L1 expression | IHC | Predicts response to PD-1/PD-L1 inhibitors (pembrolizumab, atezolizumab); mandatory for NSCLC first-line therapy selection |
| Tumor Mutational Burden (TMB) | NGS | High TMB = more neoantigens = better immunotherapy response; FDA-approved for pembrolizumab (TMB-H, any solid tumor) |
| MSI-H / dMMR | PCR, IHC, NGS | Microsatellite Instability-High predicts excellent response to checkpoint inhibitors; tissue-agnostic FDA approval for pembrolizumab |
| CD8+ TIL count | IHC, H&E | High CD8+ infiltration = favorable prognosis in breast cancer, colorectal cancer, NSCLC |
| Immunoscore | IHC (CD3, CD8) | Validated prognostic tool in colorectal cancer (see below) |
| Treg (FOXP3+) infiltration | IHC | High FOXP3+ Tregs = poor prognosis in most cancers |
| M1:M2 TAM ratio | IHC, flow | Higher M2 = worse prognosis, resistance to therapy |
| IDO expression | IHC, transcriptomics | Immunosuppressive enzyme; IDO inhibitors in clinical trials |
| LAG-3, TIM-3, TIGIT | IHC, flow | Co-inhibitory receptors; targets for next-generation checkpoint inhibitors |
Harrison's Principles of Internal Medicine 22E (2025): "Although PD-L1 has been identified as a biomarker that can predict response to immune checkpoint inhibitors, responses are observed in patients who do not appear to express the biomarker" - highlighting the need for multi-parameter profiling.
5. The Immunoscore - A Landmark Immune Profiling Tool
- Tumors are scored based on CD45RO+ memory T cells and CD8+ CTLs quantified at the center and invasive margins of resected tumors.
- Score ranges: Immunoscore 0 (low density, both regions) to Immunoscore 4 (high density, both regions).
- A low Immunoscore predicts higher risk of relapse, metastases, and death within 5 years.
- In multiple studies, the Immunoscore demonstrated greater prognostic value than TNM staging (the gold standard histological classification).
Cellular and Molecular Immunology (Abbas): "In some studies, the immune score was found to have greater prognostic value than the histologic evaluation of the tumor."
6. Immune Evasion Mechanisms (What Immune Profiling Detects)
- Reduced antigen presentation: Downregulation/loss of MHC class I molecules - makes tumor invisible to CTLs but susceptible to NK cells.
- Expression of immune checkpoints: PD-L1 upregulation on tumor cells inhibits PD-1+ T cells; CTLA-4 engagement on Tregs dampens APC function.
- Immunosuppressive cytokine secretion: TGF-β, IL-10, VEGF suppress effector immune responses.
- Recruitment of suppressive cells: TAMs, MDSCs, Tregs are actively recruited to the TME.
- IDO pathway activation: Converts tryptophan to kynurenine, creating a local metabolic immune desert.
- T-cell exhaustion: Chronic antigen stimulation induces expression of multiple co-inhibitory receptors (PD-1, TIM-3, LAG-3, TIGIT, TOX transcription factor) on CD8+ T cells, rendering them dysfunctional.
- Neoantigen loss: Immune pressure selects for tumor clones with reduced or mutated neoantigens (immune editing).
Harrison's 22E: "Immune pressure within the tumor microenvironment can select for tumor cells that present few or mutated neoantigens and thus escape ongoing antitumor immunity."
7. Clinical Applications of Immune Profiling
A. Diagnosis and Classification
- Hematologic malignancies: Flow cytometry-based immunophenotyping is the gold standard for classifying ALL (B-cell vs T-cell), AML (FAB subtype), CLL, NHL subtypes, plasma cell disorders.
- Example: B-ALL - CD19+, CD22+, TdT+; T-ALL - CD3+, CD5+, CD7+; CLL - CD5+, CD19+, CD23+, dim CD20.
B. Prognosis
- TIL scoring in breast cancer: High TIL count, especially in triple-negative (TNBC) and HER2+ subtypes, correlates with complete pathologic response to neoadjuvant therapy and improved survival.
- Immunoscore in CRC: As above.
- NSCLC: CD8+ TIL infiltration predicts better outcomes with checkpoint inhibitors.
- Molecular subtypes (CRC): CMS1 ("MSI Immune" subtype) is highly hypermutated, immune-enriched, and responds best to immunotherapy.
C. Therapy Selection (Predictive Biomarkers)
- PD-L1 IHC (TPS ≥ 50% for pembrolizumab monotherapy in NSCLC first-line).
- TMB-High (≥ 10 mutations/Mb): Tissue-agnostic FDA approval for pembrolizumab.
- MSI-H/dMMR: Tissue-agnostic approval for pembrolizumab; Lynch syndrome screening.
- EBV+, viral status: Predicts checkpoint inhibitor response in gastric cancer and NPC.
- Pre-therapy immunophenotyping before CAR-T cell therapy (e.g., CD19 expression must be confirmed on B-ALL blast cells).
D. Monitoring Therapy Response
- Serial blood-based immune profiling tracks:
- CD4:CD8 ratio changes during immunotherapy
- Expansion of activated CD8+ T cell clones (favorable)
- Development of immune-related adverse event (irAE) signatures
- Minimal residual disease (MRD) by flow cytometry in leukemia post-therapy
E. Clinical Trial Design
- Immune profiling enables patient stratification for immunotherapy trials (e.g., "cold" vs "hot" tumors for combination vs monotherapy strategies).
- Identification of resistance mechanisms (e.g., reduced TIL infiltration after checkpoint inhibitor failure) guides second-line strategy.
8. Checkpoint Inhibition - The Clinical Culmination of Immune Profiling
| Drug | Target | Key Approvals |
|---|---|---|
| Ipilimumab | CTLA-4 | Melanoma, NSCLC (combination) |
| Pembrolizumab | PD-1 | NSCLC, melanoma, HNSCC, MSI-H tumors, TMB-H tumors, gastric, cervical, endometrial, TNBC, biliary, colorectal, many others |
| Nivolumab | PD-1 | NSCLC, melanoma, RCC, HCC, gastric, bladder, esophageal, CRC (MSI-H) |
| Atezolizumab | PD-L1 | NSCLC, HCC (+ bevacizumab via IMbrave150), TNBC |
| Durvalumab | PD-L1 | NSCLC, SCLC (+ chemotherapy) |
| Avelumab | PD-L1 | Merkel cell carcinoma, urothelial |
- Anti-CTLA-4: Blocks Treg-mediated suppression at lymph nodes; broadens TCR repertoire for tumor neoantigens.
- Anti-PD-1/PD-L1: Reverses T-cell exhaustion in the TME; restores cytolytic function of tumor-infiltrating CD8+ T cells.
Harrison's 22E: "Optimal PD-1 antibody-mediated checkpoint inhibition is seen when infiltrating CD8 T cells are present in the tumor microenvironment and reversal of the exhausted T-cell state can occur in situ."
9. Emerging and Current Updates (2025-2026)
A. Multi-omic / Single-Cell Profiling
- scRNA-seq + spatial transcriptomics integration is now standard in translational oncology. 12 conserved "tumor immune archetypes" have been identified across 12 tumor types from 364 surgical specimens, enabling pan-cancer immune classification.
- CRISPR-based functional screens (e.g., Manguso Laboratory, MGH 2025-26) have identified novel immunotherapy targets including PTPN2 (tyrosine phosphatase) and ADAR1 (dsRNA-editing enzyme) as key mediators of immunotherapy sensitivity and resistance.
B. Next-Generation Checkpoint Inhibitors
- LAG-3 inhibitors (relatlimab + nivolumab - FDA approved for melanoma as "RELATIVITY-047" regimen).
- TIGIT inhibitors (vibostolimab, tiragolumab) - in phase III trials.
- TIM-3 inhibitors in combination trials.
- TOX transcription factor inhibition - emerging strategy to reverse T-cell exhaustion synergistically with checkpoint blockade.
C. Combination Strategies Based on Immune Profile
- Immune profiling-guided combinations: checkpoint inhibitors + targeted therapy (BRAF inhibitors + anti-PD-1 in melanoma), + antibody-drug conjugates, + CAR-T cells.
- "Cold" to "Hot" TME conversion: Strategies using radiation, oncolytic viruses, innate immune agonists (STING agonists) to remodel immunosuppressive TMEs - patient selection guided by immune profiling.
D. Resistance Mechanisms (Identified by Immune Profiling)
- Reduced TIL infiltration post-ICB
- Increased MDSC/Treg populations
- Loss of MHC-I expression
- SERPINB9 (PI-9) upregulation blocking granzyme B
- STK11/KEAP1 mutations in NSCLC (creates immunosuppressive TME, predicts poor response to PD-1 inhibitors)
E. CAR-T Cell Therapy and Immune Profiling
- Pre-infusion immune profiling of the recipient predicts CAR-T engraftment and efficacy.
- Profiling identifies optimal T cell phenotypes for manufacturing (stem cell memory T cells > central memory > effector memory).
- Post-infusion monitoring tracks CAR-T persistence and cytokine release syndrome (CRS) - characterized by IL-6, IFN-γ, ferritin elevation.
[Prostate cancer CAR-T therapy systematic review, BMC Cancer 2026 (PMID: 41826891)] confirms expanding CAR-T applications require careful immune profiling for patient selection.
10. Molecular Classification Linked to Immune Profiling
Colorectal Cancer (CRC) Consensus Molecular Subtypes (CMS)
| Subtype | Immune Profile | Prognosis |
|---|---|---|
| CMS1 (MSI Immune, 15%) | Hypermutated, immune-enriched, high TIL | Good; best immunotherapy response |
| CMS2 (Canonical, 37%) | Low immune infiltration | Good survival after relapse |
| CMS3 (Metabolic, 13%) | Intermediate | Moderate |
| CMS4 (Mesenchymal, 23%) | Stromal rich, low immune | Worst prognosis |
Pancreatic Adenocarcinoma (PDAC)
- Immunogenic subtype: Rare but more likely to respond to immunotherapy
- Squamous subtype: TP53/KDM6A mutations; poor prognosis
- COMPASS trial validated pre-therapy genomic profiling to predict FOLFIRINOX response
11. Summary Table for Quick Revision
| Aspect | Key Points |
|---|---|
| Definition | Characterization of immune cell composition, function, and molecular markers in tumor/blood |
| Key TME cells | CTLs, NK cells, DCs (anti-tumor); Tregs, M2 TAMs, MDSCs (pro-tumor) |
| Tools | IHC, flow cytometry, CyTOF, scRNA-seq, spatial transcriptomics, NGS, liquid biopsy |
| Key biomarkers | PD-L1, TMB, MSI-H/dMMR, CD8+ TILs, Immunoscore, FOXP3, M1:M2 ratio |
| Immunoscore | Validated in CRC; CD3+/CD8+ cells; better prognostic value than TNM in some studies |
| Clinical use | Diagnosis (heme malignancies), prognosis, therapy selection (ICB), MRD monitoring |
| Checkpoint inhibitors | CTLA-4 (ipilimumab), PD-1 (pembro, nivo), PD-L1 (atezo, durva, avel) |
| Resistance | Low TIL, MDSC/Treg expansion, MHC-I loss, neoantigen loss, IDO upregulation |
| Current updates | scRNA-seq archetypes, LAG-3/TIGIT/TIM-3 inhibitors, PTPN2/ADAR1 targets, CAR-T profiling |
12. Key References
- Cellular and Molecular Immunology, 10th Ed. (Abbas, Lichtman & Pillai) - Chapter 18: Immunity to Tumors
- Robbins & Cotran Pathologic Basis of Disease, 10th Ed. (Kumar, Abbas, Aster) - Chapter on Neoplasia; Breast Cancer TME
- Harrison's Principles of Internal Medicine, 22nd Ed. (2025, McGraw Hill) - Chapters on Checkpoint Inhibition Therapy, Evasion of the Immune System by Cancers, NSCLC Management
- Yamada's Textbook of Gastroenterology, 7th Ed. - Tumor Immune Microenvironment in GI cancers; CRC molecular subtypes
- Harper's Illustrated Biochemistry, 32nd Ed. - Tumor Microenvironment and exosome-mediated signaling
- Goodman & Gilman's Pharmacological Basis of Therapeutics - Ipilimumab, PD-1/PD-L1 pharmacology
- Springer Nature, Medical Oncology (2025): Immune profiling in oncology: bridging the gap between technology and treatment - Current state of the art review
- StatPearls (NCBI): Immunophenotyping - Clinical Significance - Diagnostic applications
- The Immunoscore is a favorite exam topic - know it uses CD3/CD8 markers in CRC and has better prognostic value than TNM in some studies.
- PD-L1, TMB, MSI-H are the three tissue-agnostic/standard biomarkers tested before checkpoint inhibitors - memorize which thresholds trigger which drugs.
- MSI-H/dMMR = pembrolizumab (tissue-agnostic) - connects immune profiling to Lynch syndrome.
- The key message of immune evasion is multiple simultaneous mechanisms - no single biomarker is perfect, hence the need for multi-parameter immune profiling.
- "Cold" vs "Hot" tumor terminology is increasingly used clinically - know what determines each category.
if possible, make it in an easy ,memorable format/Table in a downloadable one page pdf/image..