
digetion and absorption of carbohydrate , fat , rotien in comparison
digestion absorption carbohydrate fat protein small intestine comparison diagram
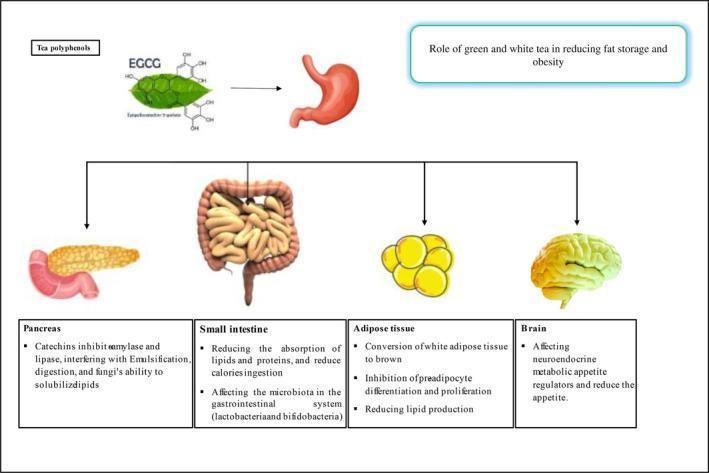
This pathophysiology diagram illustrates the systemic mechanisms by which tea polyphenols, specifically Epigallocatechin gallate (EGCG) from green and white tea, modulate body weight and fat storage. The flow begins with the ingestion of tea polyphenols into the stomach, branching out to four target anatomical areas. 1) Pancreas: Shows inhibition of amylase and lipase, affecting lipid emulsification and digestion. 2) Small Intestine: Depicts reduction in lipid and protein absorption, calorie ingestion, and modulation of gut microbiota (Lactobacteria and Bifidobacteria). 3) Adipose Tissue: Represented as a cluster of adipocytes, it highlights the conversion of white adipose tissue to brown, inhibition of preadipocyte differentiation/proliferation, and reduced lipid production. 4) Brain: Focuses on the modulation of neuroendocrine metabolic appetite regulators to reduce appetite. The diagram serves as an educational summary of how bioactive tea compounds interfere with obesity-related pathways through digestive, metabolic, and neurological interventions.
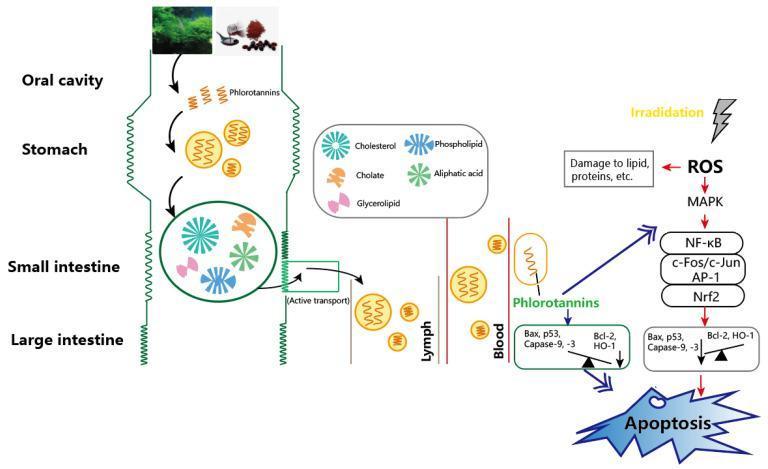
This pathophysiology diagram illustrates the digestive absorption and cellular mechanisms of macroalgae-derived phlorotannins in mitigating radiation-induced damage. The process begins with ingestion through the oral cavity, followed by passage through the stomach and small intestine. A cross-sectional view of the small intestine highlights a mixture of lipid-related molecules, including cholesterol, phospholipids, cholate, glycerolipids, and aliphatic acids. Phlorotannins are shown undergoing active transport from the small intestine into the lymphatic system and subsequently into the bloodstream. At the cellular level, the diagram contrasts two pathways: a radiation-induced damage pathway where irradiation produces Reactive Oxygen Species (ROS), activating the MAPK pathway and pro-inflammatory/pro-apoptotic factors (NF-̄kB, c-Fos/c-Jun, AP-1), leading to lipid/protein damage and apoptosis. In the protective pathway, phlorotannins are depicted as potential blockers that modulate signaling molecules such as Nrf2 and balance the ratio of pro-apoptotic (Bax, p53, Caspase-9, -3) and anti-apoptotic (Bcl-2, HO-1) proteins to inhibit radiation-induced cell death.
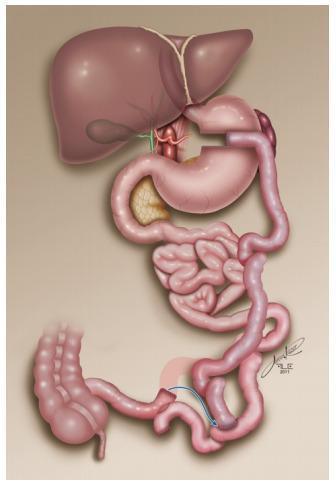
This medical anatomical diagram illustrates a surgical modification of a biliopancreatic diversion (BPD), specifically detailing the elongation of the common loop to treat malnutrition complications. The upper portion of the diagram shows the liver, gallbladder, and a preserved gastric reservoir (stomach). The surgical rearrangement involves the small intestine, highlighting three distinct segments: the biliopancreatic loop (carrying digestive juices), the alimentary (food) loop, and the common loop (where digestion and absorption occur). A blue arrow and shaded area indicate the critical modification: the previous jejunoileal anastomosis has been sectioned, and the alimentary loop is being re-anastomosed further upstream, 1.5 meters from the biliopancreatic loop. This intervention effectively lengthens the common loop, increasing the intestinal surface area available for nutrient absorption. The diagram also depicts the pancreas and the distal large intestine for anatomical context. This visual serves as an educational tool for bariatric surgeons and advanced medical students to understand revisional procedures for managing malabsorption following restrictive-distractive bariatric surgery.
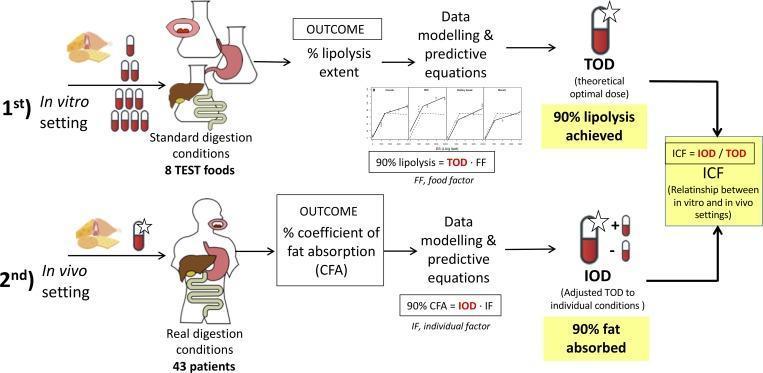
A methodological flow diagram illustrating a two-stage research approach to optimize Pancreatic Enzyme Replacement Therapy (PERT) for patients with Cystic Fibrosis. The top section depicts the first stage: an 'in vitro setting' using laboratory equipment (flasks and tubing) to simulate the human digestive tract (mouth, stomach, liver, and intestine). Eight test foods are processed under standard digestion conditions to measure the '% lipolysis extent.' Data modeling and predictive equations are applied to determine the Theoretical Optimal Dose (TOD) required to achieve 90% lipolysis. The bottom section depicts the second stage: an 'in vivo setting' involving 43 patients under real digestion conditions. The primary outcome is the '% coefficient of fat absorption (CFA).' Subsequent data modeling determines the Individual Optimal Dose (IOD) to achieve 90% fat absorption. The final component links both stages by calculating the Individual Correction Factor (ICF), defined as the ratio of IOD to TOD. This algorithm serves as a clinical pharmacological model to bridge laboratory digestion findings with patient-specific physiological needs to manage malabsorption.
monosaccharide SGLT1 GLUT2 glucose absorption intestinal epithelial cell

This composite educational graphic details the physiological absorption and distribution of orally delivered glucose PET tracers (Me-4FDG, 2-FDG, and 4-FDG) in wild-type and Glut2−/− mouse models. Section A displays volumetric renderings of co-registered microPET and CT scans, utilizing the NIH intensity scale (red: highest; purple: lowest). Key landmarks include the brain (br), stomach (st), intestine (in), kidneys (lk/rk), and bladder (bl). The images demonstrate differential organ uptake based on tracer substrate specificity: Me-4FDG (SGLT1 selective) shows high gastric retention and minimal brain uptake, while 2-FDG and 4-FDG (GLUT selective) exhibit notable accumulation in the brain and urinary bladder. Section B provides scatter plots showing the percentage of gastric emptying at 60 minutes, revealing high variability (range 15–100%) but no significant difference between genotypes. Section C quantifies intestinal tracer absorption, showing nearly complete absorption for Me-4FDG and 4-FDG, with slightly lower and more variable absorption for 2-FDG. This figure is used in metabolic research to study the roles of SGLT1 and GLUT2 transporters in intestinal glucose absorption.
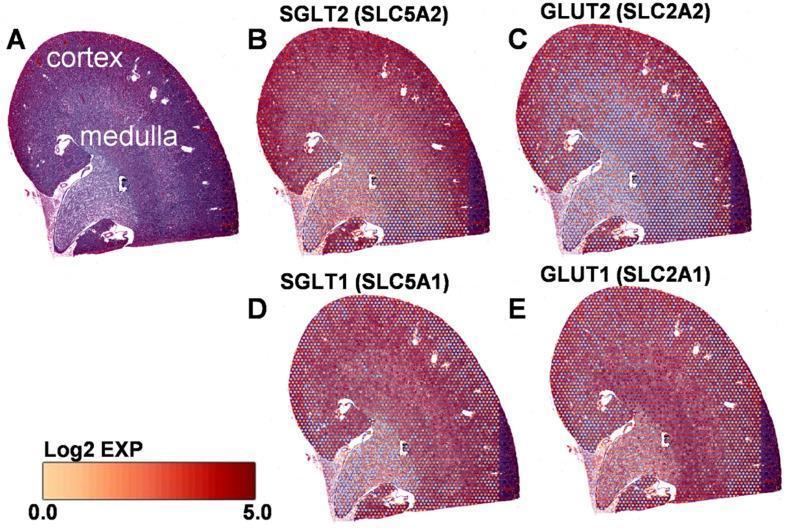
This composite diagnostic image showcases spatial transcriptomics data from a mouse kidney, illustrating the regional distribution of key glucose transporters. Panel A provides a histological reference snapshot, clearly labeling the outer cortex and inner medulla. Panels B through E display the spatial expression patterns for four transporters: SGLT2 (SLC5A2), GLUT2 (SLC2A2), SGLT1 (SLC5A1), and GLUT1 (SLC2A1). A Log2 expression color scale (0.0 to 5.0) at the bottom indicates that warmer red/orange tones represent higher transcript abundance, while cooler purple/blue tones indicate lower expression. The images demonstrate that SGLT2 (Panel B) and GLUT2 (Panel C) are most abundantly expressed within the renal cortex, corresponding to the S1 and S2 segments of the proximal tubules where the majority of glucose reabsorption occurs. Conversely, SGLT1 (Panel D) and GLUT1 (Panel E) show higher expression in the corticomedullary junction and medullary regions, correlating with the S3 segment of the proximal tubule. This visual comparison highlights the functional specialization of renal segments in glucose homeostasis.
lipid fat digestion micelle chylomicron lymph absorption enterocyte
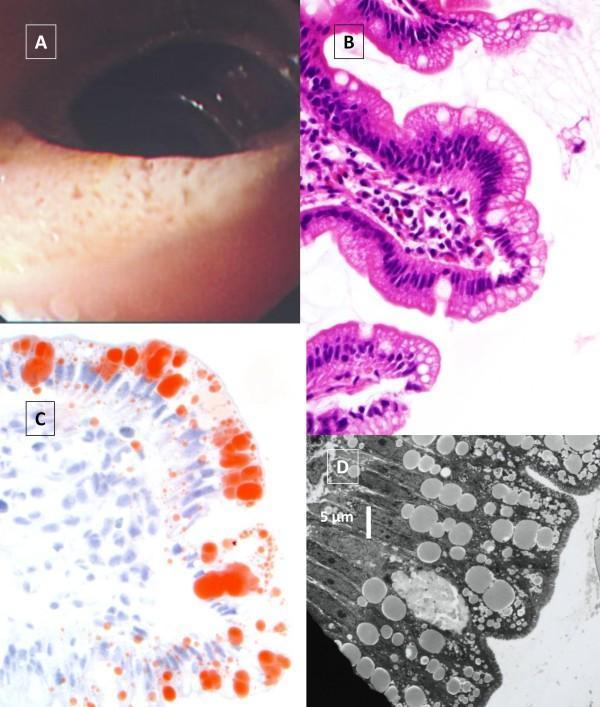
A multi-panel figure illustrating the clinical and histopathological features of a lipid malabsorption disorder, likely Chylomicron Retention Disease or Abetalipoproteinemia. Panel A is a video-endoscopic image of the jejunum showing a characteristic 'white hoary frosting' or white coating on the intestinal mucosa, signifying lipid accumulation. Panel B displays light microscopy of a jejunal biopsy with Hematoxylin and Eosin (H&E) staining, revealing vacuolated enterocytes and preserved villous architecture. Panel C shows the same biopsy stained with Oil Red O, which highlights extensive red-stained neutral lipid droplets specifically localized within the apical cytoplasm of enterocytes at the villous tips. Panel D is an electron micrograph showing the ultrastructural details of an enterocyte, where large, electron-dense lipid droplets and smaller lipoprotein-sized particles are visible within the cytoplasm, confirming defective lipid transport out of the cells. This composite image serves as an educational tool for identifying the diagnostic hallmarks of intestinal fat malabsorption across macroscopic, microscopic, and ultrastructural levels.
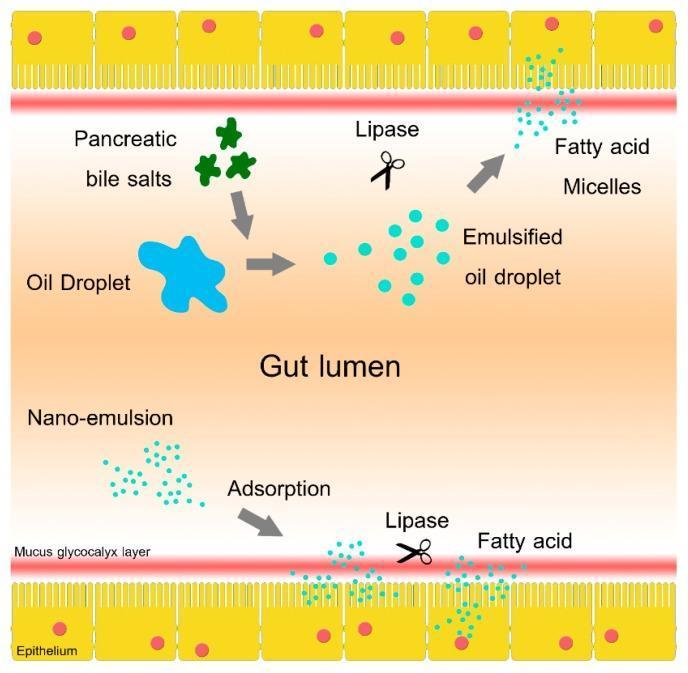
A pathophysiology diagram illustrating two comparative mechanisms of lipid digestion and absorption within the gut lumen. The diagram is bounded by an epithelial layer (yellow columnar cells with red nuclei and microvilli) and a red mucus glycocalyx layer. The upper pathway depicts conventional dietary oil absorption: a large, irregular blue oil droplet is emulsified by green pancreatic bile salts into smaller, uniform turquoise droplets. Lipase (represented by a scissor icon) then acts on these droplets in the central lumen to form fatty acid micelles, which migrate toward the epithelium. The lower pathway depicts a self-emulsified dietary oil mechanism: a nano-emulsion of small turquoise droplets undergoes direct adsorption onto the mucus glycocalyx layer. Lipase activity occurs locally at the glycocalyx-epithelium interface, resulting in the direct release and absorption of free fatty acids. This visual compares standard luminal digestion versus localized adsorption-enhanced bioavailability, focusing on the roles of bile salts, lipase location, and the unstirred mucus layer in nutrient translocation.
Digestion and Absorption of Carbohydrates, Fats, and Proteins - A Comparison
Overview
1. CARBOHYDRATE DIGESTION AND ABSORPTION
Digestion
- α-Dextrinase (isomaltase) - cleaves α-limit dextrins → glucose
- Maltase - cleaves maltose and maltotriose → glucose
- Sucrase - cleaves sucrose → glucose + fructose
- Lactase (lactase-phlorizin hydrolase) - cleaves lactose → glucose + galactose
- Trehalase - cleaves trehalose → 2 glucose
Absorption
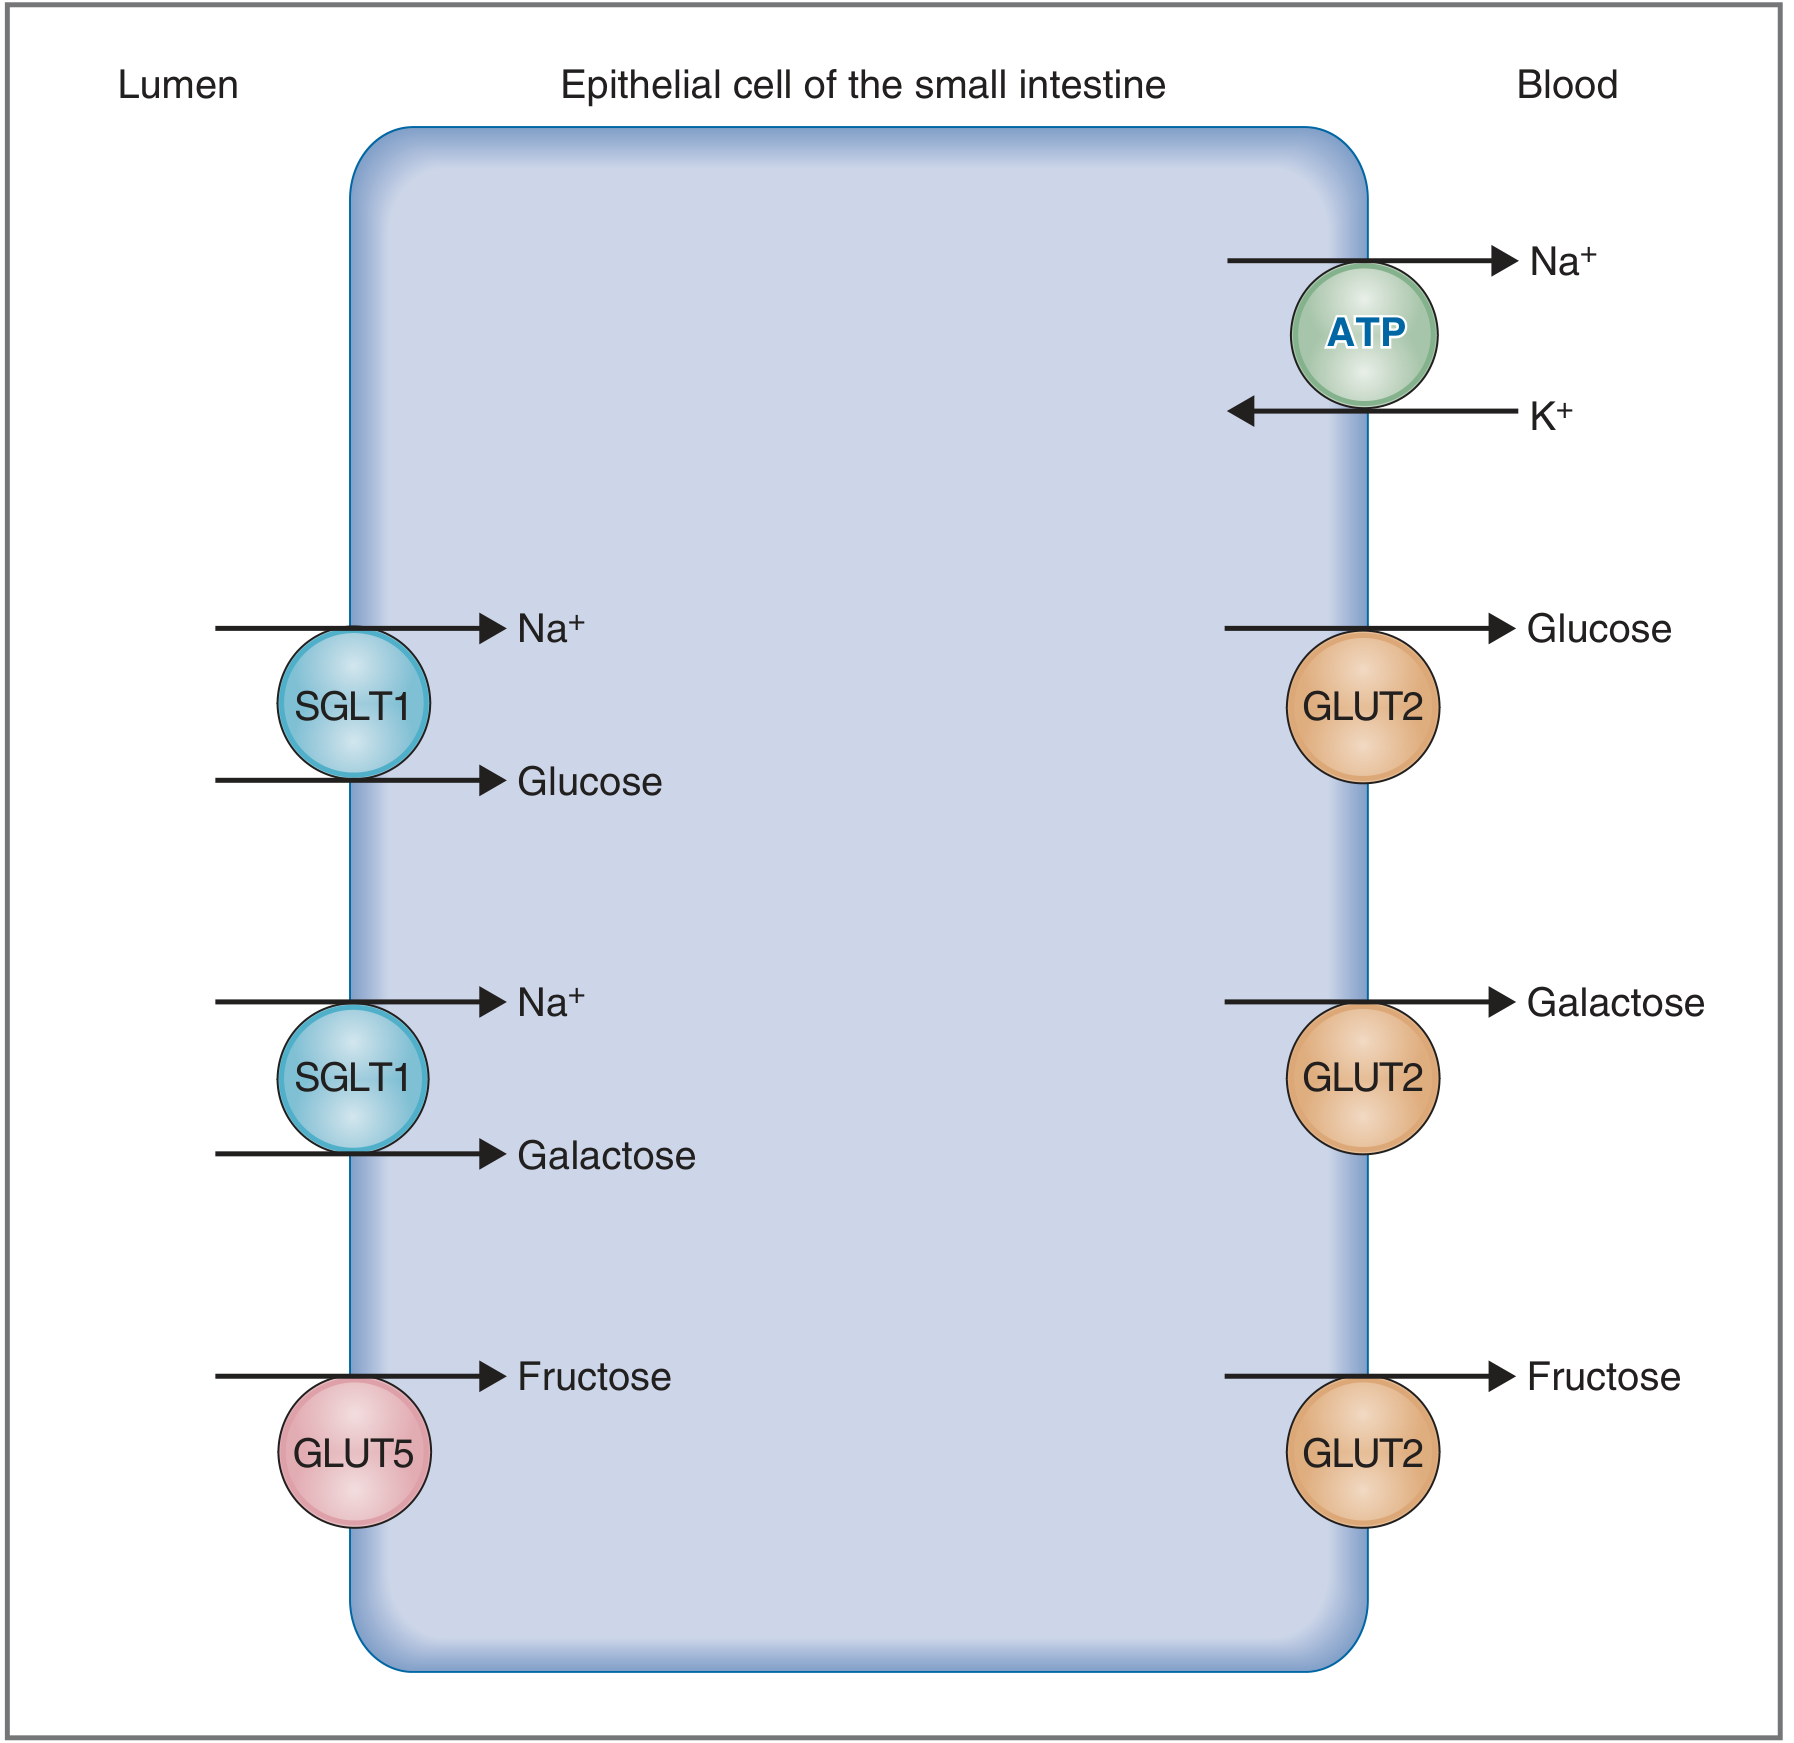
| Sugar | Apical transport | Basolateral exit | Energy |
|---|---|---|---|
| Glucose | SGLT1 (Na+ cotransport) | GLUT2 (facilitated diffusion) | Indirect ATP via Na+/K+-ATPase |
| Galactose | SGLT1 (Na+ cotransport) | GLUT2 | Indirect ATP |
| Fructose | GLUT5 (facilitated diffusion) | GLUT2 | None (passive) |
2. FAT (LIPID) DIGESTION AND ABSORPTION
Digestion
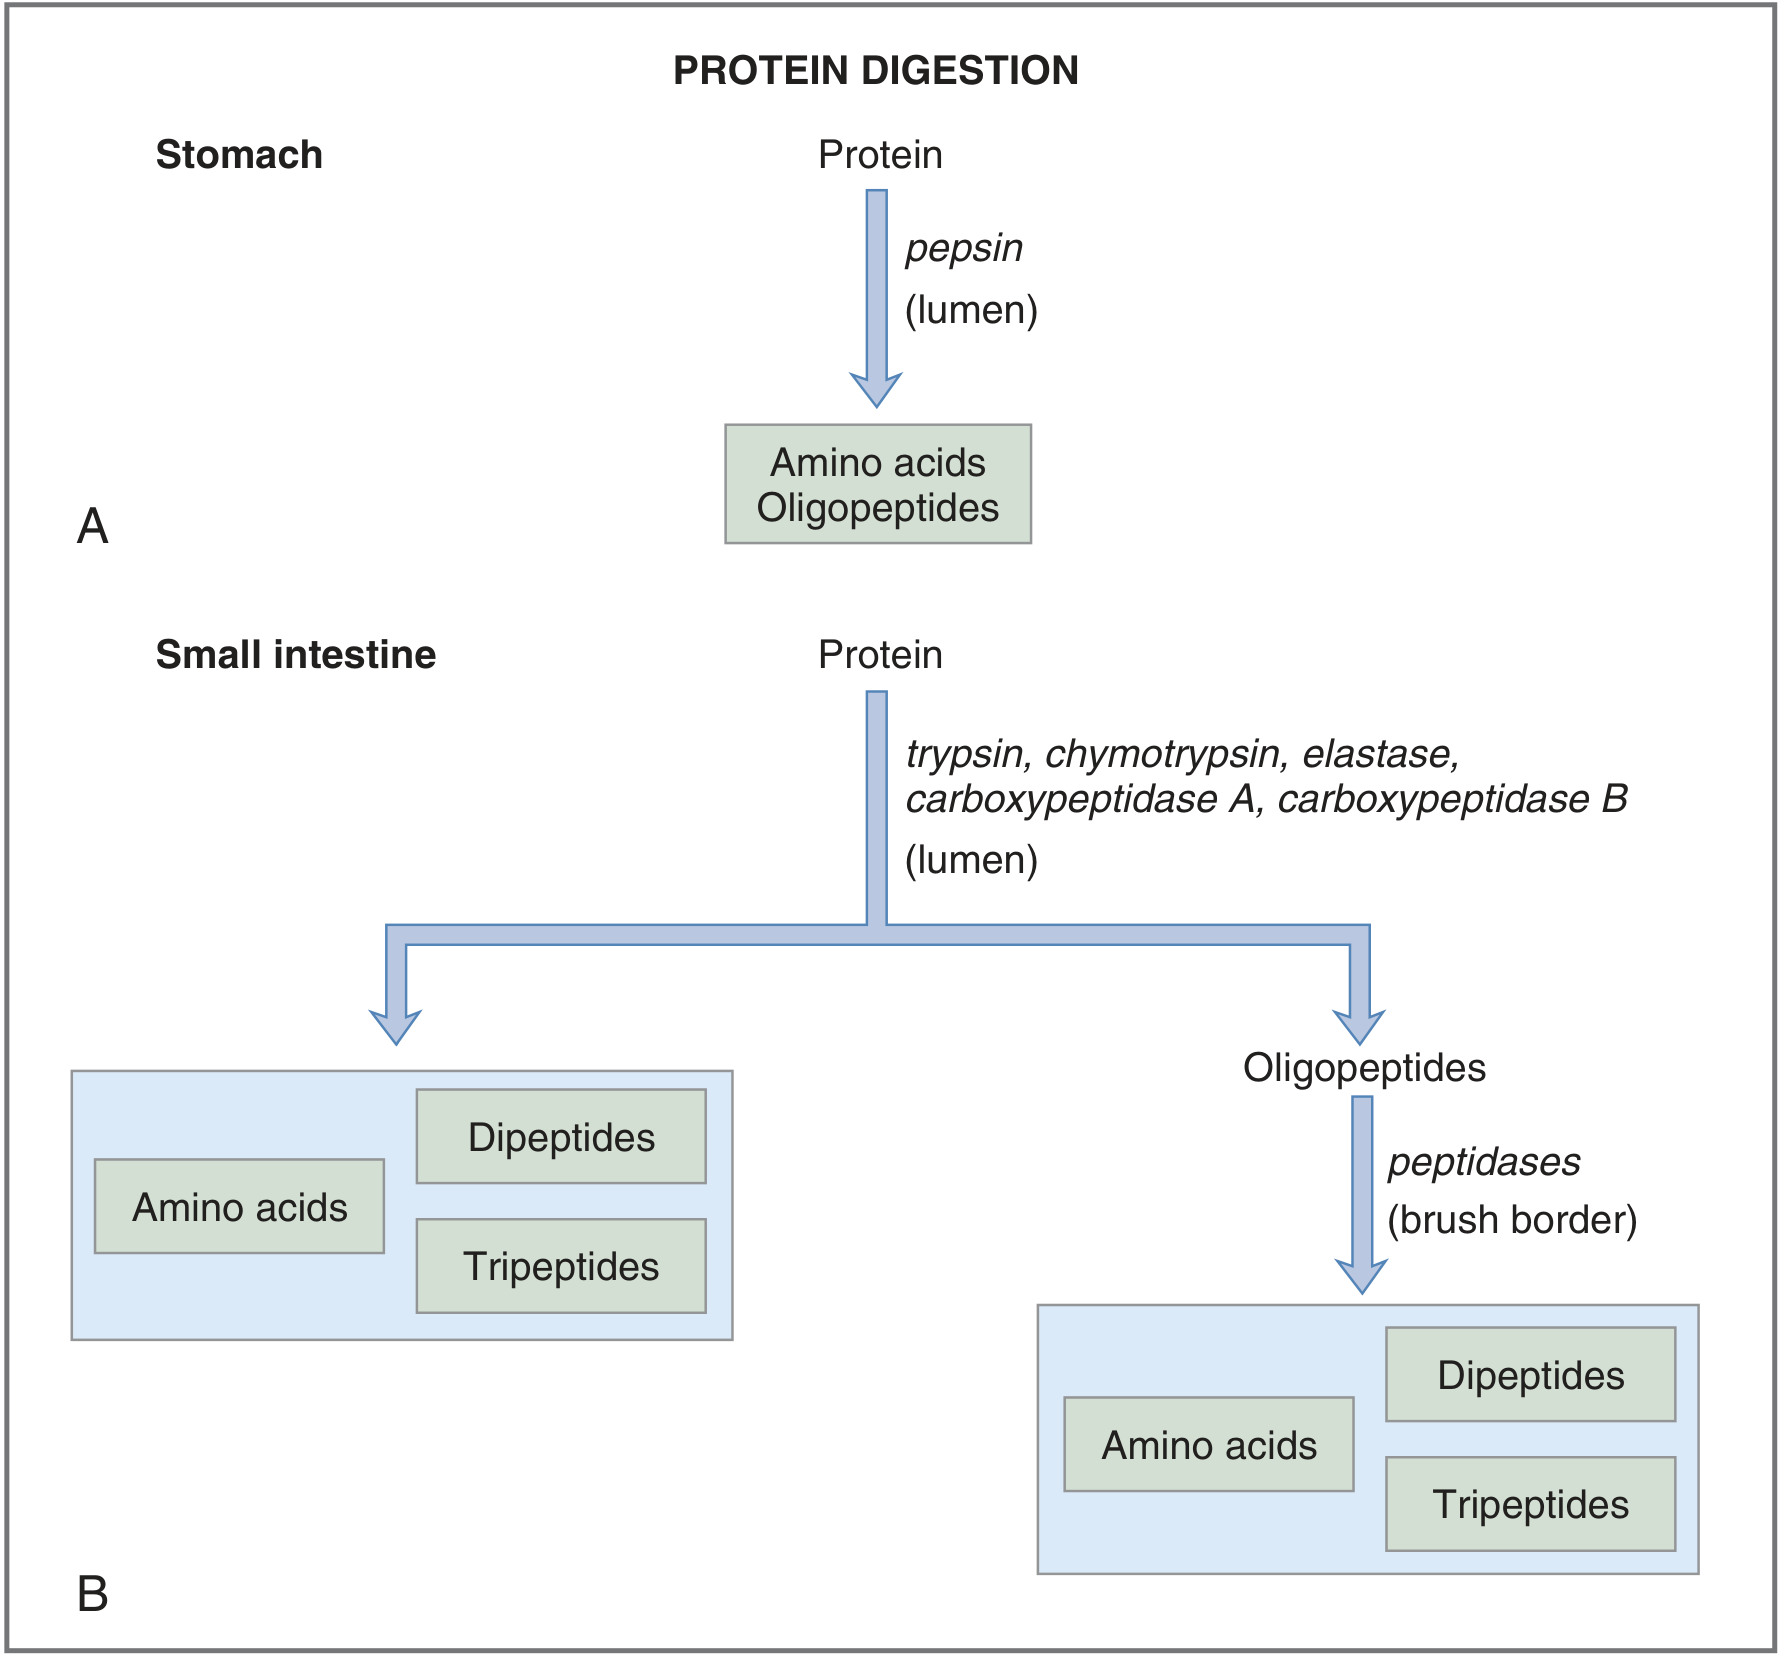
- Pancreatic lipase (most important) - hydrolyzes triglycerides to 1 monoglyceride + 2 free fatty acids. Requires colipase (activated from procolipase by trypsin) to displace inhibitory bile salts and anchor lipase at the lipid-water interface.
- Cholesterol ester hydrolase - hydrolyzes cholesterol esters → free cholesterol + fatty acids
- Phospholipase A2 (secreted as proenzyme, activated by trypsin) - hydrolyzes phospholipids → lysolecithin + fatty acids
Absorption
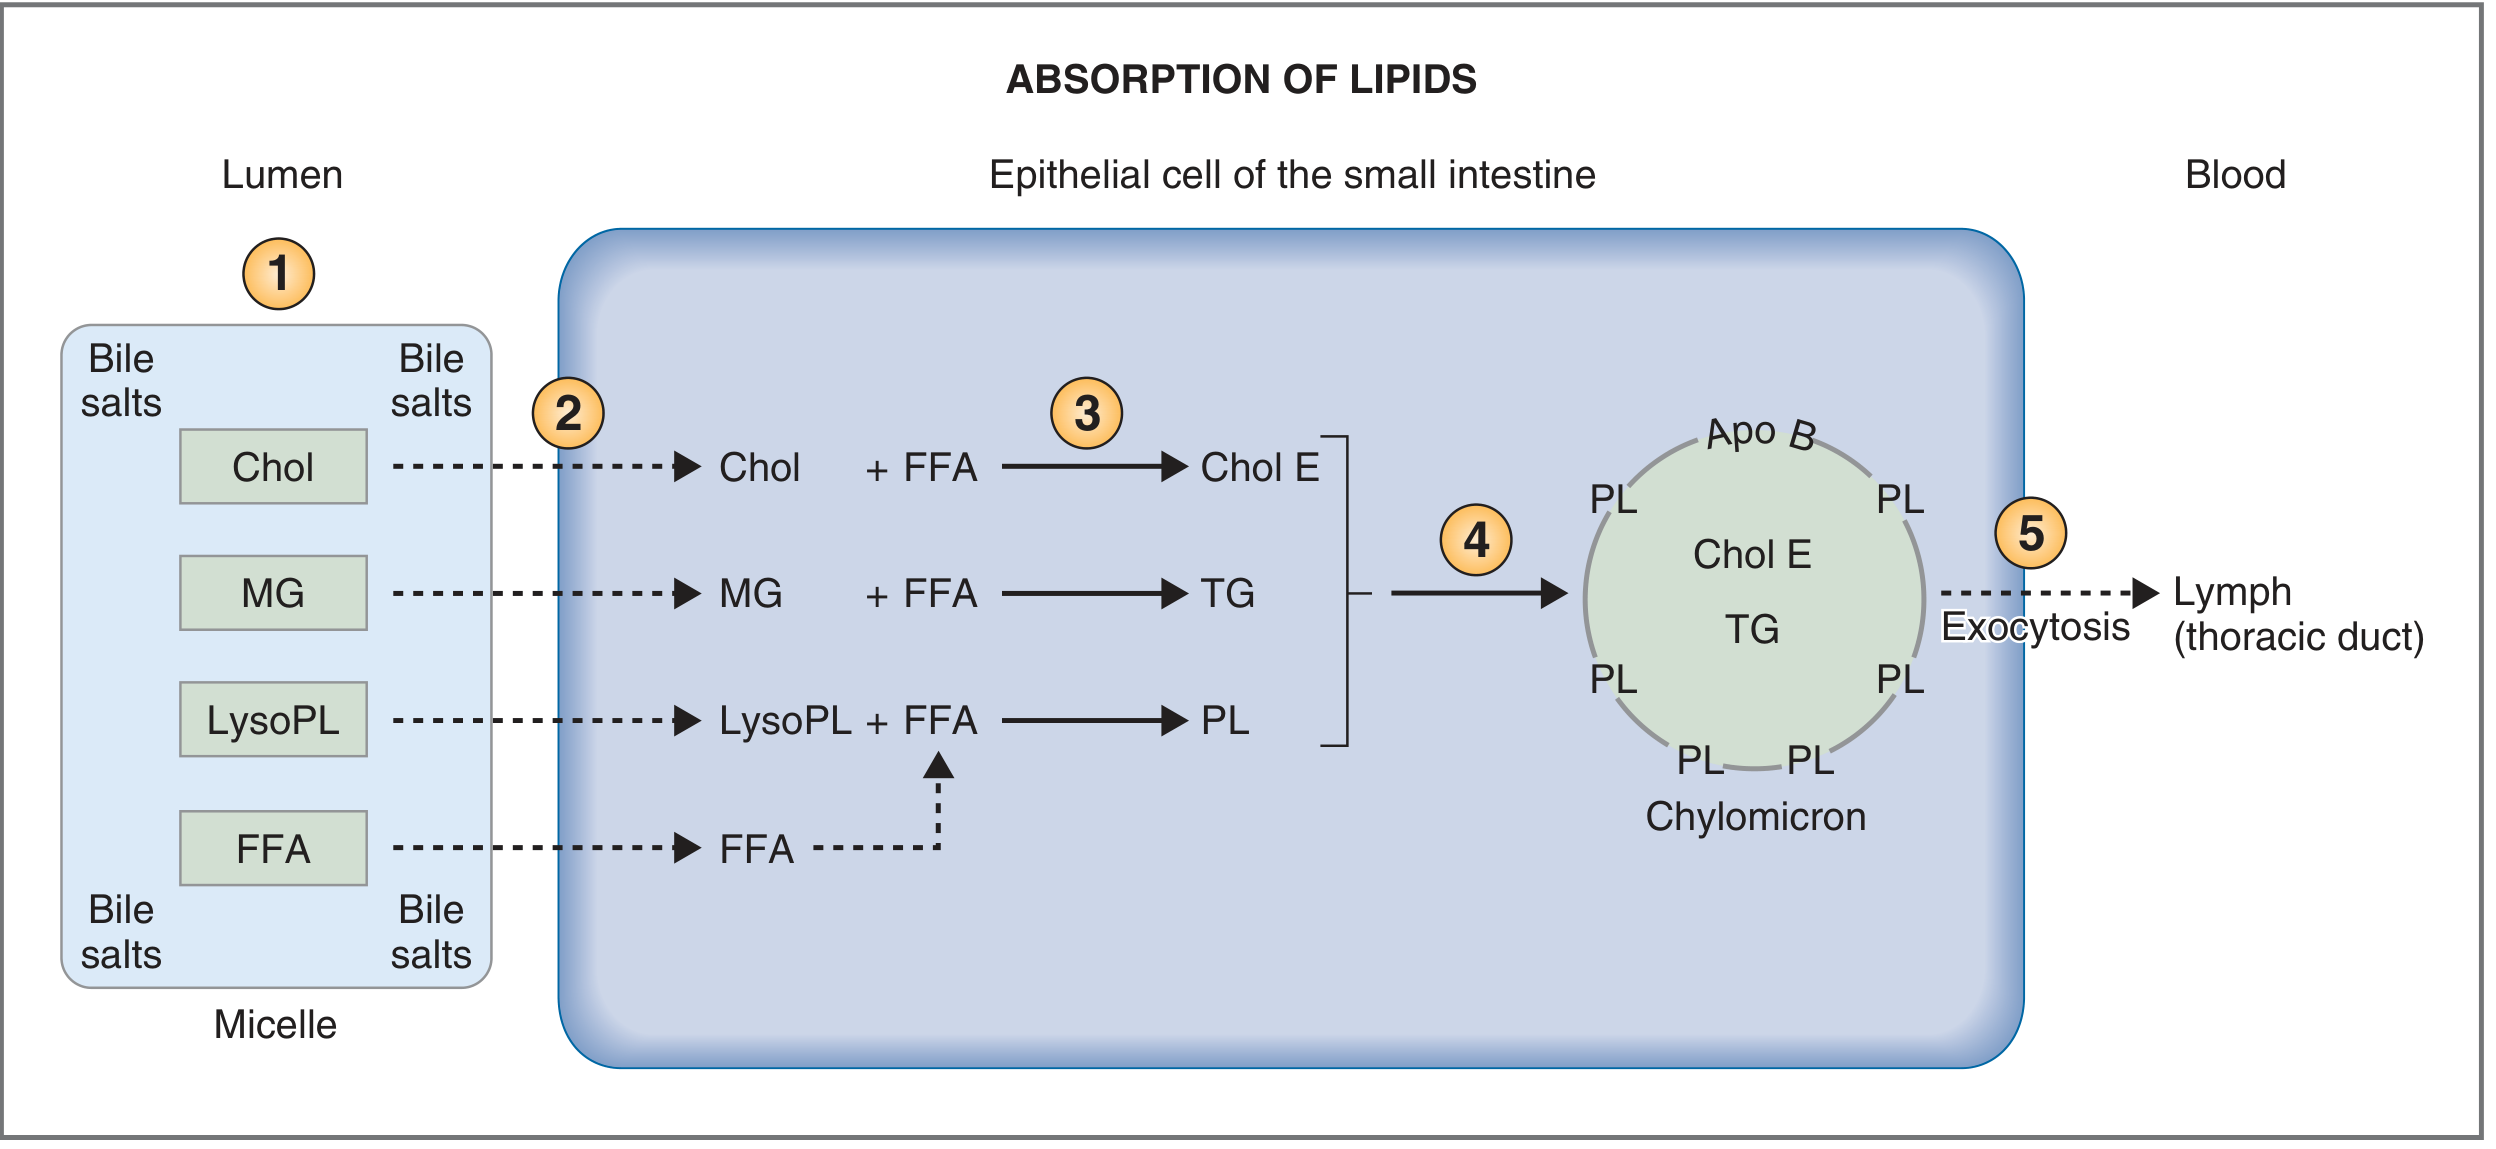
- Micelles diffuse to the apical brush-border membrane; lipid products are released from the micelle and diffuse passively across the membrane (bile salts are left behind in the lumen)
- Inside the enterocyte, monoglycerides and fatty acids are re-esterified on the smooth ER back into triglycerides, cholesterol esters, and phospholipids
- Re-esterified lipids are packaged with apoproteins (especially Apo B-48, synthesized by enterocytes) into chylomicrons (~1000 Å diameter)
- Chylomicrons are packaged in secretory vesicles at the Golgi and undergo exocytosis at the basolateral membrane
- Chylomicrons are too large to enter blood capillaries - they enter the lymphatic lacteals, travel through the thoracic duct, and enter the bloodstream at the subclavian vein
3. PROTEIN DIGESTION AND ABSORPTION
Digestion
| Enzyme | Type | Activated by | Target bonds |
|---|---|---|---|
| Trypsinogen → Trypsin | Endoprotease | Enteropeptidase (brush border) | Lys, Arg bonds |
| Chymotrypsinogen → Chymotrypsin | Endoprotease | Trypsin | Aromatic/neutral AA bonds |
| Proelastase → Elastase | Endoprotease | Trypsin | Small aliphatic AA bonds |
| Procarboxypeptidase A → Carboxy-peptidase A | Exopeptidase | Trypsin | C-terminal aromatic AAs |
| Procarboxypeptidase B → Carboxy-peptidase B | Exopeptidase | Trypsin | C-terminal basic AAs |
Absorption
- More efficient (2-3 amino acids per transport cycle instead of 1)
- Lower osmotic load (fewer particles)
- Basis for enteral nutrition formulations and oral drug delivery (e.g., β-lactam antibiotics, valacyclovir)
COMPARATIVE SUMMARY TABLE
| Feature | Carbohydrate | Fat (Lipid) | Protein |
|---|---|---|---|
| Digestion begins | Mouth | Stomach (preduodenal lipases) | Stomach |
| Gastric digestion | None (amylase inactivated) | Partial (lingual/gastric lipase) | Significant (pepsin) |
| Key luminal enzyme | Pancreatic α-amylase | Pancreatic lipase + colipase | Trypsin, chymotrypsin, elastase |
| Brush-border role | Disaccharidase enzymes (essential) | Not required for absorption | Oligopeptidases (some digestion) |
| Intracellular digestion | None | Re-esterification (reverse synthesis) | Di/tripeptides → AAs inside cell |
| Absorbable form | Monosaccharides ONLY | Passive diffusion of FFA, MG | Free AAs + dipeptides + tripeptides |
| Apical transporter | SGLT1 (Na+), GLUT5 (facilitated) | Passive diffusion (no transporter) | PepT1 (H+), Na+-AA cotransporters |
| Requires bile salts | No | Yes (emulsification + micelles) | No |
| Post-absorptive packaging | None | Chylomicrons (large particles) | None |
| Exit route | Portal blood | Lymphatics (thoracic duct) | Portal blood |
| Complexity | Moderate | Highest (most steps) | Moderate |
| Site of absorption | Proximal small intestine (jejunum) | Proximal-mid jejunum | Small intestine (proximal) |
| Clinical failure (example) | Lactase deficiency → osmotic diarrhea | Bile salt deficiency / pancreatic insufficiency → steatorrhea | Pancreatic insufficiency → protein malabsorption |
KEY CONCEPTUAL DIFFERENCES
-
Luminal vs. Intracellular completion: Carbohydrate digestion is completed entirely outside the cell (luminal + brush-border). Protein digestion is partially completed inside the enterocyte. Fat undergoes intracellular re-synthesis.
-
Unit of absorption: Carbohydrates must be monosaccharides. Proteins can be absorbed as di/tripeptides (actually the preferred route). Fats diffuse passively as free fatty acids and monoglycerides.
-
Exit from enterocyte: Carbohydrates and amino acids enter portal blood directly. Long-chain fatty acids exit as chylomicrons into lymph and bypass the portal circulation - an important distinction with metabolic consequences (e.g., fat-soluble vitamin absorption, drug delivery).
-
Energy requirement: Glucose/galactose require Na+-cotransport (active, ATP-dependent indirectly). Fructose and fat absorption are passive. Amino acid and peptide absorption are active (Na+- or H+-dependent).
-
Bile salts: Only fat digestion requires bile salts. Loss of bile salts (e.g., ileal resection interrupting enterohepatic circulation) causes fat malabsorption (steatorrhea) but leaves carbohydrate and protein absorption largely intact.