
Heart failure
"heart failure" management
heart failure pathophysiology diagram
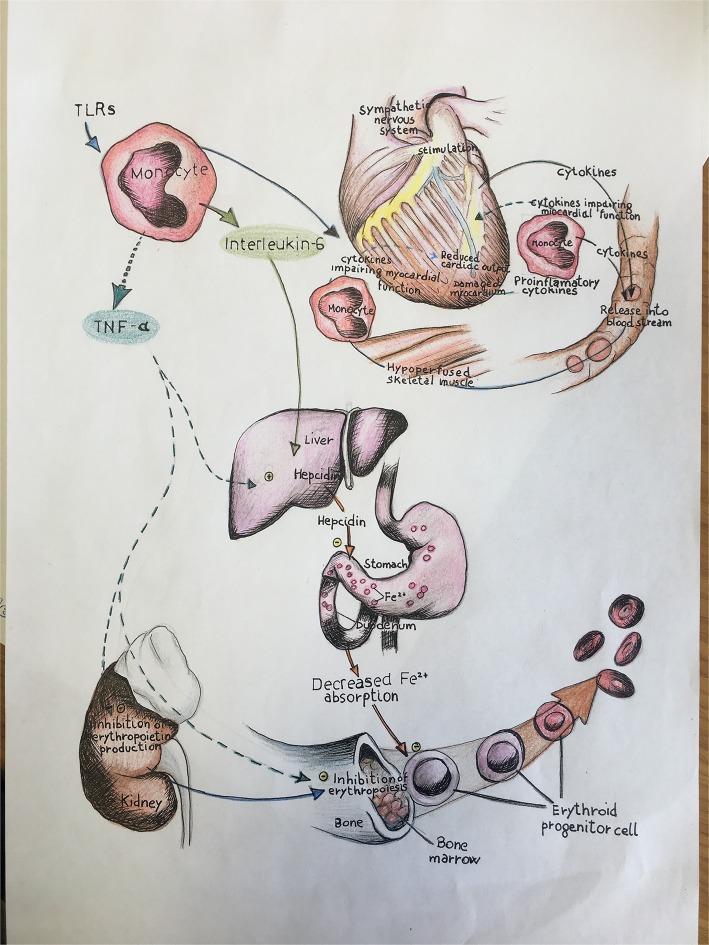
A pathophysiology diagram illustrating the multi-organ impact of immune-mediated inflammation in heart failure, specifically linking systemic cytokines to iron deficiency and anemia. The top of the schematic depicts a heart under stress, showing sympathetic nervous system stimulation, damaged myocardium, and reduced cardiac output. Monocytes activated via Toll-like receptors (TLRs) release pro-inflammatory cytokines, including Interleukin-6 (IL-6) and Tumor Necrosis Factor-alpha (TNF-α). The diagram shows IL-6 stimulating the liver to produce hepcidin, which inhibits Fe2+ absorption in the duodenum. Concurrently, TNF-α is shown causing the inhibition of erythropoietin production in the kidney and directly inhibiting erythropoiesis in the bone marrow. This suppression of erythroid progenitor cells, combined with decreased iron bioavailability, illustrates the mechanism behind the anemia of chronic disease and its role in worsening heart failure progression. The visual integrates cardiology, immunology, and hematology concepts, specifically targeting the clinical triad of inflammation, iron deficiency, and myocardial dysfunction.
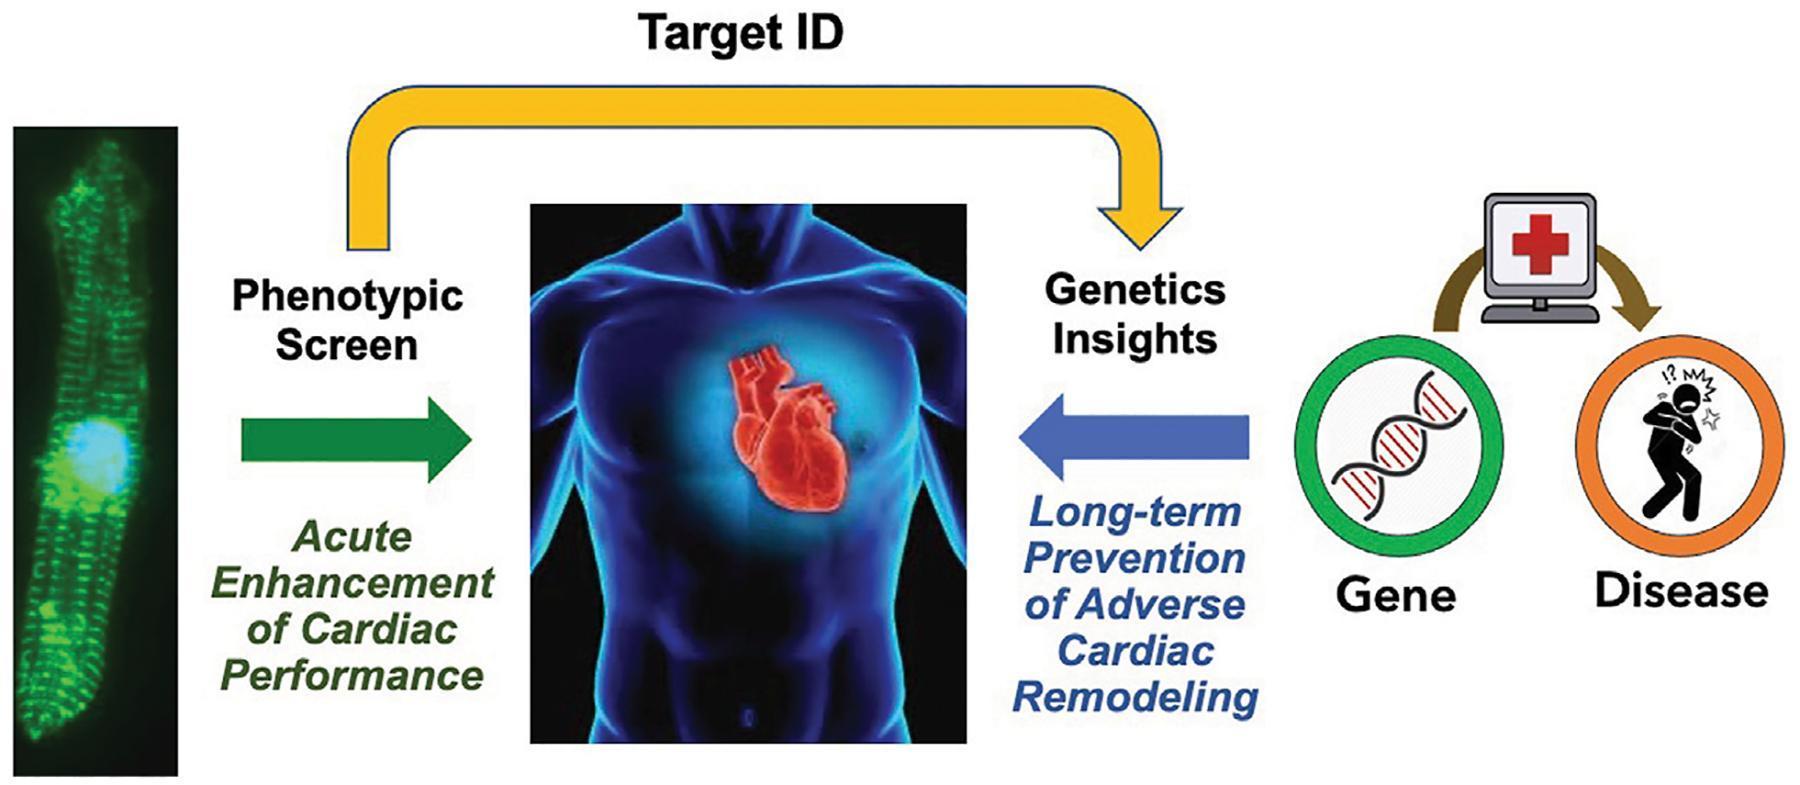
This pathophysiology and drug discovery diagram illustrates a conceptual framework for bridging the 'therapeutic divide' in heart failure treatment. The flowchart progresses from left to right, starting with a fluorescence microscopy image of a cardiomyocyte, representing a 'Phenotypic Screen.' A green arrow labeled 'Acute Enhancement of Cardiac Performance' points toward a blue anatomical rendering of a human torso with a highlighted red heart. A yellow overhead arc labeled 'Target ID' connects the phenotypic screen to a 'Genetics Insights' section. This section features a green 'Gene' icon containing a DNA double helix. A blue arrow directed back toward the heart represents the 'Long-term Prevention of Adverse Cardiac Remodeling.' On the far right, a brown arc connects the genetic data to a 'Disease' icon, depicting a human figure in distress, signifying the clinical phenotype. The diagram summarizes a translational approach that combines acute functional screening with genomic validation to identify therapeutics that provide both immediate hemodynamic benefits and favorable long-term cardiac remodeling outcomes.
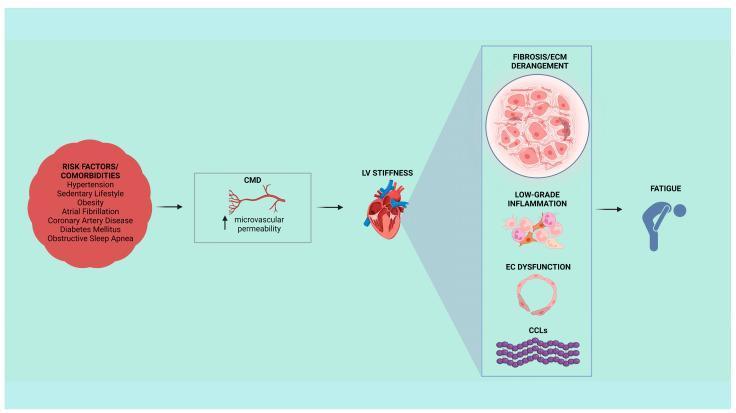
This pathophysiology diagram illustrates the clinical and cellular progression of heart failure with preserved ejection fraction (HFpEF). The flowchart begins with a list of risk factors and comorbidities (Hypertension, Sedentary Lifestyle, Obesity, Atrial Fibrillation, Coronary Artery Disease, Diabetes Mellitus, and Obstructive Sleep Apnea). These factors lead to Coronary Microvascular Dysfunction (CMD), characterized by increased microvascular permeability. The progression continues to Left Ventricular (LV) stiffness, depicted by a cardiac anatomical model. A magnified panel details the underlying molecular mechanisms of LV stiffness: 1) Fibrosis/Extracellular Matrix (ECM) derangement showing disorganized tissue, 2) Low-grade inflammation featuring activated immune cells, 3) Endothelial cell (EC) dysfunction represented by a circular vessel structure, and 4) Collagen Cross-Links (CCLs) depicted as wavy purple fibrils. The final stage of the cascade results in the clinical symptom of fatigue, symbolized by a silhouette of a person bent over. This diagram is designed for intermediate to advanced medical learners to understand the multifaceted etiology and structural changes driving HFpEF symptoms.
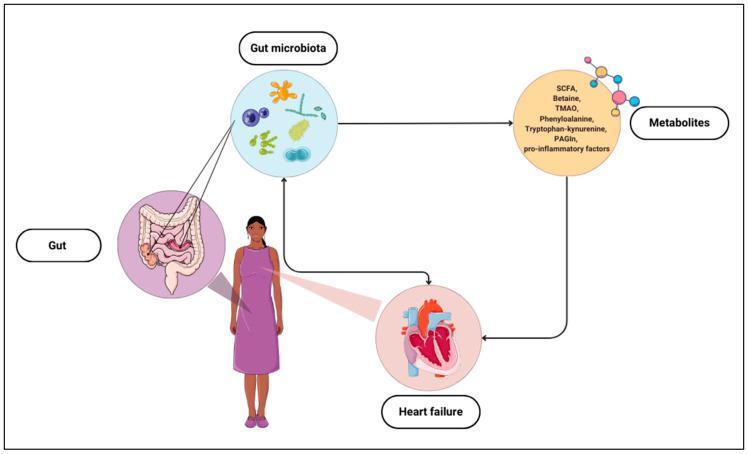
A pathophysiology diagram illustrating the bidirectional relationship between the gut microbiome and heart failure. The schematic features a central female human figure connected to circular insets representing the 'Gut' (anatomical intestine illustration) and 'Heart failure' (pathological heart cross-section). A light blue circle labeled 'Gut microbiota' displays various bacterial morphologies, with a directed arrow leading to a 'Metabolites' circle. This metabolite list includes short-chain fatty acids (SCFA), Betaine, Trimethylamine N-oxide (TMAO), Phenylalanine, Tryptophan-kynurenine, Phenylacetylglutamine (PAGIn), and pro-inflammatory factors. Further arrows indicate a feedback loop where the gut microbiota influences systemic metabolites, which in turn impact heart failure progression. Conversely, heart failure is shown to exert a reciprocal influence back on the gut microbiota, emphasizing the 'gut-heart axis.' This diagram is intended for medical education regarding cardiovascular disease mechanisms and the metabolic role of microbial dysbiosis in systemic health.
Heart Failure
Definition
- Textbook of Family Medicine, 9e
Classification
By Ejection Fraction
| Type | LVEF | Description |
|---|---|---|
| HFrEF (reduced EF) | < 40% | Systolic dysfunction; impaired LV contraction |
| HFmrEF (mildly reduced EF) | 40-49% | Shares features of both phenotypes |
| HFpEF (preserved EF) | ≥ 50% | Diastolic dysfunction; impaired LV filling/relaxation |
| HFrecEF (recovered EF) | Previously low, now > 40% | EF normalized with treatment; relapse risk on withdrawal |
- Fuster and Hurst's The Heart, 15th Ed
ACCF/AHA Stages vs. NYHA Functional Classes
| ACCF/AHA Stage | Description | NYHA Class |
|---|---|---|
| A | High risk, no structural disease, no symptoms | None |
| B | Structural heart disease, no symptoms | I |
| C | Structural disease with prior/current symptoms | I - III |
| D | Refractory HF requiring specialized interventions | IV |
- Fuster and Hurst's The Heart, 15th Ed
Epidemiology
- Over 650,000 new cases diagnosed annually in the US
- Mortality remains ~50% within 5 years of diagnosis
-
300,000 deaths/year
- 1-month re-hospitalization rate ~25%
- Estimated costs: $39.2 billion (2010)
Pathophysiology
LV Remodeling (Core Mechanism)
Neurohormonal Activation
-
RAAS (Renin-Angiotensin-Aldosterone System)
- Angiotensin II promotes myocyte apoptosis, hypertrophy, and ventricular fibrosis
- Aldosterone augments harmful effects of Ang II and "escapes" ACE inhibition (hence, selective aldosterone blockade is needed in addition to ACE inhibitors/ARBs)
-
Sympathetic Nervous System (SNS)
- Elevated catecholamines cause vasoconstriction, Na+ retention, increased preload/afterload
- Chronic catecholamine excess has direct toxic effects on myocardium and suppresses adrenergic receptors
-
Endothelin-1: Produced by dysfunctional endothelium, contributing to vasoconstriction
-
Inflammatory cytokines (TNF-α, IL-6): Exacerbate endothelial dysfunction and contribute to iron deficiency/anemia of chronic disease
-
Cellular changes: Increased MMPs → cardiac fibrosis and collagen deposition; altered calcium fluxes; shift from fatty acid oxidation to glycolysis
Clinical Features
Symptoms
- Dyspnea (exertional, orthopnea, paroxysmal nocturnal dyspnea)
- Fatigue and reduced exercise tolerance
- Ankle edema
Signs of Congestion
- Elevated JVP, hepatojugular reflux, ascites, peripheral edema
- Pulmonary crackles, S3 gallop
Signs of Reduced Perfusion
- Narrow proportional pulse pressure (< 25%)
- Pulsus alternans
- Cool extremities, impaired mentation
- Symptomatic hypotension (without orthostasis)
Diagnosis
- Echocardiography: Cornerstone - determines LVEF, wall motion, diastolic function
- BNP/NT-proBNP: Elevated in decompensated HF; note - neprilysin inhibition (sacubitril) raises BNP but not NT-proBNP
- ECG, CXR
- Lab work: CBC, BMP, TSH (screen for anemia, renal dysfunction, thyroid disease)
- Coronary angiography/CT: For patients with LV dysfunction and suspicion of obstructive CAD
- Cardiac MRI: For infiltrative disease or scar
- Endomyocardial biopsy: Reserved for new-onset HF (<2-3 months) with hemodynamic compromise, new arrhythmias, or failure to respond to therapy
Pharmacologic Treatment
HFrEF: The Four Pillars ("GDMT" - Guideline-Directed Medical Therapy)
1. ARNI (Angiotensin Receptor-Neprilysin Inhibitor) - preferred over ACE inhibitor/ARB
- Sacubitril/valsartan (97/103 mg twice daily) - first-line starting therapy
- Neprilysin inhibition augments natriuretic peptides (vasodilator + natriuretic)
- Combined with ARB (valsartan) because neprilysin + ACE inhibition causes excess bradykinin/angioedema risk
- Reduces HF hospitalization, CV mortality, and all-cause death vs. enalapril (PARADIGM-HF)
- Contraindications: history of angioedema; systolic BP < 95 mmHg; never combine with ACE inhibitor (36-hour washout required)
- Goldman-Cecil Medicine
2. Beta-Blockers
- Counteract harmful SNS hyperactivation
- Three agents with proven mortality benefit: bisoprolol, carvedilol, metoprolol succinate
- Three landmark trials (CIBIS II, COPERNICUS, MERIT-HF) - ~30% reduction in mortality and hospitalization
- COMET showed carvedilol superior to short-acting metoprolol
- Reduces risk of sudden cardiac death
- Fuster and Hurst's The Heart, 15th Ed; Goldman-Cecil Medicine
3. Mineralocorticoid Receptor Antagonist (MRA)
- Spironolactone or eplerenone
- Indicated in NYHA Class III-IV (and post-MI with HFrEF)
- Aldosterone "escapes" RAAS blockade - selective aldosterone blockade provides additional mortality benefit
- Monitor for hyperkalemia and renal function
- Textbook of Family Medicine, 9e
4. SGLT2 Inhibitors
- Dapagliflozin or empagliflozin
- Increases survival, reduces hospital admissions, and improves symptoms/quality of life when added to standard therapy
- Benefit appears independent of diabetes status
- Goldman-Cecil Medicine
Recent evidence (2025): A meta-analysis in Circulation (PMID: 40884036) found dapagliflozin beneficial even in patients hospitalized for acute decompensated heart failure, reinforcing early initiation of SGLT2 inhibitors.
Additional Agents
| Drug | Indication |
|---|---|
| Loop diuretics (furosemide, bumetanide) | Symptomatic congestion; mainstay for edema management |
| Digoxin | Persistent symptoms despite GDMT; reduces hospitalization (no mortality benefit) |
| Ivabradine | Heart rate > 70 bpm in sinus rhythm despite max beta-blocker |
| Hydralazine + Isosorbide dinitrate | ACE/ARB/ARNI intolerant patients; additive benefit in African-Americans |
| IV iron (ferric carboxymaltose) | Iron deficiency with HFrEF - improves symptoms and reduces hospitalizations |
HFpEF Treatment
- Aggressive BP control (target < 130/85 mmHg)
- Diuretics for symptomatic congestion
- Beta-blockade or non-dihydropyridine CCBs (diltiazem, verapamil) for rate control
- ACE inhibitors/ARBs - may reduce LVH and improve LV compliance
- SGLT2 inhibitors - emerging evidence for symptom benefit and reduced hospitalizations
- Treat underlying risk factors: obesity, AF, diabetes, sleep apnea, CAD
Non-Pharmacologic Management
- Sodium restriction: Reduce to < 2 g/day
- Fluid restriction: Typically 1.5-2 L/day in severe HF
- Daily weight monitoring: Alert for > 2 kg gain in 24-48 hours
- Exercise rehabilitation: Cardiac rehab programs improve functional capacity and quality of life
- Smoking cessation, alcohol avoidance
- Vaccination: Influenza and pneumococcal vaccines strongly recommended
Device Therapy
| Device | Indication |
|---|---|
| ICD (Implantable Cardioverter-Defibrillator) | LVEF ≤ 35%, NYHA II-III, > 3 months optimal medical therapy, life expectancy > 1 year |
| CRT (Cardiac Resynchronization Therapy) | LVEF ≤ 35%, LBBB with QRS ≥ 150 ms, NYHA II-IV |
| LVAD (LV Assist Device) | Stage D/refractory HF as bridge to transplant or destination therapy |
| Heart transplant | Stage D, otherwise suitable candidates |
Risk Factor Modification
- Treat HTN aggressively (strong link to HF development)
- Dyslipidemia and diabetes control
- Screen and treat sleep apnea and thyroid disease
- Evaluate palpitations for tachycardia-induced cardiomyopathy
- Weight loss and regular exercise
Prognosis Markers
| Marker | Implication |
|---|---|
| Elevated BNP/NT-proBNP | Worse prognosis |
| Rapid heart rate in sinus rhythm | Independent adverse prognostic factor |
| Narrow proportional pulse pressure | Reduced output, worse prognosis |
| NYHA Class IV | 1-year mortality 40-50% |
| Iron deficiency + anemia | Worsens prognosis |
- Textbook of Family Medicine, 9e (Family Medicine)
- Fuster and Hurst's The Heart, 15th Ed (Cardiology)
- Goldman-Cecil Medicine (Internal Medicine)
- Braunwald's Heart Disease, 2-Vol Set (Cardiovascular Medicine)
- Recent: DAPA ACT HF-TIMI 68 + SGLT2i meta-analysis, Circulation 2025 (PMID: 40884036)
Diabates
"diabetes mellitus" management
diabetes mellitus type 1 type 2 pathophysiology diagram
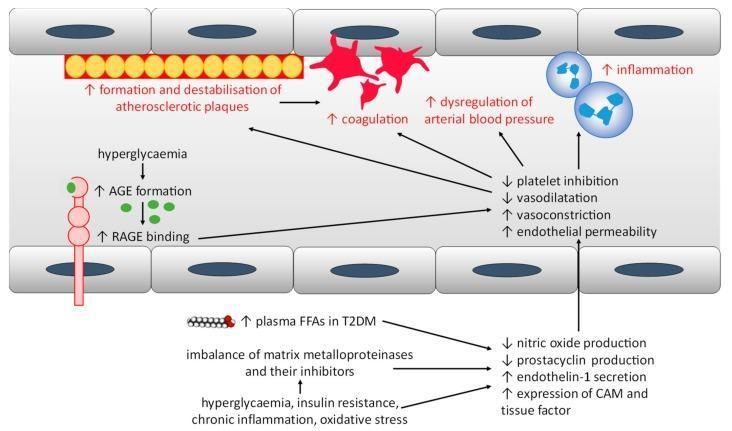
A pathophysiology diagram illustrating the mechanisms of endothelial dysfunction and increased cardiovascular risk in Type 1 and Type 2 Diabetes Mellitus. The diagram shows a cross-section of a blood vessel lined with endothelial cells. The upper section depicts pathological outcomes including the formation and destabilization of atherosclerotic plaques, increased coagulation (platelet aggregation), dysregulation of arterial blood pressure, and increased inflammation. Centrally, a list summarizes the resulting vascular environment: decreased platelet inhibition and vasodilation, alongside increased vasoconstriction and endothelial permeability. The lower section outlines the biochemical triggers: hyperglycemia leading to advanced glycation end-product (AGE) formation and RAGE binding; elevated plasma free fatty acids (FFAs); and imbalances in matrix metalloproteinases. These factors, alongside insulin resistance and oxidative stress, drive the dysfunction by decreasing nitric oxide and prostacyclin production while increasing endothelin-1, tissue factor, and cell adhesion molecule (CAM) expression. The diagram serves as a conceptual map connecting metabolic derangements to clinical macrovascular and microvascular complications.
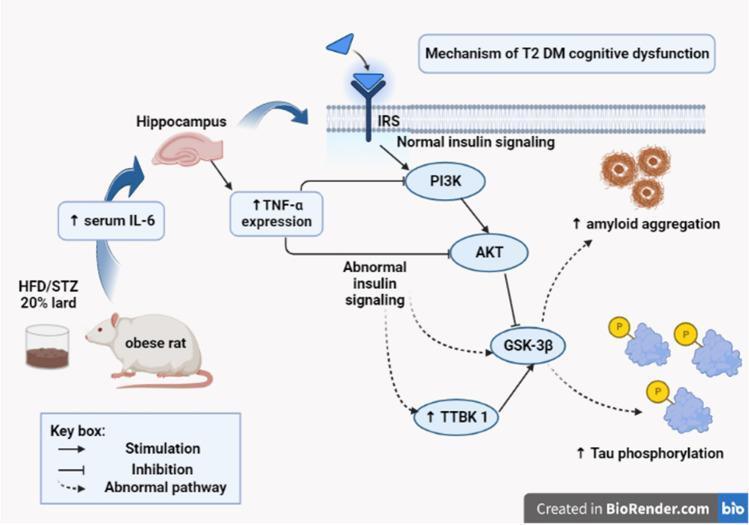
A pathophysiology diagram illustrating the molecular mechanisms linking Type 2 Diabetes Mellitus (T2DM) to cognitive dysfunction. The pathway begins with a High-Fat Diet (HFD) and Streptozotocin (STZ) induction in a rat model, leading to increased serum Interleukin-6 (IL-6) and subsequent hippocampal TNF-α expression. This inflammatory state disrupts normal insulin signaling at the Insulin Receptor Substrate (IRS) level. Under normal conditions, IRS stimulates the PI3K/AKT pathway. However, the diagram shows an 'abnormal pathway' where increased TNF-α leads to decreased PI3K and AKT activity. This downregulation fails to inhibit Glycogen Synthase Kinase 3 beta (GSK-3β). Simultaneously, there is an upregulation of Tau Tubulin Kinase 1 (TTBK 1). The synergistic effect of increased GSK-3β and TTBK 1 activity drives the hallmark pathological features of Alzheimer-like neurodegeneration: increased amyloid aggregation and increased tau phosphorylation. The diagram uses solid arrows for stimulation, T-bars for inhibition, and dashed arrows to represent abnormal disease-state pathways.
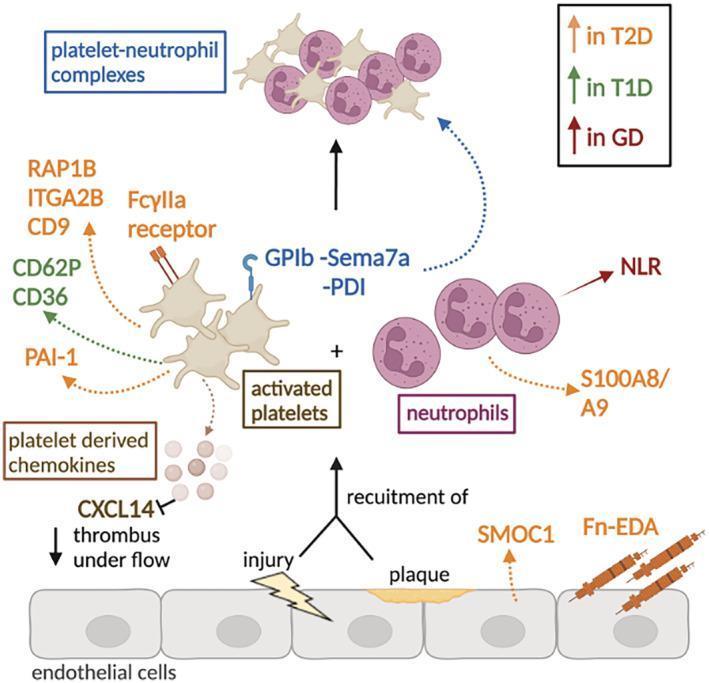
This pathophysiology diagram illustrates the cellular and molecular mechanisms of thromboinflammation associated with different types of diabetes mellitus. The diagram depicts the vascular environment following endothelial injury or atherosclerotic plaque rupture, which triggers the recruitment of platelets and neutrophils. Key pathways are color-coded by clinical context: orange for Type 2 Diabetes (T2D), green for Type 1 Diabetes (T1D), and dark red for Gestational Diabetes (GD). In T2D, there is an upregulation of Fn-EDA, SMOC1, RAP1B, ITGA2B, CD9, FcγIIa, and neutrophil S100A8/A9. In T1D, activation markers CD62P and CD36 are increased on platelets. GD is associated with an elevated neutrophil:lymphocyte ratio (NLR). The central educational focus is the formation of 'platelet-neutrophil complexes' mediated by interactions such as GPIb, Sema7a, and PDI. The diagram also shows platelet-derived chemokines, specifically noting that CXCL14 inhibition leads to decreased thrombus formation under flow. This visualization serves as a map for potential therapeutic targets to reduce thrombotic risk in diabetic patients.
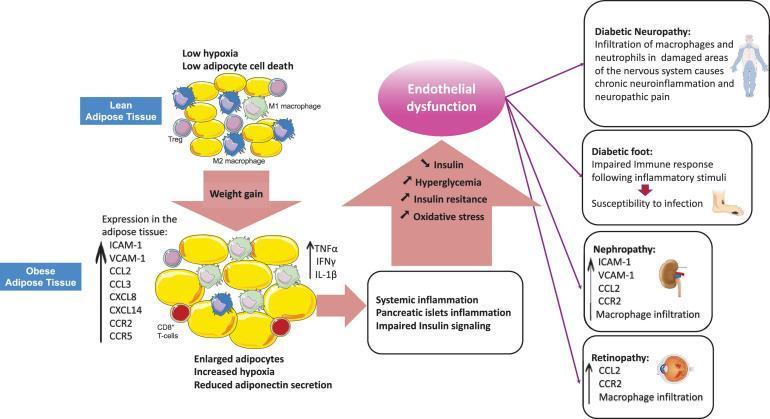
A pathophysiology diagram illustrating the progression from obesity-induced adipose tissue inflammation to Type 2 Diabetes Mellitus (T2DM) and its vascular complications. The visual compares 'Lean Adipose Tissue'—characterized by small adipocytes, low hypoxia, and anti-inflammatory M2 macrophages and Regulatory T-cells (Tregs)—with 'Obese Adipose Tissue' following weight gain. The obese state shows hypertrophied (enlarged) adipocytes, increased hypoxia, and a shift toward a pro-inflammatory environment featuring M1 macrophages, CD8+ T-cells, and elevated expression of cytokines (TNFα, IFNγ, IL-1β), chemokines (CCL2, CXCL8), and adhesion molecules (ICAM-1, VCAM-1). A central pathway illustrates how this local inflammation leads to systemic inflammation, pancreatic islet dysfunction, and impaired insulin signaling. This results in a cascade of hyperglycemia, oxidative stress, and insulin resistance, culminating in endothelial dysfunction. The right side of the diagram maps these physiological changes to specific clinical complications: Diabetic Neuropathy (macrophage/neutrophil infiltration), Diabetic Foot (impaired immune response), Nephropathy (macrophage infiltration and increased CCR2/CCL2), and Retinopathy. The illustration serves as an educational tool for understanding the immunometabolic drivers of chronic diabetic vascular damage.
Diabetes Mellitus
Definition
Classification
| Type | Mechanism |
|---|---|
| Type 1 DM (T1DM) | Autoimmune beta-cell destruction → absolute insulin deficiency |
| Type 2 DM (T2DM) | Progressive loss of beta-cell insulin secretion, frequently on the background of insulin resistance |
| Gestational DM (GDM) | Diabetes diagnosed in pregnancy not clearly present before gestation |
| Other specific types | Monogenic diabetes (MODY, neonatal DM), exocrine pancreatic disease (cystic fibrosis, pancreatitis), drug-induced (glucocorticoids, HIV therapy, post-transplant) |
- Creasy & Resnik's Maternal-Fetal Medicine; Harrison's Principles of Internal Medicine, 22e
Epidemiology
- T2DM accounts for 90-95% of all DM cases; T1DM accounts for 5-10%
- T1DM: no sex difference in incidence
- T2DM: similar prevalence in men and women, but women with DM have a 6-fold greater risk of dying from CVD compared to women without DM, and lose their sex-based cardioprotection
- Prevalence is rising globally, with the largest burden in Southeast Asia and Western Pacific regions
Type 1 Diabetes Mellitus
Pathogenesis
- Islet cell autoantibodies (ICAs)
- Anti-insulin autoantibodies (IAAs)
- Anti-glutamic acid decarboxylase (GAD65/GAD2) antibodies
- Anti-tyrosine phosphatase islet antigen-2 (IA-2) antibodies
Clinical Features
- Typically younger onset (though can occur at any age)
- Abrupt onset: polyuria, polydipsia, weight loss, fatigue
- Strong tendency to diabetic ketoacidosis (DKA), even in the basal state
- Parenteral insulin is required for survival
Treatment: Insulin Therapy
| Preparation | Onset | Peak | Duration |
|---|---|---|---|
| Rapid-acting (aspart, glulisine, lispro) | < 15 min | 0.5-1.5 h | 3-5 h |
| Short-acting (Regular) | 0.5-1 h | 2-3 h | 4-8 h |
| Inhaled human insulin | < 15 min | 1-2 h | ~3 h |
| Intermediate (NPH) | 2-4 h | 4-10 h | 10-16 h |
| Long-acting (glargine, detemir) | 1-4 h | Flat | 20-24 h |
| Ultra-long-acting (degludec) | 1-9 h | No peak | > 42 h |
-
Multiple daily injections (MDI)
-
Continuous subcutaneous insulin infusion (CSII / insulin pump)
-
Sensor-augmented systems (pump + CGM with automatic low-glucose suspension)
-
Automated insulin delivery (AID) - closed-loop systems that adjust basal rate in real time based on CGM
-
Harrison's Principles of Internal Medicine, 22e
Type 2 Diabetes Mellitus
Pathogenesis
- Insulin resistance - Driven by obesity, visceral adiposity, inflammation (TNF-α, IL-6 from hypertrophied adipocytes), and lipotoxicity
- Beta-cell dysfunction - Progressive decline in insulin secretory capacity over time
- Incretin deficiency/resistance - Reduced GLP-1 effect
- Increased hepatic glucose production - Due to impaired insulin suppression of gluconeogenesis
- Endothelial dysfunction - Hyperglycemia → AGE formation, oxidative stress → ↓ nitric oxide, ↑ endothelin-1
Clinical Features
- Typically insidious onset, often diagnosed incidentally
- Classic symptoms: polyuria, polydipsia, weight loss, fatigue, blurred vision, recurrent infections (vaginal candidiasis, skin fungal infections)
- Many patients diagnosed at time of complications (because hyperglycemia precedes diagnosis by years)
- Less prone to DKA; more prone to hyperosmolar hyperglycemic state (HHS)
Diagnosis
| Test | Diabetic | Prediabetic | Normal |
|---|---|---|---|
| Fasting plasma glucose (FPG) | ≥ 126 mg/dL (7.0 mmol/L) | 100-125 mg/dL (IFG) | < 100 mg/dL |
| 2-hour OGTT (75 g) | ≥ 200 mg/dL (11.1 mmol/L) | 140-199 mg/dL (IGT) | < 140 mg/dL |
| HbA1c | ≥ 6.5% | 5.7-6.4% | < 5.7% |
| Random glucose + symptoms | ≥ 200 mg/dL | - | - |
- Tintinalli's Emergency Medicine; Harrison's; Harriet Lane Handbook
Pharmacologic Treatment of T2DM
First-Line: Metformin
- Promotes mild weight loss, lowers insulin levels, improves lipid profile
- Efficacy: 1-2% HbA1c reduction
- Advantages: low cost, known safety profile, no hypoglycemia
- Start alongside lifestyle modification in most patients
Glucose-Lowering Agents (add-on therapy)
| Drug Class | Examples | HbA1c Reduction | Notable Benefits/Notes |
|---|---|---|---|
| GLP-1 Receptor Agonists | Semaglutide, liraglutide, dulaglutide | 1-2% | Weight loss, CV benefit (ASCVD), once-weekly options; GI side effects common |
| SGLT-2 Inhibitors | Empagliflozin, dapagliflozin, canagliflozin | 0.5-1% | CV and renal protection, weight loss, HF benefit |
| DPP-4 Inhibitors | Sitagliptin, saxagliptin | 0.5-0.8% | Weight-neutral, well tolerated |
| Thiazolidinediones (TZDs) | Pioglitazone | 1-2% | Insulin sensitizer; weight gain, fluid retention |
| Sulfonylureas | Glipizide, glimepiride | 1-2% | Low cost; hypoglycemia risk, weight gain |
| Alpha-glucosidase inhibitors | Acarbose | 0.5-0.8% | GI side effects common |
| Insulin | Various preparations | Titrate to target | Used in severe hyperglycemia (FPG > 250 mg/dL), symptomatic disease |
- ASCVD or high CV risk → GLP-1 RA or SGLT-2 inhibitor
- Heart failure (HFrEF or HFpEF) → SGLT-2 inhibitor
- CKD → SGLT-2 inhibitor (renoprotective)
- Weight loss needed → GLP-1 RA (or dual GIP/GLP-1 RA: tirzepatide)
Recent evidence (2025): A systematic review in JAMA Pediatrics (PMID: 40952752) confirmed the efficacy and safety of GLP-1 RAs in children/adolescents with obesity or T2DM. A meta-analysis in Gastroenterology (PMID: 40499738) quantified GI adverse events (nausea, vomiting, diarrhea) with GLP-1 RAs, which are the most common reason for dose titration.
- Harrison's Principles of Internal Medicine, 22e
Non-Pharmacologic Management
- Medical Nutrition Therapy (MNT): Individualized, low glycemic index diet; carbohydrate counting for T1DM
- Physical activity: 150 min/week of moderate aerobic activity; resistance exercise 2-3x/week
- Weight loss: Even 5-10% body weight reduction significantly improves glycemia in T2DM
- Self-monitoring of blood glucose (SMBG) or continuous glucose monitoring (CGM)
- Smoking cessation: Smoking is an independent risk factor for DM complications
- Patient education: Structured diabetes self-management education (DSME) programs
Glycemic Targets
| Measure | General Target | Tight Target (if safe) |
|---|---|---|
| HbA1c | < 7.0% | < 6.5% |
| Fasting/preprandial glucose | 80-130 mg/dL | - |
| 2-hour postprandial glucose | < 180 mg/dL | - |
| Pre-conception (women with DM) | HbA1c < 6.5% | - |
Chronic Complications
Microvascular Complications
1. Diabetic Nephropathy
- Leading cause of end-stage renal disease (ESRD) in the US
- Affects 30-40% of all DM patients
- Natural history: glomerular hyperfiltration → microalbuminuria → macroalbuminuria → declining GFR → ESRD
- Higher risk in Black, Native American, Hispanic individuals
- Screen: urine albumin-to-creatinine ratio (UACR) annually - from T1DM diagnosis +5 years; at T2DM diagnosis
- Moderately increased albuminuria: UACR 30-299 mg/g; Severely elevated: UACR > 300 mg/g
- Treatment: ACE inhibitors or ARBs (reduce intraglomerular pressure); SGLT-2 inhibitors (renoprotective)
- Harrison's, 22e; Robbins & Cotran Pathologic Basis of Disease
2. Diabetic Retinopathy
- Leading cause of blindness in working-age adults
- Classified as: background (non-proliferative) retinopathy → proliferative retinopathy (neovascularization)
- Up to 80% of T1DM patients develop some retinopathy after 15+ years
- Screen: annual fundoscopic/dilated eye exam
3. Diabetic Neuropathy
- Most common chronic complication: up to 50% overall, up to 80% after 15 years of disease
- Forms:
- Distal symmetric polyneuropathy (most common) - "stocking-glove" sensory loss, pain
- Autonomic neuropathy - gastroparesis, orthostatic hypotension, ED, bladder dysfunction
- Mononeuropathy/mononeuropathy multiplex
- Screen: annual exam with 10-g monofilament, vibration (128-Hz tuning fork), pinprick, ankle reflexes
- Robbins & Cotran; Harrison's, 22e
Macrovascular Complications
- DM increases risk of coronary artery disease 2-4x; 4-fold greater risk of dying from CV complications
- Elevated CVD risk even at prediabetes stage
- Hypertension in ~75% of T2DM patients; potentiates hyperglycemia-driven endothelial dysfunction
- Dyslipidemia: ↑ TG, ↑ LDL, ↓ HDL ("diabetic dyslipidemia")
- Stroke, peripheral arterial disease, diabetic foot ulcers/amputation
Acute Complications
| Complication | Type 1 | Type 2 | Key Features |
|---|---|---|---|
| DKA (Diabetic Ketoacidosis) | Primarily | Can occur | Glucose > 250 mg/dL; pH < 7.3; ketones; anion gap metabolic acidosis |
| HHS (Hyperosmolar Hyperglycemic State) | Rare | Primarily | Glucose > 600 mg/dL; extreme hypernatremia; no significant ketosis; high mortality |
| Hypoglycemia | Common | With insulin/SU | Glucose < 70 mg/dL; adrenergic and neuroglycopenic symptoms |
Monitoring and Screening
| Parameter | Frequency |
|---|---|
| HbA1c | Every 3 months if not at goal; every 6 months if stable at target |
| UACR (urine albumin) | Annually |
| eGFR / serum creatinine | Annually |
| Dilated eye exam (retinopathy) | Annually (5 yrs post-T1DM dx; at T2DM dx) |
| Foot exam | Annually (with monofilament + vibration) |
| Blood pressure | Every visit (target < 130/80 mmHg) |
| Fasting lipids | Annually |
| Dental exam | Regularly (periodontal disease more prevalent in DM) |
Risk Factor Modification
- Blood pressure control: Target < 130/80 mmHg; ACE inhibitors/ARBs preferred (dual renal/CV protection)
- Lipid management: Statins for all DM patients ≥ 40 years or with ASCVD risk
- Antiplatelet therapy: Aspirin for established ASCVD
- Smoking cessation
- Vaccination: Influenza, pneumococcal, hepatitis B vaccines recommended
- Harrison's Principles of Internal Medicine, 22e (2025)
- Robbins & Cotran Pathologic Basis of Disease
- Creasy & Resnik's Maternal-Fetal Medicine
- Goldman-Cecil Medicine
- Guyton & Hall Textbook of Medical Physiology
- Recent: GLP-1 RA meta-analysis in pediatrics, JAMA Pediatrics 2025 (PMID: 40952752) | GLP-1 RA GI adverse events, Gastroenterology 2025 (PMID: 40499738)