
Cancer therapy
What aspect of cancer therapy are you interested in? · What is this for?
Which treatment type(s) do you want to focus on?
cancer chemotherapy mechanisms drug classes diagram
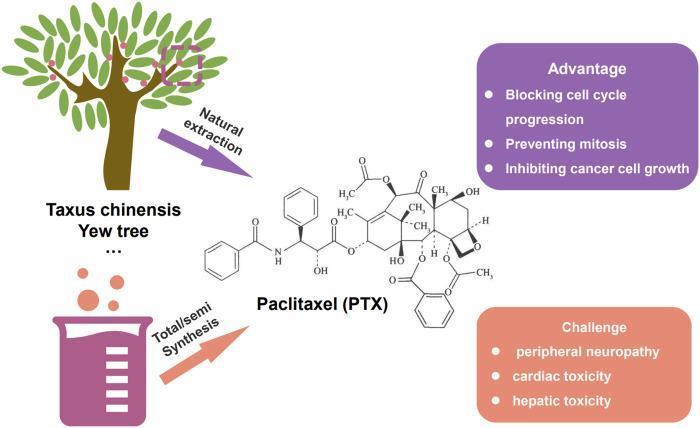
Educational infographic summarizing the production, mechanism of action, and clinical challenges of the chemotherapy agent Paclitaxel (PTX). Central to the diagram is the chemical structure of Paclitaxel. To the left, two sources of the drug are depicted: 'Natural extraction' from the Taxus chinensis (Yew tree) and 'Total/semi Synthesis' represented by laboratory glassware. On the right, two call-out boxes summarize key pharmacological information. The upper 'Advantage' box lists therapeutic mechanisms: blocking cell cycle progression, preventing mitosis, and inhibiting cancer cell growth. The lower 'Challenge' box lists clinical toxicities and adverse effects: peripheral neuropathy, cardiac toxicity, and hepatic toxicity. This diagram serves as a pharmacologic overview of an antineoplastic microtubule stabilizer, highlighting the transition from natural product discovery to clinical application and the associated therapeutic window considerations.
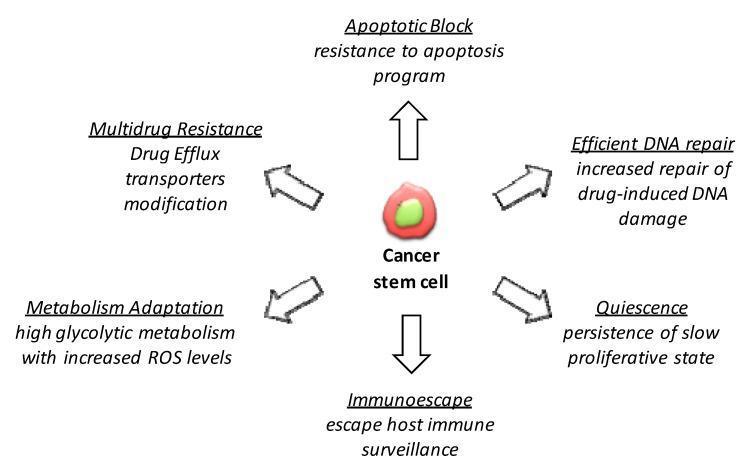
This pathophysiology diagram illustrates the multi-mechanistic model of drug resistance in Cancer Stem Cells (CSCs). The central element is a representative cancer stem cell, depicted as a red cell with a green nucleus. Six primary physiological characteristics contributing to chemotherapy and targeted therapy resistance are arranged radially around the cell, connected by outward-pointing arrows. These mechanisms include: 1) Apoptotic Block (resistance to the programmed cell death pathway), 2) Efficient DNA repair (enhanced correction of drug-induced genomic damage), 3) Quiescence (maintenance of a slow-proliferative or dormant state), 4) Immunoescape (evasion of host immune surveillance), 5) Metabolism Adaptation (shift toward high glycolytic metabolism and altered ROS levels), and 6) Multidrug Resistance (upregulation or modification of drug efflux transporters). The diagram serves as an educational summary of how the intrinsic properties of CSCs drive tumor heterogeneity, survival, and clinical relapse in oncology.
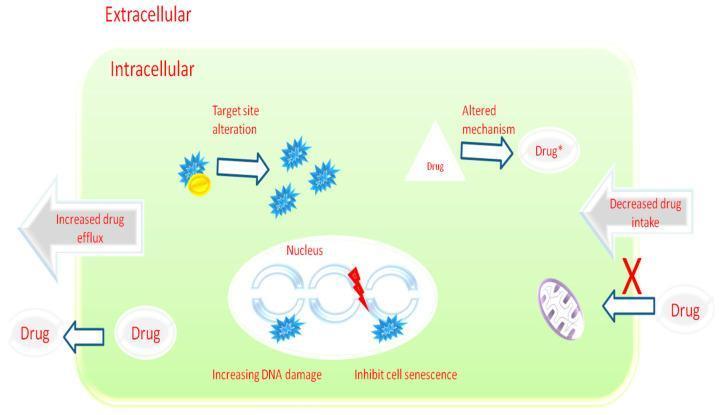
A pathophysiology diagram illustrating the cellular mechanisms of multidrug resistance (MDR) in cancer. The schematic divides the environment into extracellular and intracellular spaces, detailing multiple resistance pathways. Key mechanisms depicted include: 1) Transmembrane transport alterations: Increased drug efflux (via ABC transporters) and decreased drug intake, marked by a red 'X' preventing drug entry. 2) Target site alteration: Transition of molecular targets (yellow circles) into modified forms (blue star shapes) to prevent drug binding. 3) Drug inactivation: An 'Altered mechanism' shown transforming a standard 'Drug' into an inactive or modified 'Drug*'. 4) Nuclear mechanisms: The diagram highlights 'Increasing DNA damage' and the ability to 'Inhibit cell senescence' within the nucleus, involving enhanced DNA repair pathways. This visual summarizes how neoplastic cells evade chemotherapy through metabolic drug inactivation, mutation of cellular targets, and active expulsion of therapeutic agents to maintain cellular survival.
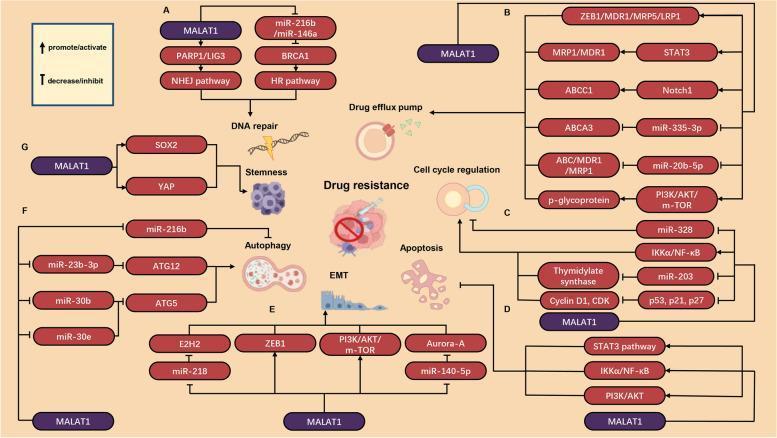
This medical pathophysiology diagram illustrates the multi-faceted molecular mechanisms by which the long non-coding RNA MALAT1 promotes chemotherapy resistance in human cancer cells. The central theme of drug resistance is linked to seven distinct pathways: (A) DNA repair, where MALAT1 activates the NHEJ pathway via PARP1/LIG3 and the HR pathway by inhibiting miR-216b/miR-146a to upregulate BRCA1; (B) Drug efflux pump regulation, involving the activation of ABC proteins (MDR1, MRP1, ABCC1) through STAT3 and Notch1 signaling; (C) Cell cycle regulation, showing MALAT1-mediated inhibition of p53/p21/p27 and upregulation of Cyclin D1/CDK; (D) Apoptosis regulation, featuring the modulation of STAT3 and PI3K/AKT pathways; (E) Epithelial-Mesenchymal Transition (EMT) promotion via ZEB1 and Aurora-A; (F) Autophagy regulation through the inhibition of various microRNAs (miR-23b-3p, miR-30b/e) to increase ATG5/12 expression; and (G) Stemness, via the stabilization of SOX2 and YAP. The diagram uses standard notation where arrows represent promotion/activation and T-bars represent inhibition/decrease, highlighting MALAT1 as a central oncogenic regulator across multiple solid and hematologic malignancies.
immune checkpoint inhibitor PD-1 CTLA-4 T cell cancer immunotherapy mechanism
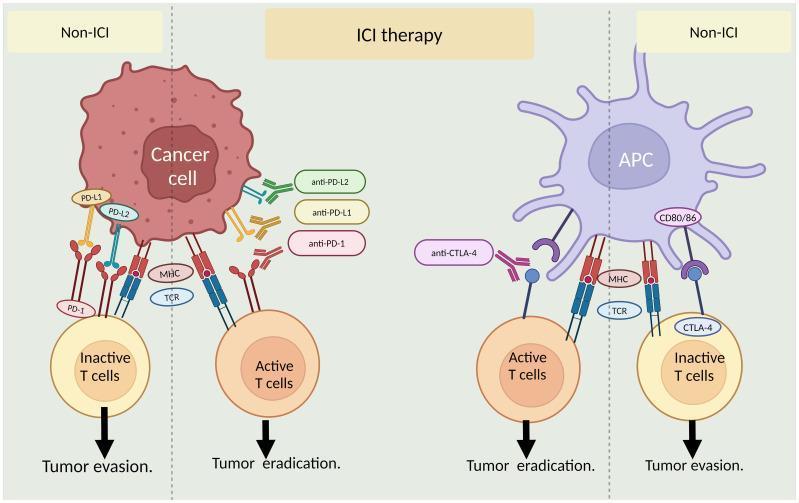
A pathophysiology diagram illustrating the mechanism of immune checkpoint inhibitors (ICI) in cancer immunotherapy. The illustration is divided into two main panels comparing 'Non-ICI' and 'ICI therapy' conditions. The left panel depicts interactions between a cancer cell and a T-cell; in the 'Non-ICI' state, PD-L1/PD-L2 on the cancer cell binds to PD-1 on the T-cell, leading to T-cell inactivation and tumor evasion. Under 'ICI therapy,' antibodies (anti-PD-1, anti-PD-L1, anti-PD-L2) block these inhibitory receptors, resulting in an active T-cell and tumor eradication. The right panel shows the interaction between an antigen-presenting cell (APC) and a T-cell. In the 'Non-ICI' state, CD80/86 on the APC binds to CTLA-4 on the T-cell, causing inactivation and tumor evasion. Under 'ICI therapy,' anti-CTLA-4 antibodies block this pathway, facilitating T-cell activation and tumor eradication. Both panels include common MHC-TCR complex signaling. This educational graphic demonstrates how monoclonal antibodies restore the anti-tumor immune response by preventing inhibitory checkpoint signaling.
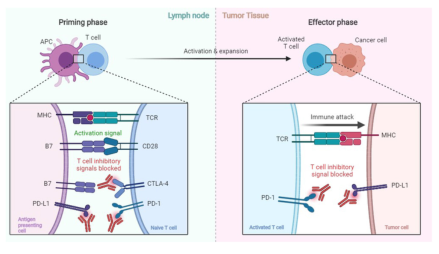
Summary : This figure illustrates the mechanism of T cell activation and inhibition in the context of cancer immunotherapy, showing both the priming phase in the lymph node and the effector phase in tumor tissue. It highlights how immune checkpoint inhibitors block inhibitory signals to enhance T cell-mediated immune attack against cancer cells. process diagram: # Priming Phase (Lymph Node) : • Antigen-presenting cell (APC) interacts with a naive T cell. • Key molecules involved: MHC, TCR, B7, CD28, CTLA-4, PD-1, PD-L1. • Activation signal: MHC on APC binds TCR on T cell; B7 binds CD28. • Inhibitory signals: CTLA-4 and PD-1 on T cell can bind B7 and PD-L1, respectively, to suppress activation. • Immune checkpoint inhibitors (antibodies) block CTLA-4 and PD-1, preventing inhibitory signals. # Effector Phase (Tumor Tissue) : • Activated T cell interacts with a cancer cell. • Key molecules: MHC, TCR, PD-1, PD-L1. • T cell recognizes cancer cell via MHC-TCR interaction, leading to immune attack. • PD-1 on T cell can bind PD-L1 on tumor cell, inhibiting T cell function. • Immune checkpoint inhibitors block PD-1/PD-L1 interaction, sustaining T cell attack. # Connectors : • Arrow from priming phase to effector phase labeled "Activation & expansion". • Dotted lines connect molecular interactions to cell-level diagrams. # Layout : • Two main panels: left (lymph node, priming phase), right (tumor tissue, effector phase). • Each panel contains a zoomed-in molecular interaction diagram. • Color-coded regions: blue for lymph node, pink for tumor tissue. # Analysis : • The figure demonstrates how immune checkpoint inhibitors (anti-CTLA-4, anti-PD-1, anti-PD-L1 antibodies) block inhibitory signals during both T cell priming and effector phases. • Blocking these checkpoints enhances T cell activation and immune attack against cancer cells, providing a mechanistic basis for cancer immunotherapy. • The process is sequential: initial activation in the lymph node, followed by immune attack in tumor tissue, with checkpoint inhibition acting at both stages.
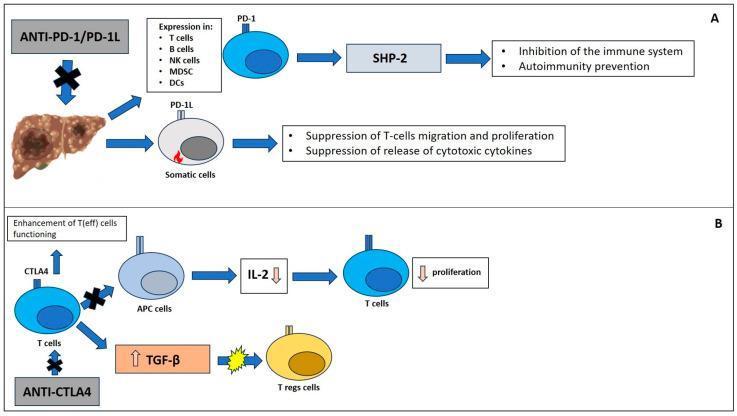
This medical illustration depicts two major immune checkpoint pathways, PD-1/PD-L1 and CTLA-4, in the context of cancer immunology and immunotherapy. Section A illustrates the PD-1/PD-L1 pathway, showing a tumor-burdened liver associated with the expression of PD-1 in various immune cells including T cells, B cells, NK cells, MDSC, and DCs. This signaling involves the tyrosine phosphatase SHP-2, leading to the inhibition of the immune system and prevention of autoimmunity. Simultaneously, PD-L1 expression on somatic cells is shown to suppress T-cell migration, proliferation, and the release of cytotoxic cytokines. Section B details the CTLA-4 pathway, demonstrating how CTLA-4 expression on T cells interacts with Antigen-Presenting Cells (APCs), resulting in decreased IL-2 levels and subsequent inhibition of T-cell proliferation. It also shows the role of CTLA-4 in stimulating TGF-β, which influences Regulatory T cells (Tregs). The diagram highlights the clinical application of Anti-PD-1/PD-L1 and Anti-CTLA-4 therapies (Immune Checkpoint Inhibitors) in enhancing effector T-cell function (T(eff)) for treating malignancies such as hepatocellular carcinoma (HCC).
Goals of Treatment
- Local treatments: Surgery, radiation therapy, ablation (radiofrequency, cryosurgery)
- Systemic treatments: Chemotherapy, targeted therapy, immunotherapy, hormonal therapy
1. Chemotherapy (Cytotoxic Agents)
A. Alkylating Agents
- Mechanism: Form covalent cross-links in DNA strands (inter- and intra-strand), preventing replication. Phase non-specific.
- Examples: Cyclophosphamide, ifosfamide, busulfan, chlorambucil, melphalan, cisplatin, carboplatin, oxaliplatin
- Key toxicities:
- Cyclophosphamide/ifosfamide → hemorrhagic cystitis (prevented with MESNA)
- Cisplatin → nephrotoxicity, peripheral neuropathy, ototoxicity
- All → myelosuppression, gonadal toxicity, secondary leukemia
- Uses: Broad - lymphomas (CHOP regimen), breast, ovarian, testicular cancers, CML (busulfan)
B. Antimetabolites
| Drug | Target | Key Use | Key Toxicity |
|---|---|---|---|
| Methotrexate | Dihydrofolate reductase (DHFR) | ALL, osteosarcoma, lymphoma | Mucositis, nephrotoxicity; reversed by leucovorin |
| 5-Fluorouracil (5-FU) | Thymidylate synthase | Colorectal, gastric cancer | Cardiotoxicity, hand-foot syndrome |
| Cytarabine (Ara-C) | DNA polymerase | AML | Cerebellar ataxia (high dose), myelosuppression |
| Gemcitabine | Ribonucleotide reductase | Pancreatic, lung, bladder ca | Myelosuppression, flu-like syndrome |
| 6-Mercaptopurine | Purine synthesis | ALL | Hepatotoxicity; metabolized by TPMT (genetic variant matters) |
| Cladribine | DNA polymerase, purine analog | Hairy cell leukemia | Prolonged immunosuppression (CD4/CD8 depression >1 year) |
C. Topoisomerase Inhibitors
- Topo I inhibitors (Camptothecins): Irinotecan, Topotecan
- Irinotecan: colorectal cancer (FOLFIRI regimen). Two forms of diarrhea - early (cholinergic, treat with atropine) and late (dehydrating, treat with loperamide)
- Topotecan: ovarian cancer (2nd line), small cell lung cancer
- Topo II inhibitors (Epipodophyllotoxins): Etoposide, Teniposide
- Uses: Testicular, lung, lymphoma
- Risk: Secondary AML
D. Antitumor Antibiotics (from Streptomyces)
- Anthracyclines (Doxorubicin, Daunorubicin, Idarubicin, Epirubicin):
- Mechanisms: Topo II inhibition + free radical generation + DNA intercalation + membrane disruption
- Hallmark toxicity: Dose-dependent dilated cardiomyopathy (cumulative dose limit for doxorubicin: ~550 mg/m²; free radical mechanism). Prevented by dexrazoxane (iron chelator)
- Uses: Breast, lymphomas, leukemias, sarcomas
- Bleomycin: Generates oxygen free radicals → DNA single- and double-strand breaks. Cell cycle-specific (G2 phase). Pulmonary fibrosis is the hallmark toxicity. Used in Hodgkin lymphoma (ABVD), testicular cancer.
- Mitomycin C: Alkylates DNA cross-links; used in bladder, gastric, anal cancers.
E. Microtubule-Targeting Agents
| Drug Class | Examples | Mechanism | Key Use |
|---|---|---|---|
| Vinca Alkaloids (M phase) | Vincristine, Vinblastine, Vinorelbine | Inhibit tubulin polymerization → mitotic arrest in metaphase | Lymphomas, leukemias, lung |
| Taxanes (M phase) | Paclitaxel, Docetaxel | Stabilize microtubules → prevent depolymerization → mitotic arrest | Breast, ovarian, lung |
- Vincristine: Minimal myelosuppression but causes peripheral neuropathy (dose-limiting)
- Vinblastine: More myelosuppression, less neuropathy
- Paclitaxel: Peripheral neuropathy, hypersensitivity reactions (premedicate with steroids + antihistamines), cardiac toxicity
2. Targeted Therapy
A. Tyrosine Kinase Inhibitors (TKIs)
| Drug | Target | Cancer | Key Notes |
|---|---|---|---|
| Imatinib (Gleevec) | BCR-ABL, c-KIT, PDGFR | CML (first-line), GIST | Prototype TKI; resistance via T315I mutation |
| Dasatinib | BCR-ABL + Src kinase | CML resistant to imatinib | Broader spectrum than imatinib |
| Erlotinib, Gefitinib | EGFR (mutant) | NSCLC (EGFR-mutant) | Rash, diarrhea |
| Vemurafenib | BRAF V600E | Melanoma | |
| Ibrutinib | BTK (Bruton's TK) | CLL, mantle cell lymphoma | Bleeding risk |
B. Monoclonal Antibody-Based Targeted Therapy
| Drug | Target | Use |
|---|---|---|
| Trastuzumab (Herceptin) | HER2/neu | HER2+ breast cancer, gastric cancer |
| Cetuximab, Panitumumab | EGFR | Colorectal (KRAS wild-type), head & neck |
| Bevacizumab | VEGF-A | Colorectal, lung, glioblastoma (anti-angiogenic) |
| Rituximab | CD20 | B-cell lymphomas, CLL |
| Alemtuzumab | CD52 | CLL, T-cell malignancies |
3. Immunotherapy
A. Immune Checkpoint Inhibitors
| Drug | Target | Key Uses |
|---|---|---|
| Pembrolizumab (Keytruda) | PD-1 | Melanoma, NSCLC, MSI-H tumors (tumor-agnostic) |
| Nivolumab (Opdivo) | PD-1 | Melanoma, renal cell, NSCLC, bladder, cervical |
| Atezolizumab, Durvalumab | PD-L1 | NSCLC, bladder |
| Ipilimumab (Yervoy) | CTLA-4 | Melanoma (often combined with nivolumab) |
- Dermatitis (most common)
- Colitis / diarrhea
- Pneumonitis
- Hepatitis
- Endocrinopathies: Hypophysitis (especially with PD-1/PD-L1 inhibitors, associated with HLA-DQ0602), thyroiditis, adrenal insufficiency
- Managed with corticosteroids; severe cases require stopping therapy
B. CAR-T Cell Therapy (Chimeric Antigen Receptor T Cells)
- Targets: CD19 (B-cell malignancies), BCMA (multiple myeloma)
- Uses: Refractory diffuse large B-cell lymphoma, ALL, multiple myeloma, mantle cell lymphoma
- Key toxicities:
- Cytokine Release Syndrome (CRS): Fever, tachycardia, hypotension - treat with tocilizumab (IL-6 inhibitor)
- Neurotoxicity (ICANS): Confusion, aphasia, seizures
- Harrison's, p. 604
C. Other Immunotherapy Approaches
- Bacille Calmette-Guérin (BCG): Intravesical instillation for non-muscle-invasive bladder cancer
- IMiDs (Thalidomide, Lenalidomide, Pomalidomide): Alter cytokines in tumor microenvironment + anti-angiogenic; cornerstone of multiple myeloma therapy. Major risk: teratogenicity + thrombosis (prophylactic anticoagulation recommended)
- IFN-α: Partial responses in hairy cell leukemia, follicular lymphoma, melanoma; not curative
- IL-2 (high dose): Durable complete remissions in ~2-5% of metastatic melanoma/RCC; largely superseded by checkpoint inhibitors
4. Hormonal / Endocrine Therapy
| Drug | Class | Mechanism | Use |
|---|---|---|---|
| Tamoxifen | SERM | Estrogen receptor antagonist (breast) / agonist (uterus) | ER+ breast cancer; risk: endometrial cancer, DVT |
| Aromatase inhibitors (Anastrozole, Letrozole, Exemestane) | AI | Block peripheral estrogen synthesis | Post-menopausal ER+ breast cancer |
| Fulvestrant | SERD | Estrogen receptor degrader | Advanced ER+ breast cancer |
| Leuprolide, Goserelin | GnRH agonists (paradoxical antagonism) | Suppress LH/FSH → reduce sex steroids | Prostate cancer, ER+ breast cancer |
| Bicalutamide, Enzalutamide | Androgen receptor antagonists | Block AR | Castration-resistant prostate cancer |
5. Radiation Therapy
- Units: Gray (Gy) = 1 J/kg; 1 Gy = 100 cGy. Typical curative course: ~4500 cGy over 5 weeks in 180 cGy fractions.
- Types: Teletherapy (external beam), brachytherapy (implanted seeds), systemic (e.g., radioiodine for thyroid cancer, Ra-223 for bony mets in prostate cancer)
- Radiation sensitizers: Cisplatin, halogenated pyrimidines (augment DNA damage in head & neck, cervical, rectal cancers)
- Hypoxic cells are more radiation-resistant (oxygen enhances free radical damage)
Key Exam High-Yield Points
| Topic | Key Fact |
|---|---|
| Dose-limiting toxicity of vincristine | Peripheral neuropathy (NOT myelosuppression) |
| Dose-limiting toxicity of vinblastine | Myelosuppression |
| Bleomycin hallmark toxicity | Pulmonary fibrosis |
| Anthracyclines (doxorubicin) | Cumulative cardiomyopathy; prevent with dexrazoxane |
| Cyclophosphamide bladder toxicity | Hemorrhagic cystitis; prevent with MESNA |
| Cisplatin | Nephrotoxicity + ototoxicity + neuropathy |
| Imatinib (CML) | BCR-ABL TKI; first "targeted" therapy |
| Trastuzumab | HER2+ breast cancer; cardiotoxicity |
| PD-1 inhibitors | irAEs: endocrinopathies (hypophysitis), colitis, pneumonitis |
| CAR-T toxicity | CRS (treat with tocilizumab) + ICANS |
| Irinotecan early diarrhea | Cholinergic → treat with atropine |
| BCG | Intravesical - non-muscle-invasive bladder cancer |
| Lenalidomide/Thalidomide | Multiple myeloma; teratogenic + thrombogenic |
| Methotrexate antidote | Leucovorin (folinic acid) rescue |