
make notes on this topic in detail using relevant textbooks and sources.
cd /tmp/workspace/attachments/4d514fce-b6e5-48d0-8c8e-dac83dc349a0/ && python3 -c " import pdfplumber with pdfplumber.open('Neurophysiology.pdf') as pdf: print(f'Total pages: {len(pdf.pages)}') # Read first 3 pages to understand the topic for i, page in enumerate(pdf.pages[:5]): text = page.extract_text() if text: print(f'--- PAGE {i+1} ---') print(text[:2000]) print() "
cd /tmp/workspace/attachments/4d514fce-b6e5-48d0-8c8e-dac83dc349a0/ && python3 -c " import pdfplumber with pdfplumber.open('Neurophysiology.pdf') as pdf: for i, page in enumerate(pdf.pages): text = page.extract_text() words = page.extract_words() print(f'--- PAGE {i+1} --- words: {len(words)}') if words: # Print first 50 words for w in words[:80]: print(w['text'], end=' ') print() print() "
python3 -c " from pypdf import PdfReader import base64, os reader = PdfReader('/tmp/workspace/attachments/4d514fce-b6e5-48d0-8c8e-dac83dc349a0/Neurophysiology.pdf') print('Pages:', len(reader.pages)) print('Page 1 mediabox:', reader.pages[0].mediabox) # Try to extract images from pages for i, page in enumerate(reader.pages[:3]): images = page.images print(f'Page {i+1}: {len(images)} images') for j, img in enumerate(images[:2]): print(f' img {j}: name={img.name}, size={len(img.data)} bytes') "
pip install --user pdf2image pillow 2>/dev/null | tail -1; python3 -c " # Try converting PDF pages to images using PIL/pypdf approach import subprocess result = subprocess.run(['python3', '-c', 'import pdf2image; print(\"ok\")'], capture_output=True, text=True) print('pdf2image:', result.stdout.strip(), result.stderr.strip()[:100]) "
python3 -c " from pdf2image import convert_from_path import os os.makedirs('/tmp/workspace/neuro_pages', exist_ok=True) pages = convert_from_path('/tmp/workspace/attachments/4d514fce-b6e5-48d0-8c8e-dac83dc349a0/Neurophysiology.pdf', dpi=150) print(f'Converted {len(pages)} pages') for i, page in enumerate(pages): path = f'/tmp/workspace/neuro_pages/page_{i+1:02d}.jpg' page.save(path, 'JPEG', quality=85) print(f'Saved {path} ({os.path.getsize(path)} bytes)') "
upper lower motor neuron lesion signs comparison diagram
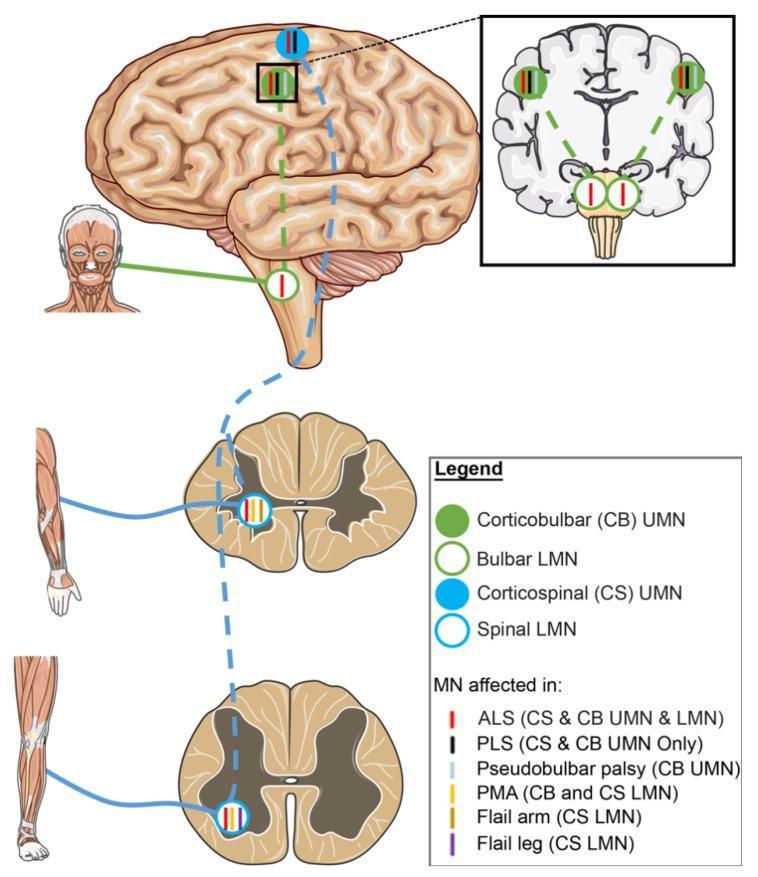
A medical schematic diagram illustrating the neuroanatomical pathways of upper motor neurons (UMN) and lower motor neurons (LMN) and their selective involvement in Amyotrophic Lateral Sclerosis (ALS) variants. The diagram features a lateral view of the human brain, a coronal section of the brain, and transverse sections of the spinal cord (cervical and lumbar levels). Two primary tracts are highlighted: the corticobulbar (CB) tract, represented by green solid circles (UMN) and open circles (LMN), and the corticospinal (CS) tract, represented by blue solid circles (UMN) and open circles (LMN). Solid circles represent UMN cell bodies in the motor cortex, while open circles denote LMNs in the brainstem (bulbar) and spinal cord. Colored vertical tick marks inside these circles indicate specific disease phenotypes: red for classic ALS (CS & CB UMN and LMN), black for Primary Lateral Sclerosis (PLS, UMN only), and yellow for Progressive Muscular Atrophy (PMA, LMN only). Other variants shown include Pseudobulbar palsy (CB UMN), Flail arm, and Flail leg (specific CS LMN segments). This illustration serves as an educational tool for differentiating motor neuron disease phenotypes based on the anatomical site of degeneration.
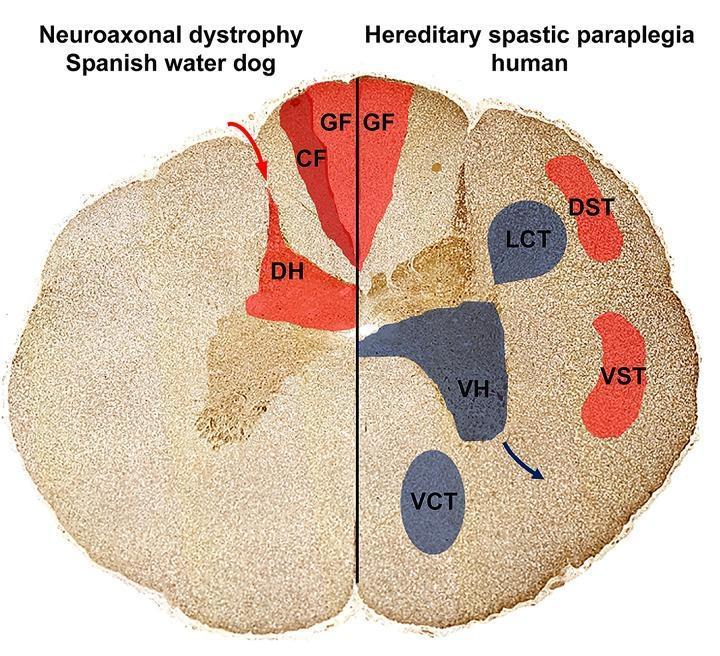
This Comparison Diagram presents a cross-sectional illustration of the spinal cord, contrasting the localization of axonal spheroids and neuronal loss in Neuroaxonal Dystrophy (NAD) and Hereditary Spastic Paraplegia (HSP). The diagram is split into two halves: the left represents a Spanish Water Dog with NAD, and the right represents human HSP. Ascending sensory pathways are highlighted in red, including the Gracile Fasciculus (GF), Cuneate Fasciculus (CF), and Dorsal Horn (DH) on the NAD side, and GF, Dorsal Spinocerebellar Tract (DST), and Ventral Spinocerebellar Tract (VST) on the HSP side. Descending motor pathways, affected only in the HSP model, are highlighted in blue, depicting the Lateral Corticospinal Tract (LCT), Ventral Corticospinal Tract (VCT), and Ventral Horn (VH). The visual demonstrates that in NAD, pathology is restricted to sensory, ascending tracts in the dorsal funiculus and dorsal horn. In contrast, human HSP shows involvement of both sensory pathways and descending motor pathways (pyramidal tracts and ventral horns). This diagram illustrates the pathophysiology of upper motor neuron and sensory system degeneration relevant to neurology and neurohistology.

This clinical photograph set provides a side-by-side comparison of a 32-year-old female patient with chronic left-sided facial paralysis. The left image represents the baseline state three years post-TMJ surgery, showing classic signs of lower motor neuron facial nerve palsy. Key visible findings include left-sided brow ptosis, flattening of the horizontal forehead wrinkles on the left with compensatory overactivity on the right, widening of the palpebral fissure (lagophthalmos), and loss of the nasolabial fold. The oral commissure droops on the left, resulting in facial asymmetry during attempted expression. The right image shows the patient one month after extracellular vesicle (EV) treatment, demonstrating significant clinical improvement. There is a restoration of facial symmetry, improved resting muscle tone, and regained ability to perform a symmetrical smile. The nasolabial folds appear balanced, and brow positioning is more uniform. This comparison illustrates the recovery from severe facial nerve impairment (House-Brackmann scale) to mild dysfunction following therapeutic intervention.
brain lobes anatomy frontal parietal temporal occipital
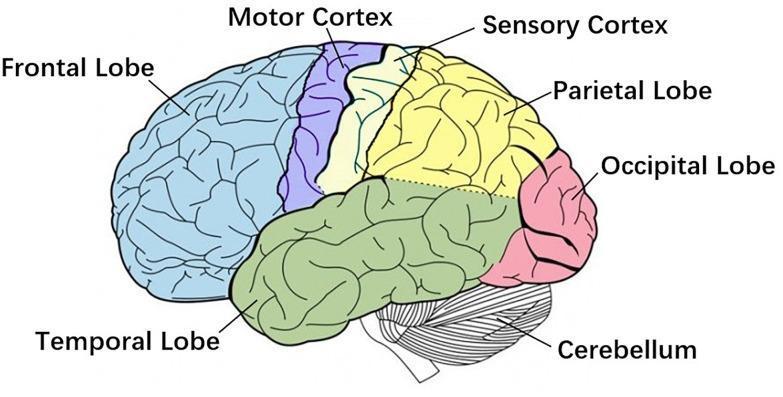
This medical anatomical diagram provides a lateral view of the human brain, utilizing color-coding to delineate primary functional regions and lobes. The frontal lobe is highlighted in light blue at the most anterior position. Progressing posteriorly, the diagram identifies the motor cortex (purple) and the sensory cortex (yellow), which are separated by the central sulcus. The parietal lobe (yellow) follows posteriorly to the sensory cortex, while the occipital lobe is marked in pink at the most posterior pole. The temporal lobe is shaded in green, situated inferior to the frontal and parietal lobes. Below the occipital and temporal regions, the cerebellum is depicted with a distinct striated texture, contrasting with the gyri and sulci patterns of the cerebral cortex. The illustration is designed to teach regional brain anatomy and the spatial relationships essential for understanding corticomuscular coherence (CMC), movement planning, and tactile processing. The labels and color differentiation emphasize the distinct boundaries of these functionally specialized neural structures.
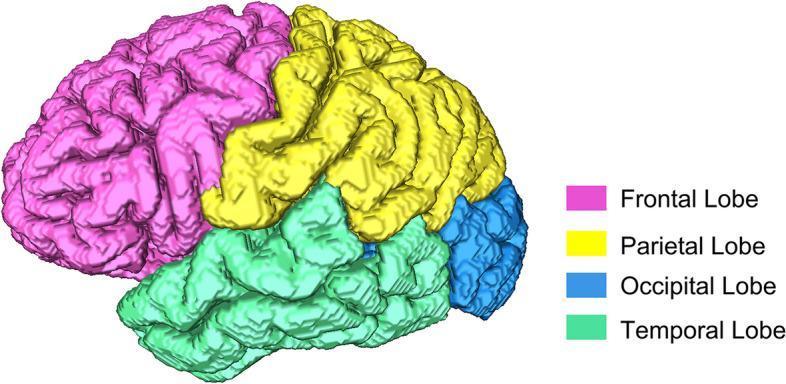
This diagnostic image provides a 3D lateral surface reconstruction of a human brain, derived from MRI data, highlighting cortical anatomy. The cerebral cortex is segmented into four primary lobes using a color-coding scheme: the frontal lobe is pink, the parietal lobe is yellow, the temporal lobe is green, and the occipital lobe is blue. The visualization emphasizes the complex patterns of gyri (elevated ridges) and sulci (grooves) that define human neuroanatomy. Visible landmarks include the central sulcus, which demarcates the frontal and parietal lobes, and the lateral fissure (Sylvian fissure), which separates the temporal lobe from the overlying frontal and parietal regions. This type of segmented anatomical diagram is used in clinical imaging research, such as the MIRIAD database studies, to quantify morphological changes like cortical tortuosity, atrophy, or surface area variations in neurodegenerative conditions such as Alzheimer’s disease. The reconstruction serves as a teaching tool for neuroanatomy and as a reference for volumetric and surface-based brain analysis.
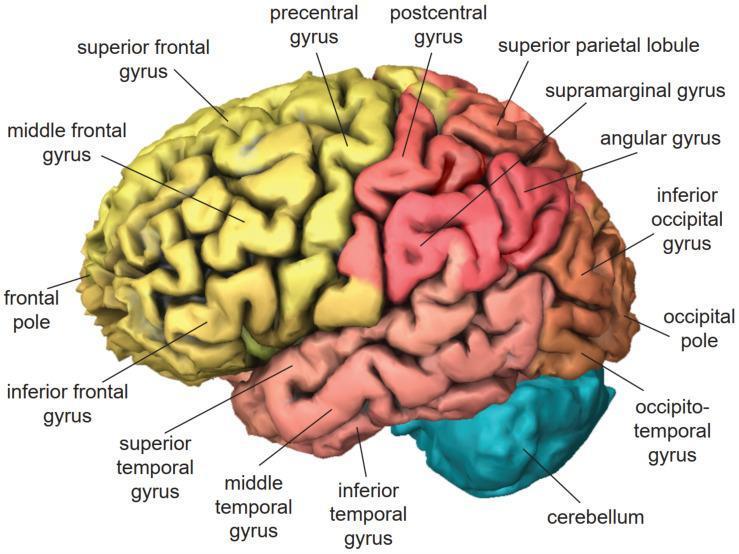
This anatomical diagram provides a lateral view of the left cerebral hemisphere of the human brain, utilizing color-coding to differentiate major lobes and structures. The frontal lobe is highlighted in yellow, featuring the superior, middle, and inferior frontal gyri, as well as the precentral gyrus. The parietal lobe, shown in red, includes the postcentral gyrus, superior parietal lobule, supramarginal gyrus, and angular gyrus. The temporal lobe is shaded in pink, illustrating the superior, middle, and inferior temporal gyri. The occipital lobe is colored salmon, indicating the inferior occipital gyrus and occipital pole. Below the posterior lobes, the cerebellum is depicted in turquoise. The diagram uses thin leader lines to label specific cortical landmarks, including the frontal pole and the occipito-temporal gyrus. This visual serves as an educational tool for neuroanatomy, demonstrating the spatial relationships and surface morphology of the cerebral cortex, relevant for clinical neurology and functional magnetic resonance imaging (fMRI) correlation.
pyramidal tract corticospinal pathway decussation medulla
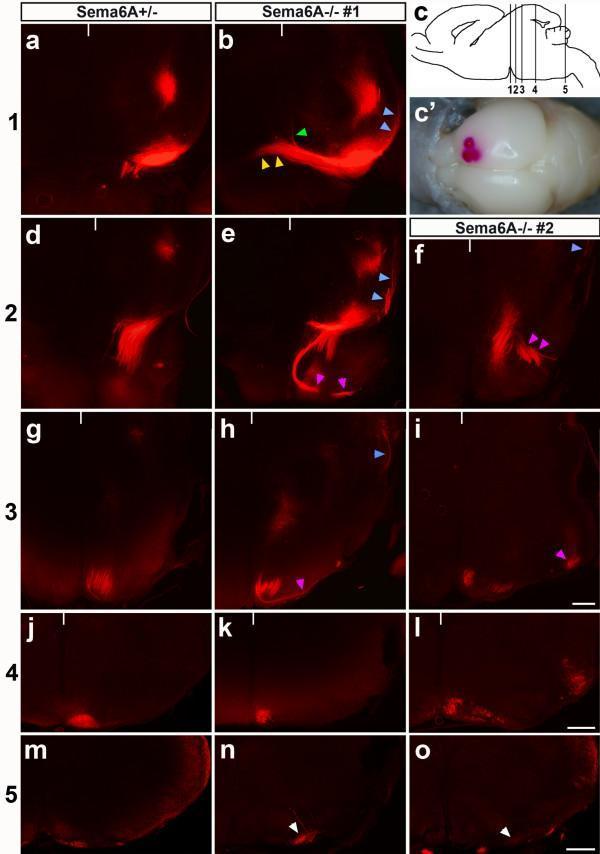
This composite of fluorescent micrographs illustrates axonal guidance defects in the corticospinal tract (CST) using DiI tracing in mouse models, specifically comparing Sema6A+/- (control-like) and Sema6A-/- (mutant) phenotypes. The images represent coronal cross-sections at five distinct neuroanatomical levels: the mid-hindbrain boundary (MHB) through the caudal medulla. In control mice (left column), CST axons follow a stereotyped medial and then ventral path toward the midline. In Sema6A-/- mutants (middle and right columns), multiple axonal routing abnormalities are visible: axons turning dorsally at the cerebral peduncle (blue arrowheads), aberrant midline crossing (yellow arrowheads), or splitting into disorganized bundles in the pons (magenta arrowheads). At the level of the inferior olive and caudal medulla (bottom rows), control axons maintain a tight midline position prior to decussation. Conversely, mutant axons often project laterally and proceed ipsilaterally (white arrowheads), failing to decussate. This neurodevelopmental study demonstrates the critical role of Semaphorin 6A signaling in hemming axons near the midline to ensure proper pyramidal decussation, with implications for understanding CST malformations like those seen in Joubert syndrome.
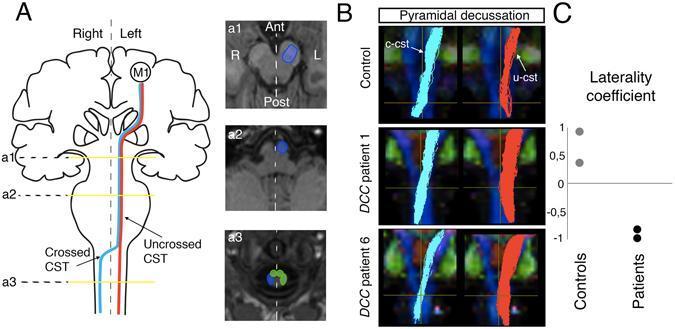
Educational medical graphic illustrating the tractography of the corticospinal tract (CST) in healthy controls and patients with DCC-related congenital mirror movements (DCC-CMM). Panel A provides an anatomical schematic and axial MR slices identifying Regions of Interest (ROIs) for fiber reconstruction: the base of the pons (a1), the anterior pyramid in the upper medulla (a2), and the cervical cord funiculus (a3). Crossed fibers are color-coded in light blue, and uncrossed fibers in red. Panel B displays coronal tractography at the level of the pyramidal decussation, superimposed on fractional anisotropy maps. It contrasts a healthy control, showing dominant light blue crossed CST (c-cst) fibers, with two DCC-CMM patients exhibiting a marked increase in red uncrossed CST (u-cst) fibers. Panel C presents a laterality coefficient graph, where controls show positive values (predominantly crossed fibers) and DCC patients show negative values (predominantly uncrossed fibers), highlighting the failure of normal axonal midline crossing in this condition.
ear anatomy cochlea vestibular ossicles tympanic membrane
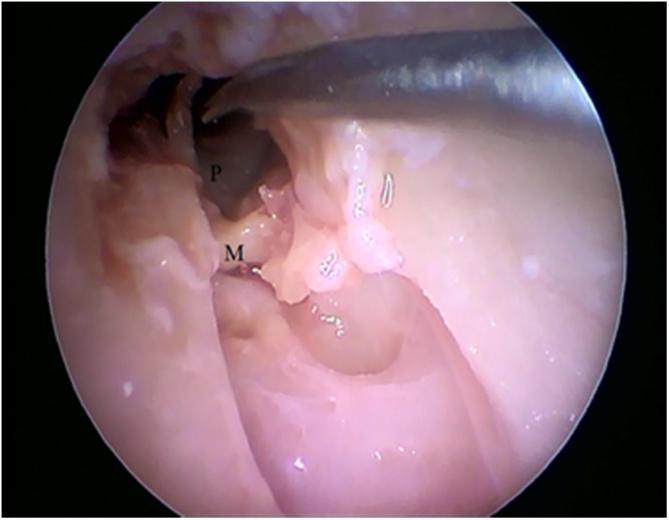
This clinical endoscopic photograph captures an intraoperative view of a middle ear dissection, specifically identifying the anatomical relationship between the ossicles and the medial wall. The promontory (labeled 'P'), which corresponds to the basal turn of the cochlea, is visible as a darker, rounded bony prominence on the medial wall of the tympanic cavity. The malleus (labeled 'M') is shown in a state of detachment, displaced from its normal anatomical position relative to the tympanic membrane and other ossicles. A surgical instrument is visible at the top of the frame, manipulating the tissue to expose the middle ear space. The surrounding mucosa appears moist and light pink, with some fibrous tissue remnants near the tympanic annulus. This image serves as an educational tool for understanding otologic surgical anatomy and the visual identification of middle ear landmarks during endoscopic procedures.
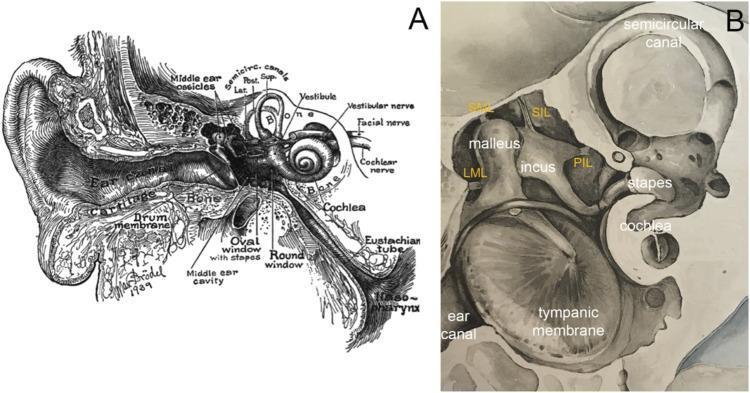
Anatomical diagrams of the human ear and middle ear structures. Panel A is a detailed cross-sectional illustration showing the external ear (pinna, ear canal), middle ear (tympanic membrane, ossicles, eustachian tube), and inner ear (cochlea, semicircular canals, vestibular and cochlear nerves). Panel B provides a magnified view of the middle ear ossicular chain and supporting structures. It illustrates the anatomical relationship between the malleus (attached to the tympanic membrane), the incus, and the stapes (seated at the cochlear oval window). Key ligamentous supports are labeled, including the lateral mallear ligament (LML), superior mallear ligament (SML), superior incudal ligament (SIL), and posterior incudal ligament (PIL). The images serve to demonstrate the mechanical linkage responsible for transmitting acoustic energy from the external environment to the fluid-filled cochlea. The content is suitable for medical education regarding auditory anatomy and pathophysiology.
spinal cord cross section dermatome nerve root
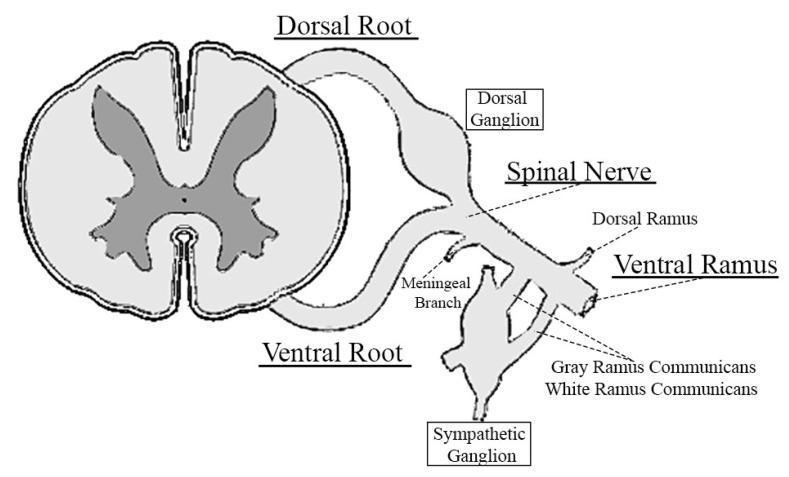
This anatomical diagram illustrates a transverse cross-section of the spinal cord and the subsequent formation and branching of a spinal nerve. The spinal cord is shown with its characteristic internal butterfly-shaped gray matter and surrounding white matter. Extending from the posterior and anterior aspects are the dorsal (sensory) and ventral (motor) roots, respectively. The dorsal root features a prominent dorsal root ganglion. These roots converge to form the mixed spinal nerve. The diagram details the primary distal branches of the spinal nerve, including the small recurrent meningeal branch, the dorsal ramus (supplying paraspinal structures), and the large ventral ramus (supplying the limbs and torso). Additionally, the image shows the rami communicantes (gray and white) connecting the spinal nerve to the sympathetic paravertebral ganglion, highlighting the integration with the autonomic nervous system. This educational illustration is designed to teach peripheral neuroanatomy and the functional pathways of spinal nerve distribution.
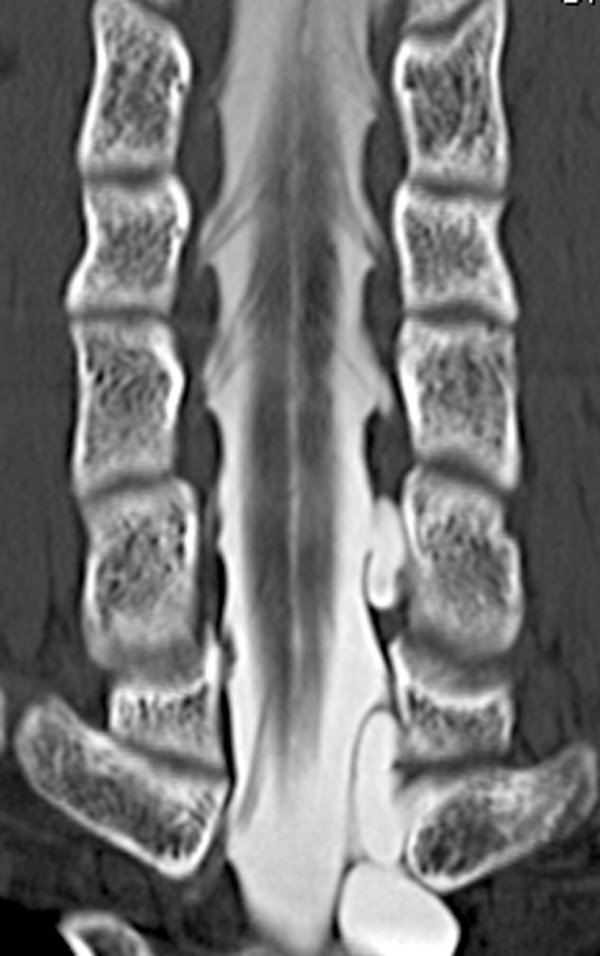
**Imaging Modality:** Computerized Tomography (CT) Myelography. **Anatomical Region:** Cervical spine, coronal reformatted view. **Observed Structures and Features:** The image displays a coronal cross-section of the spinal canal with intrathecal contrast enhancement. The spinal cord is centrally located, flanked by hyperdense contrast material within the subarachnoid space. High-resolution visualization demonstrates multiple bilateral ventral nerve rootlets arising from the spinal cord and traversing the subarachnoid space toward the neural foramina. **Key Findings:** - **Nerve Root Morphology:** The fine linear structures represent the ventral rootlets, appearing as discrete filling defects against the bright contrast. - **Bony Anatomy:** Adjacent vertebral bodies and pedicles are visible, providing anatomical orientation for segmenting the nerve roots. - **Pathology:** On the left side of the lower aspect of the image, there is evidence of traumatic nerve root avulsion, characterized by the absence of normal rootlet patterns and the presence of prominent pseudomeningoceles (extrathecal contrast collections) extending through the neural foramina. **Clinical Utility:** This imaging technique is utilized for the high-resolution assessment of preganglionic nerve root integrity and the diagnosis of brachial plexus injuries or root avulsions.
Neurophysiology - Detailed Notes
1. Neuron Basics
Structure
- Dendrites - receive incoming signals from other neurons or sensory receptors
- Soma (cell body) - integrates signals; contains nucleus and organelles
- Axon - transmits signal away from soma (can be very long - up to 1 meter for lower motor neurons)
- Axon terminals (synaptic boutons / neuromuscular junctions) - synapse onto target cells
Dendrites → Soma → Axon → Terminal → Target
2. Myelination and Conduction
What is Myelin?
- Oligodendrocytes in the CNS (one cell myelinates many axons)
- Schwann cells in the PNS (one cell per internode)
Two Types of Axons
| Feature | Myelinated | Unmyelinated |
|---|---|---|
| Conduction | Fast (saltatory) | Slow (continuous) |
| Speed | ~70-120 m/s (A-alpha) | ~0.5-2 m/s (C fibers) |
| Examples | Motor neurons, proprioception, touch | Pain (C fibers), autonomic |
| Conduction type | Saltatory (node-to-node) | Continuous wave |
Why Does the CNS Contain More Unmyelinated Fibers?
Clinical link: In multiple sclerosis (MS), demyelination of CNS fibers slows or blocks conduction, causing the varied neurological deficits seen in that disease.
3. Spinal Cord Basics
Anatomy
- The spinal cord runs inside the vertebral canal
- Adult: ends at vertebral level L1 (conus medullaris)
- Children: may end lower (L2-L3) because vertebral column grows faster than cord
- Below L1, only nerve roots travel in the vertebral canal as the cauda equina ("horse's tail")
31 Pairs of Spinal Nerves
| Region | Pairs |
|---|---|
| Cervical | 8 (C1-C8) |
| Thoracic | 12 (T1-T12) |
| Lumbar | 5 (L1-L5) |
| Sacral | 5 (S1-S5) |
| Coccygeal | 1 |
Nerve Root vs. Vertebra Numbering (Important!)
- C1 nerve exits above C1 vertebra
- C7 nerve exits above C7 vertebra
- C8 nerve exits below C7 vertebra (there is no C8 vertebra)
- From T1 downward: nerve exits below the numbered vertebra
Clinical importance: When giving nerve blocks or injections, target the nerve root level, not the vertebral body level. These are offset from each other.
Spinal Anesthesia (Clinical Application)
4. Dermatomes and Nerve Root Clinical Points
- Biceps pain / weakness: C5-C6 nerve roots (also controls biceps reflex)
- Knee pain / quadriceps weakness: L2-L4 nerve roots (knee jerk reflex: L3-L4)
- Ankle jerk reflex: S1 nerve root
| Action | Nerve Root |
|---|---|
| Shoulder abduction | C5 |
| Elbow flexion (biceps) | C5, C6 |
| Wrist extension | C6, C7 |
| Finger extension | C7 |
| Finger flexion | C8 |
| Finger abduction | T1 |
| Hip flexion | L1, L2 |
| Knee extension (quads) | L3, L4 |
| Ankle dorsiflexion | L4, L5 |
| Ankle plantarflexion | S1 |
Clinical pearl: Inject at the nerve root level (not vertebral body level) for targeted nerve blocks.
5. Cerebrospinal Fluid (CSF)
Properties of Normal CSF
| Property | Value |
|---|---|
| Appearance | Clear, colorless ("water-clear") |
| Protein | Low (15-45 mg/dL) - much less than plasma |
| Glucose | ~60% of blood glucose (low relative to plasma) |
| White cells | Very few (<5 lymphocytes/mm³) |
| Pressure | 70-180 mmH₂O (opening pressure) |
| Volume | ~150 mL total |
| Production | ~500 mL/day (by choroid plexus) |
Functions of CSF
- Mechanical cushioning - acts as a shock absorber, protecting brain from physical trauma
- Buoyancy - brain "floats" in CSF, reducing its effective weight from ~1400 g to ~25 g
- Chemical homeostasis - maintains stable ionic environment for neurons
- Waste removal - carries away metabolic byproducts
CSF Circulation
Lumbar Puncture - Practical Points
- Performed between L3-L4 or L4-L5 (below cord termination at L1)
- Only small volumes should be sampled at once - large withdrawal risks brain herniation (the brain can shift downward if CSF pressure drops rapidly)
- Patient typically lies in lateral decubitus (fetal position) to open interspinous spaces
- The needle traverses: skin → supraspinous lig. → interspinous lig. → ligamentum flavum → epidural space → dura → subarachnoid space
Danger: Removing large volumes = brain displacement = herniation risk (uncal or tonsillar herniation). This is why only 10-20 mL is ever removed for diagnostic purposes.
6. Brain Surface Anatomy and Lobes
Frontal Lobe
- Function: Cognition, decision-making, planning, personality, executive function
- Key areas:
- Precentral gyrus (just anterior to central sulcus) = Primary motor cortex (Brodmann area 4)
- Premotor cortex (area 6) = planning and sequencing of movement
- Supplementary motor area = planning of complex voluntary movements
- Broca's area (inferior frontal gyrus, dominant hemisphere, usually left) = speech production (expressive language)
- Lesions: contralateral weakness, personality change (orbitofrontal), expressive aphasia (Broca's)
Parietal Lobe
- Function: Primary somatosensory processing - touch, pressure, pain, vibration, proprioception
- Key area: Postcentral gyrus = Primary somatosensory cortex (Brodmann areas 3, 1, 2)
- The central sulcus separates the precentral (motor) and postcentral (sensory) gyri
- Right parietal lobe: spatial awareness; lesions cause hemispatial neglect
- Lesions: contralateral sensory loss, astereognosis (inability to recognize objects by touch)
Temporal Lobe
- Function: Hearing, music appreciation, memory formation, language comprehension
- Key areas:
- Primary auditory cortex (Heschl's gyrus, Brodmann areas 41, 42)
- Wernicke's area (posterior superior temporal gyrus, dominant hemisphere) = speech comprehension
- Lesions: receptive aphasia (Wernicke's), memory problems, complex partial seizures
Occipital Lobe
- Function: Visual cortex; processes all visual information
- Primary visual cortex (Brodmann area 17, calcarine sulcus)
- Processes inverted retinal images and corrects orientation
- Lesions: contralateral homonymous hemianopia
Key Sulci and Landmarks
| Landmark | Significance |
|---|---|
| Central sulcus | Divides frontal (motor) from parietal (sensory) |
| Sylvian (lateral) fissure | Separates temporal lobe from frontal/parietal |
| Longitudinal fissure | Separates left from right hemisphere |
| Calcarine sulcus | Location of primary visual cortex |
7. Motor System Organization
Components
- Primary motor cortex (precentral gyrus, area 4) - executes voluntary movement
- Premotor cortex (area 6) - prepares and plans movement
- Supplementary motor area (SMA) - complex movement sequences, bilateral coordination
Cortical Layers
- Layer V contains the large pyramidal (Betz) cells - these are the upper motor neurons that form the corticospinal tract
- These enormous neurons (up to 100 μm diameter) send axons all the way to the spinal cord
Pyramidal (Corticospinal) Tract - The Main Motor Highway
- Pyramidal cells in motor cortex
- Axons converge and descend through the corona radiata
- Pass through the internal capsule (posterior limb) - fibers are tightly packed here
- Descend through the cerebral peduncles (midbrain)
- Pass through the pons (scattered among pontine nuclei)
- Form the medullary pyramids (visible as two bulges on ventral medulla)
- Decussation of pyramids at the junction of medulla and spinal cord
- Travel in the lateral corticospinal tract of spinal cord
- Synapse on lower motor neurons in the anterior horn of spinal cord
- LMN axons exit via ventral roots → peripheral nerve → neuromuscular junction → muscle
8. Decussation and Clinical Correlates
The Crossing of Fibers
Clinical Consequence of Decussation
| Lesion Site | Motor Deficit Side |
|---|---|
| Above decussation (brain, cortex, internal capsule, brainstem) | Contralateral (opposite side) weakness |
| Below decussation (spinal cord) | Ipsilateral weakness at and below level |
Why Strokes May Be Incomplete
9. Internal Capsule and Stroke
- Corticospinal and corticobulbar fibers (motor - posterior limb)
- Thalamocortical sensory fibers
- Optic radiations (posterior limb)
Why Internal Capsule Lesions Are So Devastating
Key principle: Location of lesion predicts pattern of deficits. A "pure motor hemiplegia" affecting face + arm + leg equally suggests internal capsule or pons (where fibers are tightly packed). Isolated hand or face weakness suggests cortical lesion.
10. Upper vs. Lower Motor Neuron Lesions
Definitions
- Upper Motor Neuron (UMN): Any neuron in the CNS that carries motor signals from cortex to the anterior horn of spinal cord (i.e., the corticospinal tract neuron in the brain/brainstem)
- Lower Motor Neuron (LMN): The final common pathway - anterior horn cells, their axons (via ventral roots and peripheral nerves), ending at the neuromuscular junction
Comparison Table (from Neuroanatomy through Clinical Cases, 3rd Ed.)
| Sign | UMN Lesion | LMN Lesion |
|---|---|---|
| Weakness | Yes | Yes |
| Atrophy | No (mild disuse atrophy only) | Yes (prominent, rapid) |
| Fasciculations | No | Yes (spontaneous LMN firing) |
| Muscle Tone | Increased (spasticity) | Decreased (flaccidity) |
| Reflexes (DTRs) | Increased (hyperreflexia) | Decreased/absent (hyporeflexia/areflexia) |
| Pathological reflexes | Yes (Babinski, Hoffmann) | No |
Why Does UMN Lesion Cause Spasticity?
Important exception: Acute UMN lesions (e.g., acute stroke, acute spinal cord injury = "spinal shock") initially cause flaccidity and hyporeflexia for hours to months, before evolving to classic spasticity. This is called spinal shock.
LMN Lesion Features Explained
- Atrophy: Without constant LMN trophic support, muscle fibers atrophy rapidly
- Fasciculations: Spontaneous, involuntary firing of denervated or diseased motor units - visible under the skin as muscle twitches
- Flaccidity: No reflex arc activity without an intact LMN
Clinical Test - Knee Jerk (Patellar Reflex)
- Reflex arc: Patellar tendon tap → Ia afferents → L3/L4 → anterior horn → femoral nerve → quadriceps contraction
- Normal: Slight knee extension
- Increased (brisk): Suggests UMN lesion (hyperactive arc)
- Absent/decreased: Suggests LMN lesion (arc disrupted) - e.g., femoral neuropathy, L3/L4 root compression, anterior horn disease
11. Reflexes and Clinical Testing
| Reflex | Nerve Root | Nerve |
|---|---|---|
| Biceps | C5, C6 | Musculocutaneous |
| Brachioradialis | C6 | Radial |
| Triceps | C7 | Radial |
| Knee (patellar) | L3, L4 | Femoral |
| Ankle | S1 | Tibial |
- 0 = Absent
- 1+ = Diminished
- 2+ = Normal
- 3+ = Brisk (possibly pathological)
- 4+ = Clonus - UMN lesion
- Babinski sign: Dorsiflexion of big toe + fanning of other toes on plantar stimulation (normal in infants, pathological in adults)
- Hoffmann sign: Flicking middle finger distal phalanx → thumb flexes (suggests cervical cord compression)
12. Cranial Nerves and Bulbar Innervation
The 12 Cranial Nerves
| # | Name | Function(s) |
|---|---|---|
| I | Olfactory | Smell |
| II | Optic | Vision |
| III | Oculomotor | Eye movements (SR, MR, IR, IO), pupil constriction, eyelid (levator) |
| IV | Trochlear | Eye movement (superior oblique - intorsion, depression) |
| V | Trigeminal | Face sensation (3 divisions); muscles of mastication |
| VI | Abducens | Lateral rectus (eye abduction) |
| VII | Facial | Facial expression; taste (anterior 2/3 tongue); lacrimation, salivation |
| VIII | Vestibulocochlear | Hearing (cochlear division) + Balance (vestibular division) |
| IX | Glossopharyngeal | Taste (posterior 1/3 tongue); pharynx sensation/movement; parotid salivation |
| X | Vagus | Pharynx, larynx, palate; parasympathetic to thorax/abdomen |
| XI | Accessory | Sternocleidomastoid + trapezius |
| XII | Hypoglossal | Tongue movement |
Corticobulbar (Cortico-Bulbar) Tract
- Part of the pyramidal system
- Synapses on cranial nerve motor nuclei in the brainstem
- Controls muscles of face, jaw, palate, pharynx, larynx, tongue
- Bilateral cortical input to most cranial nerve nuclei (protective redundancy) - EXCEPT the facial nerve nucleus (CN VII) which has specific bilateral input only to the UPPER face (forehead)
Facial Nerve (CN VII) Palsy - Peripheral vs. Central
| Feature | Peripheral (LMN) Palsy | Central (UMN) Palsy |
|---|---|---|
| Cause | Bell's palsy, parotid tumor | Stroke (cortex or internal capsule) |
| Forehead affected? | YES - entire ipsilateral face weak | NO - forehead spared |
| Mechanism | CN VII nucleus/nerve itself damaged | Contralateral cortex damaged; but forehead has bilateral cortical representation |
| Side of weakness | Ipsilateral face (entire) | Contralateral lower face only |
High-yield: If the forehead is spared in facial weakness, it is a central (UMN) lesion above the pons. If the entire face (including forehead) is weak on one side, it is a peripheral LMN lesion.
13. Clinical Scenarios: Stroke vs. Spinal Cord Injury
Brain Stroke
- Typically contralateral deficits (because fibers decussate at medulla)
- Motor deficit may be partial due to uncrossed (~20%) fibers
- May involve: face + arm + leg (internal capsule) or isolated region (cortex)
- Associated findings: aphasia, hemianopia, neglect depending on lobe affected
- Diagnosis: CT (acute bleed) or MRI DWI (acute ischemia)
Spinal Cord Injury
- Results in deficits ipsilateral and below the level of injury
- Hemisection (Brown-Séquard):
- Ipsilateral: UMN weakness + vibration/fine touch loss
- Contralateral: pain/temperature loss (spinothalamic fibers cross at spinal level)
- Complete transection: Total paralysis + sensory loss below lesion (bilateral)
- Acute phase: Spinal shock (flaccid paralysis initially)
How to Differentiate Central (Brain) vs. Spinal Causes
| Feature | Brain | Spinal Cord |
|---|---|---|
| Weakness | Contralateral | Ipsilateral (at/below level) |
| Cranial nerve signs | Possible | No (unless cervical) |
| Imaging | CT/MRI brain | MRI spine |
| Sensation pattern | Hemisensory or cortical | Level-based or dissociated |
14. Ear Anatomy and Physiology (Hearing and Balance)
Three Divisions of the Ear
Outer Ear
- Pinna (auricle): Collects and funnels sound waves
- External auditory canal (EAC): Directs sound to tympanic membrane (~2.5 cm long)
- Tympanic membrane (eardrum): Thin, cone-shaped membrane; vibrates with sound; separates outer from middle ear
Middle Ear (Tympanic Cavity)
- Three ossicles (smallest bones in body):
- Malleus (hammer) - attached to tympanic membrane
- Incus (anvil) - bridges malleus and stapes
- Stapes (stirrup) - footplate rests on oval window of cochlea
- Eustachian tube: Connects middle ear to nasopharynx; equalizes pressure
- Function: Mechanically amplifies and transmits vibrations from tympanic membrane to oval window (impedance matching from air to fluid)
Inner Ear (Labyrinth)
- Cochlea: Spiral structure for hearing; contains organ of Corti with hair cells
- Vestibular apparatus: Semicircular canals + utricle + saccule; responsible for balance and spatial orientation
- Fluids: perilymph (outside membranous labyrinth, Na⁺-rich) and endolymph (inside, K⁺-rich)
- Hair cells: Mechanoreceptors that transduce mechanical fluid movement into electrical signals
Audiology Pathway (Complete Signal Chain)
Sound waves → Pinna → EAC → Tympanic membrane vibration → Malleus → Incus → Stapes → Oval window → Cochlear fluid (perilymph) movement → Basilar membrane displacement → Hair cell transduction (stereocilia deflection → ion channel opening → generator potential) → CN VIII (cochlear division) → Cochlear nuclei (medulla) → Superior olivary complex → Inferior colliculus → Medial geniculate nucleus (thalamus) → Primary auditory cortex (Heschl's gyrus, temporal lobe)
Vestibular System
- Semicircular canals (3): Detect rotational acceleration (angular); oriented in three planes (horizontal, anterior, posterior)
- Utricle and saccule: Detect linear acceleration and gravity (head tilt)
- Dysfunction → vertigo, nystagmus, balance problems
- Signals travel via CN VIII vestibular division → vestibular nuclei → cerebellum, spinal cord, eye movement centers
Conductive vs. Sensorineural Hearing Loss
| Type | Site of Problem | Cause Example |
|---|---|---|
| Conductive | Outer or middle ear | Cerumen impaction, otitis media, ossicular fixation |
| Sensorineural | Inner ear or CN VIII | Presbycusis, noise damage, acoustic neuroma |
| Mixed | Both | Chronic otitis media with cochlear involvement |
15. Clinical Ear Points
Otitis Media (Middle Ear Infection)
- Common in children (short, horizontal Eustachian tube → poorer drainage)
- Pain is due to tympanic membrane tension from fluid/pus buildup
- Spontaneous perforation of tympanic membrane → pain relief (pressure released)
- If the tympanic membrane is perforated, ear drops can enter the middle ear - some are ototoxic (aminoglycoside-containing drops should be avoided if perforation suspected)
- Eustachian tube dysfunction (e.g., from URTI, allergies) predisposes to otitis media by impairing middle ear drainage/ventilation
Tympanic Membrane Perforation
- Connects external auditory canal directly to middle ear
- Ear drops applied to EAC can reach middle ear if perforated
- Risk of middle ear infection (otitis media) from water entry
- Small perforations usually heal spontaneously; large ones may need surgical repair (myringoplasty/tympanoplasty)
Eustachian Tube Dysfunction
- Upper respiratory infections → mucosal edema → tube blockage
- Results in negative middle ear pressure → fluid accumulation (glue ear/otitis media with effusion)
- Airplane descent: rapid pressure change + dysfunctional tube = ear pain (aeroplane ear)
16. Key Terms and Definitions Summary
| Term | Definition |
|---|---|
| Neuron | Cellular unit of the NS; soma + dendrites + axon + terminals |
| Myelination | Insulating lipid sheath; enables saltatory conduction; faster speed |
| Saltatory conduction | Action potential jumps node-to-node in myelinated axons |
| Conus medullaris | Tip of spinal cord; adults at L1 |
| Cauda equina | Bundle of nerve roots below L1; float in CSF |
| CSF | Clear, low protein fluid; shock absorber; circulates in subarachnoid space |
| Central sulcus | Groove separating precentral (motor) and postcentral (sensory) gyri |
| Precentral gyrus | Primary motor cortex (Brodmann area 4) |
| Postcentral gyrus | Primary somatosensory cortex |
| Pyramidal tract | Corticospinal tract - main voluntary motor pathway |
| Decussation | Crossing of fibers at medulla; ~80% cross |
| UMN | Upper motor neuron; spasticity + hyperreflexia when damaged |
| LMN | Lower motor neuron; flaccidity + atrophy + fasciculations when damaged |
| Babinski sign | Extensor plantar response - marker of UMN lesion |
| Corticobulbar tract | Motor fibers to brainstem cranial nerve nuclei |
| Internal capsule | White matter; tightly packs corticospinal and other fibers |
| Tympanic membrane | Eardrum; vibrates with sound; separates outer from middle ear |
| Ossicles | Malleus, incus, stapes; amplify and transmit sound in middle ear |
| Cochlea | Spiral inner ear organ for hearing; contains hair cells |
| Vestibular system | Inner ear balance apparatus (semicircular canals + utricle/saccule) |
| CN VIII | Vestibulocochlear nerve; carries hearing (cochlear) + balance (vestibular) |
| Broca's area | Inferior frontal gyrus; speech production; damaged in expressive aphasia |
| Wernicke's area | Posterior superior temporal gyrus; speech comprehension; receptive aphasia |
| Dermatome | Skin territory innervated by a single spinal nerve root |
17. High-Yield Clinical Correlations
Lesion Localization Quick Guide
| Finding | Likely Lesion Location |
|---|---|
| Contralateral hemiplegia (face + arm + leg) | Internal capsule |
| Isolated hand weakness, cortical signs | Motor cortex |
| Ipsilateral face + contralateral body weakness | Brainstem (crossed signs) |
| Weakness + hyperreflexia + Babinski | UMN (corticospinal tract) |
| Weakness + atrophy + fasciculations | LMN (anterior horn / peripheral nerve) |
| Expressive aphasia (can't speak) | Broca's area (dominant frontal) |
| Receptive aphasia (can't understand) | Wernicke's area (dominant temporal) |
| Visual field loss | Occipital lobe or optic radiation |
| Hearing loss + tinnitus + vertigo | CN VIII / cochlea / labyrinth |
| Peripheral CN VII palsy (whole face) | Nerve below pons (Bell's palsy) |
| Central CN VII palsy (lower face only) | Cortex or internal capsule |
| Vertigo + nystagmus | Vestibular system (peripheral or central) |