
Ecg
Asking for Preferences
What would you like to know about ECG?
ECG basics cover the fundamentals of reading a 12-lead ECG: paper speed, lead orientation, waveform components (P, QRS, T), intervals, and a systematic reading approach. Let me pull detailed content from the medical library.
Searching sources...
Reading File
Finding Sources
Finding Sources
Finding Sources
Finding Sources
Harrison's has a dedicated "clinical interpretation of the ECG" section. Let me read that alongside the Tintinalli's ECG section.
Reading File
Reading File
Now let me get the full ECG waveforms/intervals content from Harrison's:
Reading File
Let me search more specifically for the ECG waveforms section in Harrison's:
Finding Sources
Finding Sources
Costanzo Physiology has a dedicated ECG section. Let me read both Costanzo and the Goldman-Cecil electrocardiography section:
Reading File
Reading File
Excellent content from Goldman-Cecil! Let me read more of it and also get the Costanzo ECG waveform section:
Reading File
Reading File
I now have rich content from multiple authoritative sources. Let me fetch the ECG waveform diagram from Costanzo and the cardiac conduction diagram from Goldman-Cecil:
Loading Image
Loading Image
Now I also need the lead placement / 12-lead system content from Goldman-Cecil. Let me also get the axis and normal values section:
Reading File
I have enough content now. Let me also get the leads/axis content and normal interval values from the Goldman-Cecil section:
Reading File
I now have comprehensive, authoritative content. Let me compose the full ECG basics guide.
How to Read an ECG - Basics
The Cardiac Conduction System (What the ECG Records)
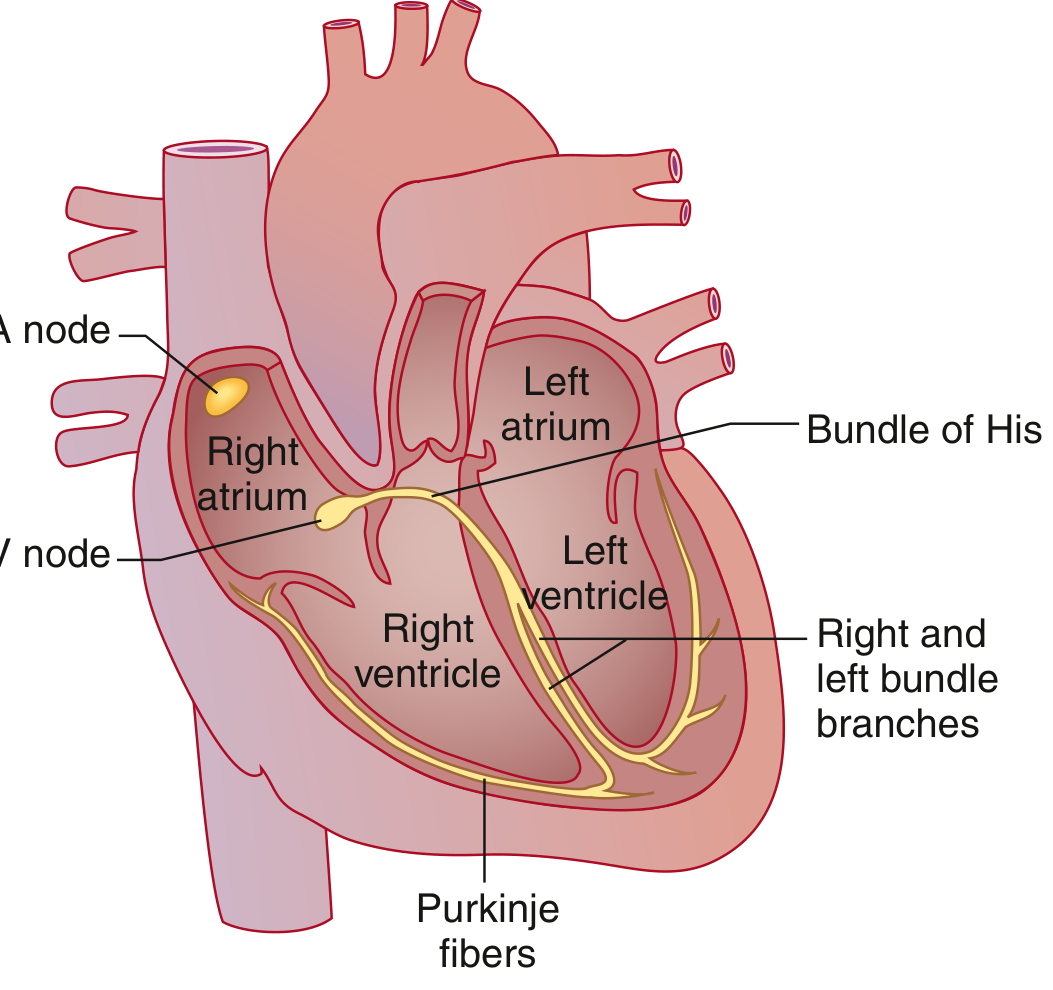
The ECG (electrocardiogram) records tiny potential differences on the body surface that reflect the heart's electrical activity. The signal originates in the SA node (high right atrium), spreads through both atria via the Bachmann bundle, slows at the AV node (the only normal atrial-to-ventricular electrical bridge), then travels rapidly down the Bundle of His → right and left bundle branches → Purkinje fibers → ventricular muscle. This sequence of depolarization and repolarization generates the characteristic waves on the ECG.
- Goldman-Cecil Medicine, p. 422
The ECG Paper
The standard ECG is recorded at 25 mm/sec on graph paper where:
- Each small box (1 mm) = 0.04 second (40 ms)
- Each large box (5 mm) = 0.20 second (200 ms)
- Amplitude: 10 mm = 1 mV (standard calibration)
A standard 12-lead ECG records 10 seconds of activity, grouped as: I, II, III | aVR, aVL, aVF | V1-V3 | V4-V6 - with a rhythm strip running along the bottom.
The Waveforms

| Wave/Interval | What it represents | Normal value |
|---|---|---|
| P wave | Atrial depolarization | Duration < 120 ms |
| PR interval | Atrial depolarization + AV node delay (onset P → onset QRS) | 90-200 ms (0.09-0.20 s) |
| QRS complex | Ventricular depolarization (Q = first negative, R = first positive, S = negative after R) | 75-110 ms |
| ST segment | Isoelectric - period between end of ventricular depolarization and start of repolarization | Should be flat (isoelectric) |
| T wave | Ventricular repolarization | Upright in most leads |
| QT interval | Onset QRS → end T wave; total ventricular depolarization + repolarization | QTc ≤ 450 ms (M), ≤ 460 ms (F) |
| U wave | Small wave after T; likely Purkinje repolarization | Small, same direction as T |
Note: Atrial repolarization is normally invisible - it is buried within the QRS complex.
- Costanzo Physiology 7th Ed, p. 149; Goldman-Cecil Medicine, p. 422
Calculating Heart Rate
From the RR interval (R peak to next R peak):
HR (bpm) = 60,000 ÷ RR interval (ms)
Quick method on ECG paper: Count the number of large boxes between two R waves, then divide into 300.
- 1 large box → 300 bpm
- 2 large boxes → 150 bpm
- 3 large boxes → 100 bpm
- 4 large boxes → 75 bpm
- 5 large boxes → 60 bpm
Normal adult heart rate: 50-100 bpm at rest.
The 12 Leads and What They "See"
The 12 leads are derived from 10 electrodes (6 precordial + 4 limb):
Limb leads (frontal plane):
- Bipolar: I, II, III
- Augmented unipolar: aVR, aVL, aVF
Precordial leads (horizontal plane): V1-V6
| Lead group | Region of heart viewed |
|---|---|
| II, III, aVF | Inferior wall (RCA territory) |
| I, aVL, V5, V6 | Lateral wall (LCx territory) |
| V1-V4 | Anterior wall (LAD territory) |
| V1 | Septal / right heart |
QRS Axis
The QRS axis is the mean direction of ventricular depolarization in the frontal plane.
- Normal axis: -30° to +90°
- Left axis deviation (LAD): more negative than -30° (causes: LBBB, left anterior fascicular block, inferior MI, LVH)
- Right axis deviation (RAD): more positive than +90° (causes: RBBB, RVH, left posterior fascicular block, lateral MI)
Quick method: Look at leads I and aVF.
- Both positive → Normal axis
- I positive, aVF negative → Left axis deviation
- I negative, aVF positive → Right axis deviation
- Both negative → Extreme axis deviation ("northwest axis")
Corrected QT (QTc)
Because QT shortens at faster heart rates, it must be corrected. The standard formula (Bazett's):
QTc = QT ÷ √(RR interval in seconds)
Normal: ≤ 450 ms in men, ≤ 460 ms in women. Prolonged QTc raises the risk for torsades de pointes.
- Goldman-Cecil Medicine, p. 422
The 14-Parameter Systematic Approach (Harrison's)
Every ECG should be analyzed in order:
- Standardization and technical quality - lead placement, artifacts, calibration
- Rhythm - regular or irregular?
- Heart rate
- PR interval / AV conduction
- QRS interval (duration)
- QT / QTc interval
- Mean QRS axis
- P waves - morphology, duration, axis
- QRS voltages - high (LVH/RVH) or low?
- Precordial R-wave progression - normal transition V3-V4
- Abnormal Q waves - pathological if > 40 ms or > 25% of R wave height
- ST segments - elevation, depression, or J-point changes
- T waves - inversion, peaked, flattened
- U waves - presence, polarity
"Many mistakes in ECG interpretation are errors of omission. Therefore, a systematic approach is essential." - Harrison's Principles of Internal Medicine, 22nd Ed. (2025), p. 1919
Quick Summary of What Each Abnormality Means
| Finding | Think of |
|---|---|
| Wide P waves (> 120 ms) | Left atrial enlargement |
| Tall peaked P waves | Right atrial enlargement |
| Long PR (> 200 ms) | 1st degree AV block |
| Short PR (< 120 ms) | Pre-excitation (WPW), AV junctional rhythm |
| Wide QRS (> 120 ms) | Bundle branch block, ventricular rhythm, hyperkalemia |
| ST elevation | STEMI, pericarditis, Brugada, early repolarization |
| ST depression | Ischemia (NSTEMI/UA), reciprocal changes, digoxin |
| Long QTc | Drugs, electrolyte disturbances (hypoK, hypoMg, hypoCa), congenital LQTS |
| Pathological Q waves | Old MI (transmural necrosis) |
| T-wave inversion | Ischemia, strain pattern, PE, cardiomyopathy |
This is the core framework for reading any ECG. Let me know if you'd like to go deeper on any specific area - arrhythmia recognition, bundle branch blocks, ischemia patterns, axis calculation, or anything else.
This is a shared conversation. Sign in to Orris to start your own chat.