
Leukemoid reaction in detail MBBS
leukemoid reaction blood smear peripheral blood
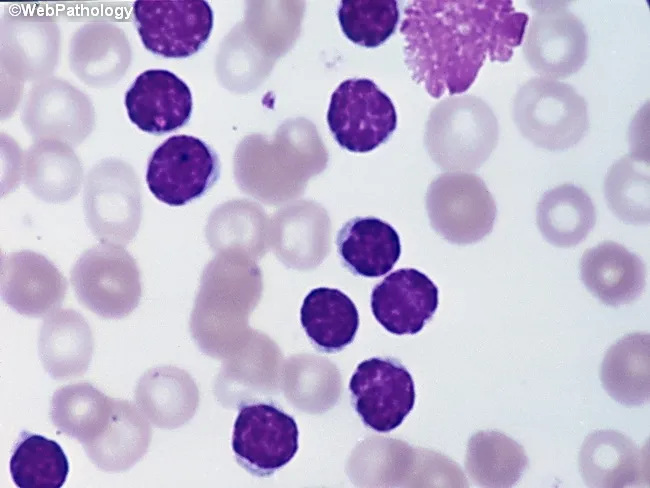
Peripheral blood smear from a patient with suspected chronic lymphocytic leukemia (CLL) shows a predominance of small, mature-appearing lymphocytes with scant cytoplasm and clumped nuclear chromatin, accompanied by fragile cells that readily disrupt during smear preparation, producing numerous smudge or basket cells visible on the slide. The image depicts a single smudge cell in the upper right, with numerous small darkly staining lymphocytes occupying the field. The smear was prepared with Wright-Giemsa stain and examined under light microscopy at high magnification (approximately 1000x total magnification with oil immersion). Clinically, CLL is defined by absolute mature lymphocytosis of ≥5.0 × 10^9/L sustained for ≥3 months, often asymptomatic and detected incidentally on complete blood count. Morphology alone is insufficient for diagnosis; immunophenotyping showing co-expression of CD5, CD19, CD23 with weak surface immunoglobulin and light chain restriction supports CLL diagnosis. Smudge cells result from fragile leukemic cells and reflect underlying cytoskeletal fragility, though they are not specific. The image illustrates typical features: monomorphic lymphocytes, scant cytoplasm, condensed chromatin, and absent prominent nucleoli. This finding has diagnostic significance, guiding further workup, including flow cytometry, cytogenetics, and molecular studies, to distinguish CLL from other chronic lymphoproliferative disorders such as small lymphocytic lymphoma (SLL), mantle cell lymphoma, prolymphocytic leukemia, and reactive lymphocytosis.
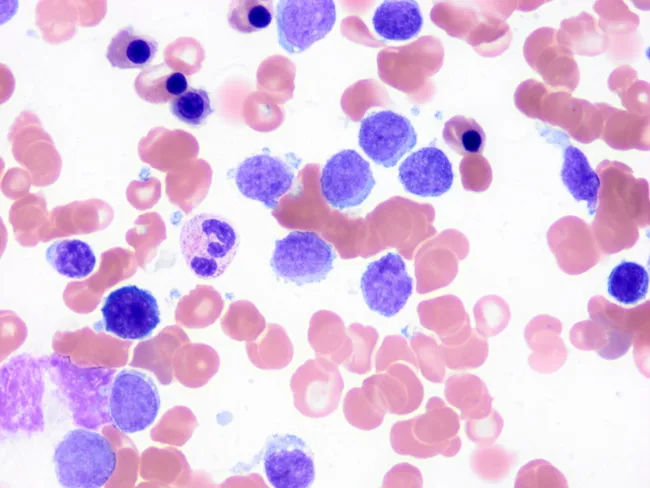
This image depicts a peripheral blood smear prepared with Wright-Giemsa stain and examined under light microscopy at high magnification. The predominant features are small, mature-appearing lymphocytes with scant cytoplasm and discrete basophilic nuclei interspersed among erythrocytes. A characteristic subset of circulating lymphocytes displays short, polarity-restricted cytoplasmic villi (finger-like projections) consistent with splenic marginal zone lymphoma (SMZL) involvement of peripheral blood. The villi are typically slender and localized to one pole of the cell, unlike the longer, circumferential villous extensions seen in hairy cell leukemia, which aids in differential diagnosis. Some lymphocytes appear slightly irregular or irregular nuclear contours; occasional larger atypical cells may be present but are less common. The background shows normocytic red cells with normal distribution; platelets are not prominent. This cytomorphology supports SMZL in the context of known splenomegaly or lymphoproliferative disease and is often corroborated by immunophenotyping and molecular studies. Clinically, peripheral blood involvement occurs in roughly half to two-thirds of SMZL cases and helps establish disease burden. The image illustrates the diagnostic utility of meticulous peripheral smear review for small-vessel lymphocytosis and villous lymphocytes, informing differential diagnoses, guiding flow cytometry panels, and contributing to monitoring and prognosis.
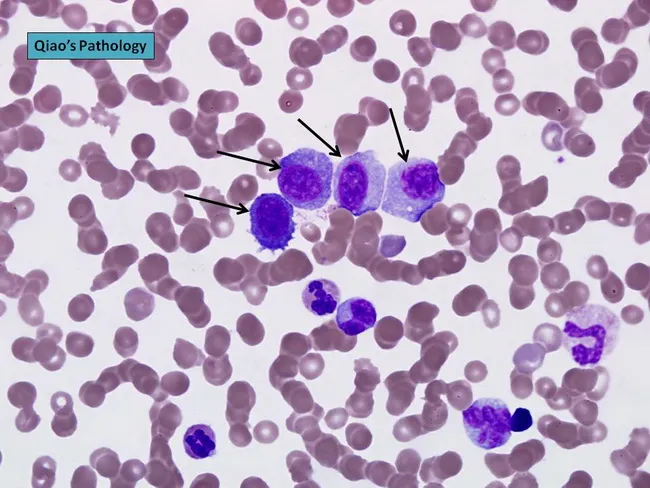
Peripheral blood smear prepared from a patient with suspected plasma cell leukemia (PCL) was examined by bright‑field light microscopy after Wright‑Giemsa staining. The smear shows several circulating plasma‑cell–like elements, including four conspicuous proplasmacytes with dispersed nuclear chromatin and prominent nucleoli, as indicated by arrows in the original figure. In addition, background erythrocytes exhibit rouleaux formation, a common feature in paraproteinemic states. The cells display eccentrically placed nuclei with pronounced basophilic cytoplasm and a coarse chromatin pattern; occasional cells show a perinuclear clearing (Golgi rim) suggestive of plasmacytic differentiation. Immunoglobulin light‑chain restriction is not determined on this smear alone but flow cytometry or immunohistochemistry would typically confirm clonal plasma cells. Relative proportions indicate that neoplastic plasma cells constitute a substantial fraction of leukocytes, consistent with plasma cell leukemia rather than reactive plasmacytosis. PCL is an aggressive myelomatous process often presenting with cytopenias, organomegaly, and sometimes lymphadenopathy; prognosis is poor, and treatment responsiveness is limited. This image illustrates characteristic morphologic features used for differential diagnosis against multiple myeloma, Waldenström macroglobulinemia, and other causes of plasmacytosis. Clinically relevant keywords include plasma cells, rouleaux, Wright‑Giemsa stain, 100X oil, peripheral blood, leukemia, myeloma, and hematologic malignancy.
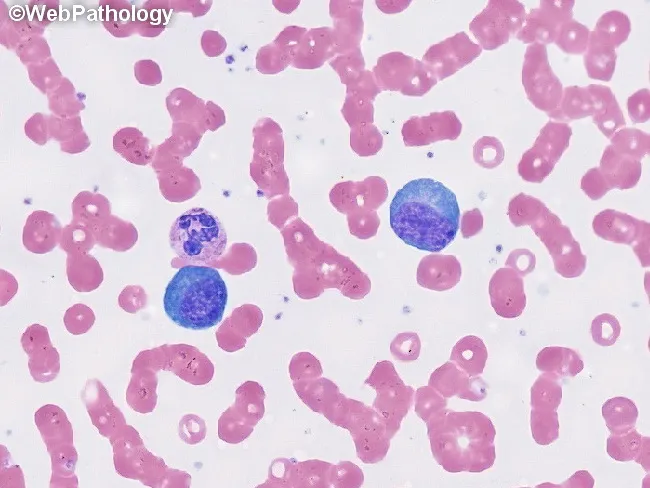
This is a peripheral blood smear prepared with Wright-Giemsa stain and examined under brightfield illumination at high magnification (approximately 1000x total, 100x objective with oil immersion). The smear displays predominantly erythrocytes with uniform pink cytoplasm and characteristic biconcave morphology, arranged singly with occasional rouleaux. Interspersed among the red cells are leukocytes with visible nuclei. Notably, two large lymphocyte-like cells or mononuclear leukocytes appear conspicuously larger than surrounding erythrocytes; these cells have round to oval, deeply basophilic nuclei with dense chromatin and scant, lightly basophilic cytoplasm. No visible granulocytic cytoplasm granules or multiple lobes are clearly resolved in this field, and there are no obvious nucleoli or cytoplasmic inclusions evident in these cells. The background lacks abnormal pigment or reticulocytosis. Overall cell morphology is consistent with a normal or mildly reactive hematologic smear; in a clinical context, additional data such as complete blood count, differential, and patient history would be needed to determine whether there is leukocytosis or blasts. This image serves as an educational reference for recognizing basic peripheral blood components, evaluating leukocyte size variation, and assessing RBC morphology for hematology training and diagnostic differential diagnoses. Additional cases and image contexts can reinforce recognition of hematologic normal variants and patterns.
Leukemoid Reaction - Complete MBBS Notes
Definition
- The term literally means "leukemia-like" - the blood picture mimics leukemia but the underlying process is benign and reactive.
- Defined as WBC >50,000/µL with a pronounced left shift (Goldman-Cecil Medicine).
Types
| Type | Predominant Cell |
|---|---|
| Neutrophilic (most common) | Neutrophils + immature granulocytes |
| Eosinophilic | Eosinophils (inc. eosinophilic myelocytes) |
| Lymphocytic | Lymphocytes |
| Monocytic | Monocytes |
Causes
Neutrophilic Leukemoid Reaction (most important)
- Infections: Severe bacterial infections (especially tuberculosis, diphtheria, Clostridioides difficile), sepsis
- Malignancy: Hodgkin lymphoma (HL), malignancy with bone marrow involvement, solid tumors with marrow metastases
- Hematological: Hemolysis, hemorrhage, myelofibrosis
- Others: Severe burns, eclampsia, certain toxins, rebound granulocytosis after chemotherapy
Eosinophilic Leukemoid Reaction
- Parasitic infections (most common cause, especially in children)
- WBC can exceed 50 x 10⁹/L; cells as immature as eosinophilic myelocytes appear in blood
Lymphocytic Leukemoid Reaction
- Viral infections (Epstein-Barr virus, pertussis in children)
- Differential diagnosis: CLL, ALL
Peripheral Blood Smear Findings
- Marked leukocytosis (>50,000/µL)
- Left shift - immature forms in blood: bands > metamyelocytes > myelocytes
- Toxic granulation - coarse dark granules in neutrophil cytoplasm (due to abnormal primary granule retention - sign of infection/inflammation)
- Döhle bodies - pale blue cytoplasmic inclusions in neutrophils (aggregates of rough ER)
- Cytoplasmic vacuoles in neutrophils
As noted in Goldman-Cecil Medicine: "From this smear, it would be impossible to distinguish a leukemoid reaction from chronic phase CML. Distinction would depend on determination of the presence or absence of BCR-ABL fusion."
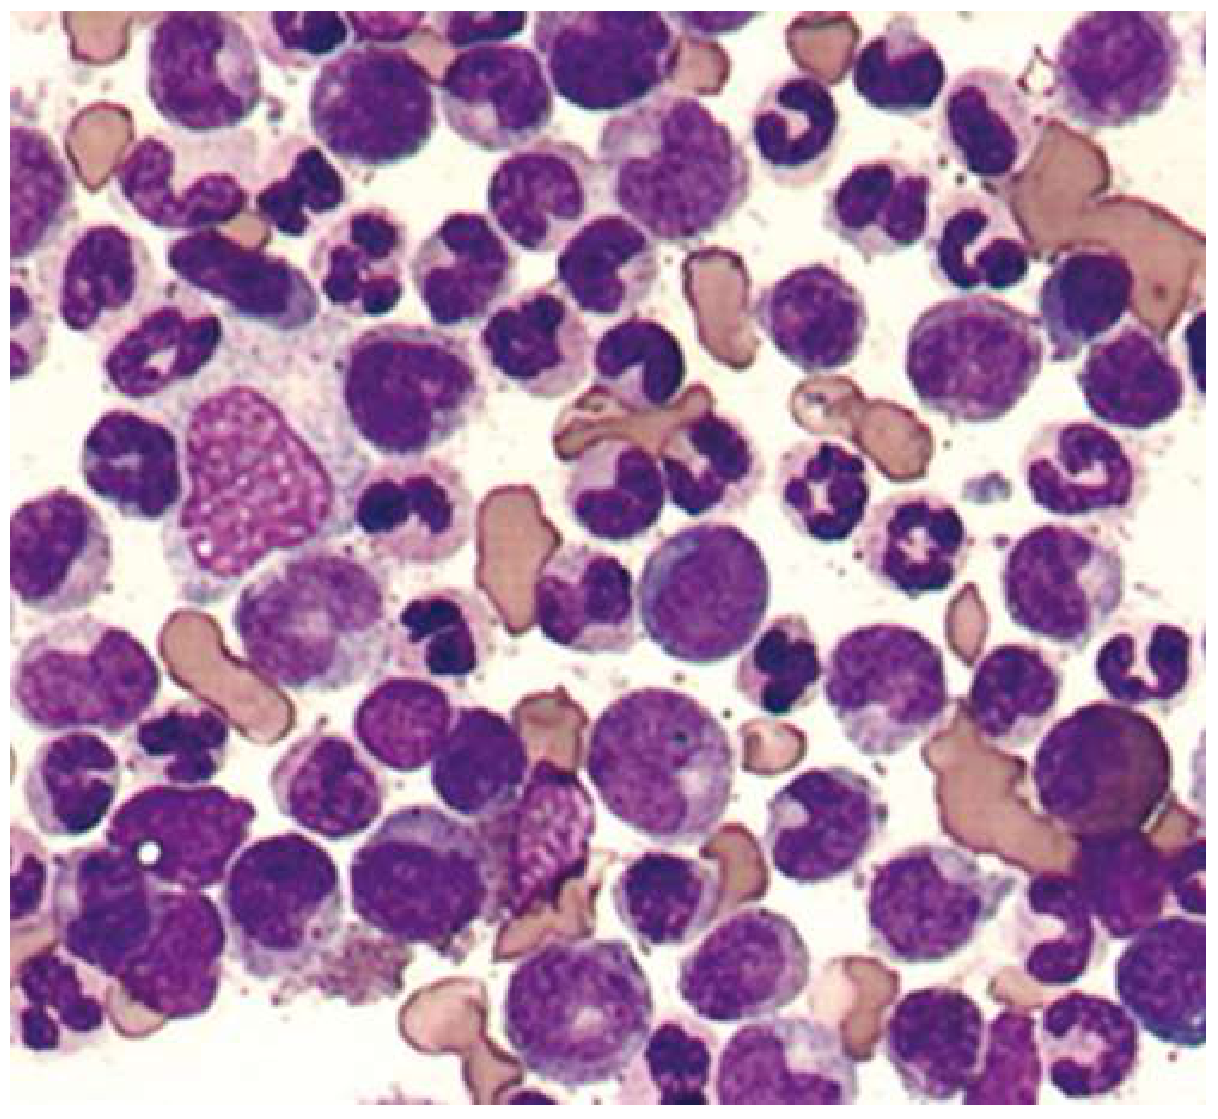
Leukocyte Alkaline Phosphatase (LAP) / Neutrophil Alkaline Phosphatase (NAP) Score
How it's Done
- Visual examination of 100 bands and neutrophils
- Each cell is scored 0 to 4+ based on intensity of cytoplasmic staining
- Sum of 100 values = LAP score
Reference Ranges
| Condition | LAP Score |
|---|---|
| Normal | 40-120 |
| Leukemoid reaction | Normal or ELEVATED (>120) |
| CML | Very LOW (0-15) |
| PNH | Low |
| MDS | Low |
| Polycythemia vera | Elevated |
| Primary myelofibrosis | Elevated |
| Pregnancy (3rd trimester) | Elevated |
| Glucocorticoid use | Elevated |
Leukemoid Reaction vs. CML - Key Distinction (MOST EXAM-IMPORTANT TABLE)
| Feature | Leukemoid Reaction | CML |
|---|---|---|
| Cause | Reactive (infection, inflammation) | Neoplastic (BCR-ABL) |
| WBC count | >50,000/µL | Often >100,000/µL |
| Left shift pattern | No specific pattern; bands predominate | Classic "myelocyte peak" (myelocytes > metamyelocytes) |
| Basophilia | Absent | Present (hallmark) |
| Eosinophilia | Absent | Present |
| Anemia | Absent (usually) | Common |
| Thrombocytosis | Absent | Common |
| Toxic granulation | Present | Absent |
| Döhle bodies | Present | Absent |
| LAP/NAP score | Normal or HIGH | Very LOW |
| Philadelphia chromosome | Absent | Present (t(9;22)) |
| BCR-ABL gene | Absent | Present |
| Splenomegaly | Usually absent | Prominent |
| Vitamin B12 | Normal | Elevated |
| Basophil count | Normal | Elevated (independent adverse prognostic factor) |
| Bone marrow | Reactive hyperplasia | Hypercellular, all myeloid series |
| Course | Resolves with treatment of cause | Progressive without therapy |
Leukoerythroblastic Reaction (Related Concept)
- Common in metastatic carcinoma involving bone marrow
- Also seen in myelofibrosis, severe hemolysis
- Indicates bone marrow infiltration or stress erythropoiesis
Pathophysiology
- Cytokine-driven marrow stimulation: Severe infection or inflammation triggers release of TNF-α, G-CSF, GM-CSF, IL-1, IL-6, IL-8
- These cytokines drive accelerated myelopoiesis in the bone marrow
- Emergency release of immature granulocytes (bands, metamyelocytes, myelocytes) from bone marrow storage pools into peripheral blood - the "left shift"
- The process is polyclonal and self-limiting - it resolves when the triggering cause is treated
Clinical Approach to Diagnosis
- YES → Consider leukemoid reaction vs. CML vs. other myeloproliferative neoplasm
- Toxic granulation + Döhle bodies → suggests leukemoid reaction
- Basophilia + eosinophilia + "myelocyte peak" → suggests CML
- HIGH → leukemoid reaction
- LOW → CML
- BCR-ABL present → CML confirmed
- BCR-ABL absent → leukemoid reaction (find and treat the cause)
Additional Points for MBBS
- C-reactive protein (CRP) rises rapidly with the onset of inflammation and may be an earlier, more sensitive indicator of acute infection than the leukocyte count itself
- Vitamin B12 levels are elevated in CML (due to increased production of transcobalamin by leukemic cells) but normal in leukemoid reaction
- Certain specific infections classically cause extreme leukocytosis: tuberculosis and C. difficile are known to cause WBC >30,000/µL in ~25% of infected patients, sometimes reaching leukemoid levels
- In eosinophilic leukemoid reactions, always suspect parasitic infections (particularly in pediatric patients)
- Leukemoid reactions lack the characteristic differential count of CML - specifically the "myelocyte peak" (where myelocytes outnumber metamyelocytes), eosinophilia, and basophilia that define CML
Summary Mnemonics
CML
chronic myelogenous leukemia CML peripheral blood smear bone marrow
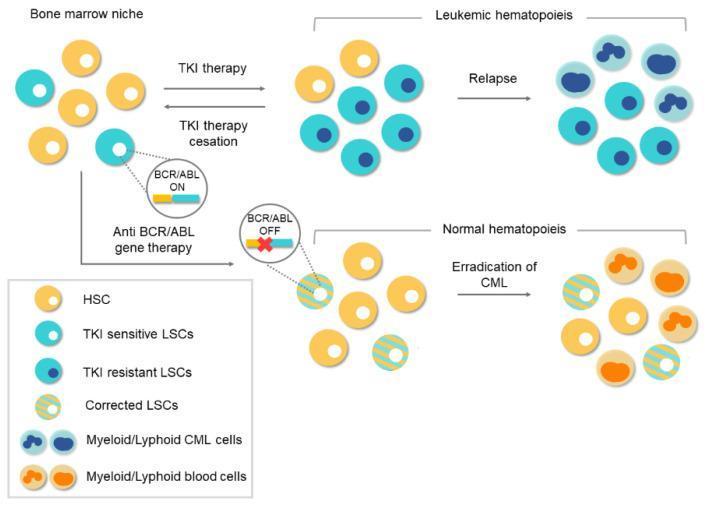
A comparative medical illustration detailing therapeutic pathways for Chronic Myeloid Leukemia (CML) within the bone marrow niche. The diagram contrasts conventional Tyrosine Kinase Inhibitor (TKI) therapy with Anti-BCR/ABL gene therapy. The top pathway illustrates 'Leukemic Hematopoiesis': following TKI therapy, a mixed population of yellow Hematopoietic Stem Cells (HSCs), light blue TKI-sensitive Leukemic Stem Cells (LSCs), and dark blue TKI-resistant LSCs is shown. Treatment cessation or resistance leads to relapse, characterized by the proliferation of myeloid/lymphoid CML cells. The lower pathway depicts the potential of gene therapy: 'Anti-BCR/ABL gene therapy' targets LSCs to silence the oncogene (BCR/ABL OFF). This results in 'Corrected LSCs' (depicted with yellow and blue stripes), which repopulate the niche alongside normal HSCs. The final outcome is 'Normal Hematopoiesis' and the eradication of CML, visualised by the presence of mature myeloid/lymphoid blood cells (orange). The diagram serves as an educational tool for hematology and oncology, emphasizing the limitations of protein-level inhibition versus genome-level editing in stem cell niches.
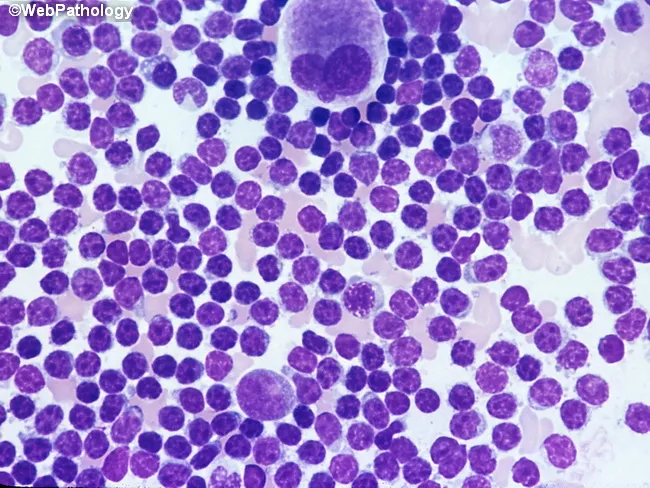
Bone marrow aspirate smear analyzed by light microscopy with high magnification reveals marrow involvement by chronic lymphocytic leukemia (CLL) cells. The predominant population consists of small, dark lymphocytes with scant cytoplasm and condensed, clumped nuclear chromatin, producing high nuclear-to-cytoplasmic ratios. Occasional larger forms and prolymphocytes may be present but are uncommon. A consistent finding is the relative scarcity of cytoplasm and uniform round to slightly irregular nuclei among the bulk of lymphoid cells. The smear may show scattered megakaryocytes, reflecting concurrent hematopoietic activity within the aspirate. Morphology mirrors circulating leukemic cells, consistent with systemic disease. Clinically, such marrow infiltration is associated with cytopenias and advanced disease stage, especially when diffuse, solid infiltration predominates in core biopsy patterns; these patterns correlate with adverse prognosis and with expression of prognostic markers such as ZAP-70. The image corresponds to a high-magnification field intended to document cellular detail rather than architectural marrow patterns. Diagnostic significance lies in confirming lymphoid marrow involvement by CLL, quantifying blast equivalents is not applicable, and differentiating from other small B-cell neoplasms relies on adjunct flow cytometry, cytogenetics, and immunophenotyping. This representation is typical for educational, diagnostic, and research contexts describing CLL marrow morphology.
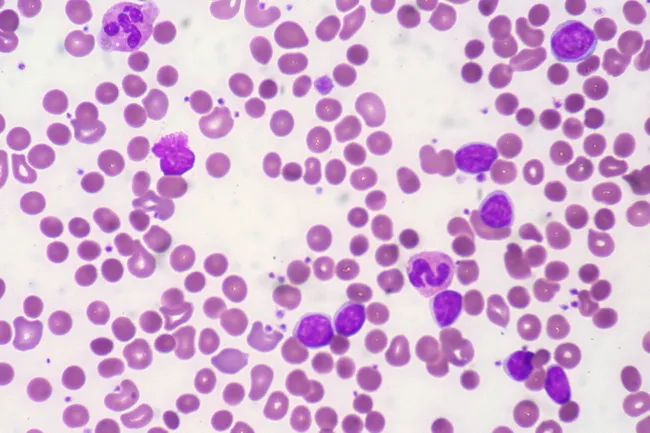
Peripheral blood smear from a patient with known chronic lymphocytic leukemia (CLL) showing autoimmune hemolytic anemia (AIHA). Brightfield microscopy of Wright-Giemsa stained smear at 1000x (oil immersion) reveals two dominant cell populations: numerous small mature lymphocytes typical of CLL and red blood cells showing spherocytic deformation. A smudge cell is evident just left of center, a classical clue for CLL. Red cells display reduced central pallor consistent with spherocytes, indicating intravascular or extravascular hemolysis driven by autoantibodies. The background shows mild polychromasia and rare nucleated RBCs, consistent with a robust reticulocyte response; the corrected reticulocyte count in this case is markedly elevated (>7%). Platelets are not significantly abnormal. These features collectively support autoimmune destruction of erythrocytes in the setting of CLL. Diagnostic significance lies in recognizing AIHA as a common autoimmune complication in CLL, with a clinical picture of sudden Hb decline and compensatory erythropoiesis. Differential considerations include drug-induced hemolysis, other causes of hemolytic anemia, or marrow infiltration by CLL. Clinical correlation includes therapy implications (steroids, rituximab) and close monitoring of hemolysis markers. This image is a valuable teaching resource for hematology morphology, AIHA in CLL, and differential diagnosis in anemia.
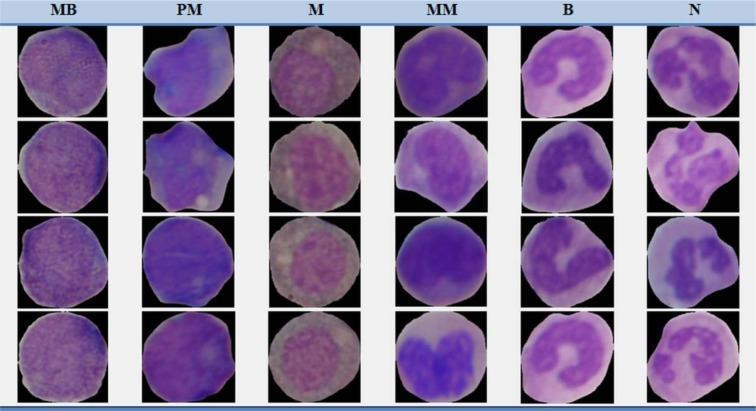
This composite diagnostic image displays a comparison chart of hematological cells from non-cancerous bone marrow aspirations, organized to show the maturation stages of the myeloid series. The visual consists of a grid with six columns, each representing a specific stage of development: Myeloblast (MB), Promyelocyte (PM), Myelocyte (M), Metamyelocyte (MM), Band (B), and Neutrophil (N). The cells are stained with Giemsa, revealing characteristic morphological changes in nuclear and cytoplasmic structure. Early stages (MB, PM) show large, round to oval nuclei with high nuclear-to-cytoplasmic (N:C) ratios and basophilic cytoplasm. As maturation progresses through the Myelocyte and Metamyelocyte stages, the nuclei become smaller and more indented. The Band (B) stage is characterized by an elongated, curved, non-segmented nucleus. The terminal stage, the Neutrophil (N), demonstrates distinct nuclear lobulation (typically 2-3 lobes) and increased cytoplasmic granularity. This image serves as an educational reference for identifying white blood cell precursors in the context of healthy hematopoiesis and chronic myelogenous leukemia (CML) classification.
Chronic Myeloid Leukemia (CML) - Complete MBBS Notes
Definition
- There is no BCR-ABL-negative CML - BCR-ABL is required for diagnosis
- It is the most common chronic leukemia in middle-aged adults
Epidemiology
- Incidence: ~1-1.5 per 100,000 adults/year worldwide
- Represents ~15% of all adult leukemias, <5% of childhood leukemias
- Median age of onset: ~65 years (peak: 5th-6th decade)
- No CML families described
- Greatest risk factor: radiation exposure (proven in Japanese atomic bomb survivors)
- Prevalence is increasing because TKI therapy has dramatically extended survival
The Philadelphia Chromosome - Molecular Basis
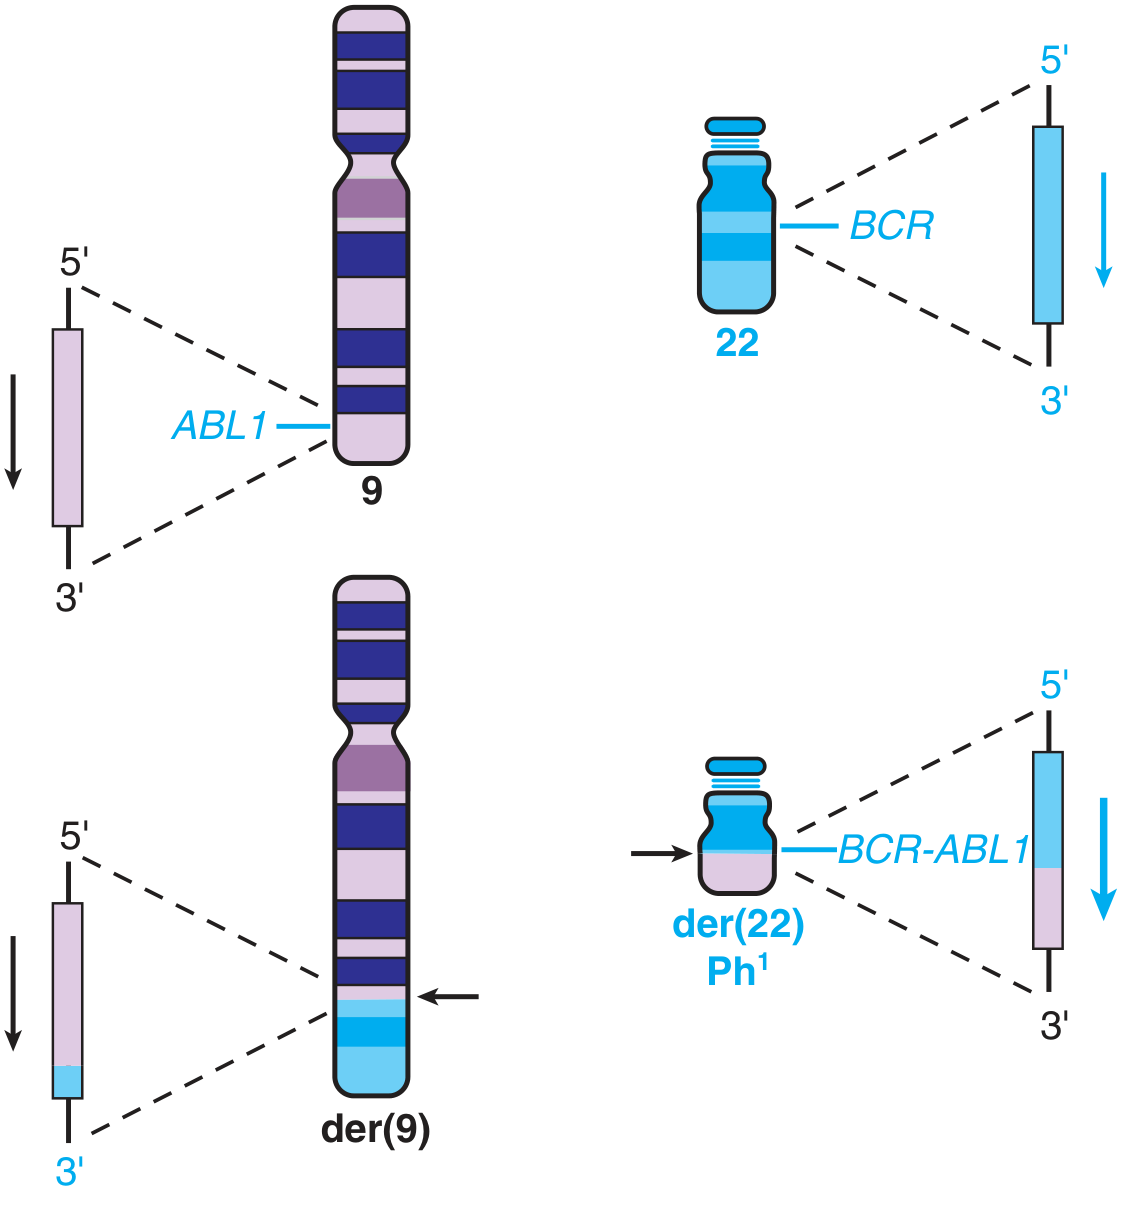
The Translocation
- t(9;22)(q34;q11) = reciprocal translocation between chromosomes 9 and 22
- The long arm of chromosome 22 is shortened - this is the Philadelphia (Ph) chromosome = der(22)
- The ABL gene from chromosome 9 (q34) fuses with the BCR gene on chromosome 22 (q11)
The Oncoproteins
| Breakpoint | mRNA | Protein | Associated Disease |
|---|---|---|---|
| M-BCR (e13a2 or e14a2) | p210 | BCR-ABL p210 | >95% of CML |
| m-BCR (e1a2) | p190 | BCR-ABL p190 | ~50% of Ph+ ALL |
| μ-BCR (e19a2) | p230 | BCR-ABL p230 | Chronic neutrophilic leukemia |
Mechanism of Action
- The BCR moiety contains a dimerization domain that causes constitutive self-association
- This activates the ABL tyrosine kinase moiety without ligand binding
- Activated ABL phosphorylates downstream substrates activating RAS and JAK/STAT pathways
- Results in: growth factor-independent proliferation + survival of granulocytic and megakaryocytic progenitors + abnormal release of immature forms from marrow
- Differentiation is preserved in the chronic phase (key: cells mature, just over-proliferate)
Frequency
- Ph chromosome by cytogenetics: >90% of CML cases
- Remaining ~5%: complex translocations involving chr 9, 22, and others
- Last ~5%: Ph-negative but BCR-ABL detectable by FISH or RT-PCR
Clinical Phases of CML
Phase Definitions (ELN vs WHO)
| Feature | Chronic Phase | Accelerated Phase | Blast Phase/Crisis |
|---|---|---|---|
| Blasts (ELN) | <15% | 15-29% | ≥30% |
| Blasts (WHO) | <10% | 10-19% | ≥20% |
| Basophils | <20% | ≥20% | - |
| Prognosis | Excellent with TKI | Intermediate | Poor (<1 yr survival untreated) |
| Duration (untreated) | ~3-5 years | ~6-12 months | <1 year |
Note: ELN criteria are more commonly used in clinical practice and trials.
Natural History (Untreated)
- Most patients (~75% in developed world) present in chronic phase
- Untreated chronic phase → accelerated phase → blast crisis within mean 3-5 years
- ~50% progress through accelerated phase first; the other ~50% jump directly to blast crisis
- At blast crisis: survival <1 year without transplant
Blast Crisis Lineage
- 70% myeloid blast crisis (myeloblasts)
- ~25-30% lymphoid blast crisis (pre-B cell blasts) - evidence for pluripotent HSC origin of CML
- Lymphoid blast crisis responds to ALL-like regimens
Cytogenetic Progression Markers
- Additional Ph chromosome (duplication)
- Trisomy 8
- Isochromosome 17q (i(17q))
- Trisomy 19
Clinical Features
Presentation
- >90% present in chronic phase, often incidentally discovered on routine CBC
- Symptoms (when present):
- Fatigue, weakness (from anemia)
- Abdominal discomfort - dragging sensation from massive splenomegaly
- Weight loss, night sweats, bone pain (more in advanced disease)
- Left upper quadrant pain - acute onset = splenic infarction
- Hypermetabolism signs due to rapid cell turnover
Key Signs
- Massive splenomegaly - hallmark finding (extensive extramedullary hematopoiesis)
- Mild hepatomegaly (extramedullary hematopoiesis)
- Lymphadenopathy (less common)
- No significant lymphadenopathy or bone tenderness in chronic phase typically
Laboratory Findings
Peripheral Blood Smear
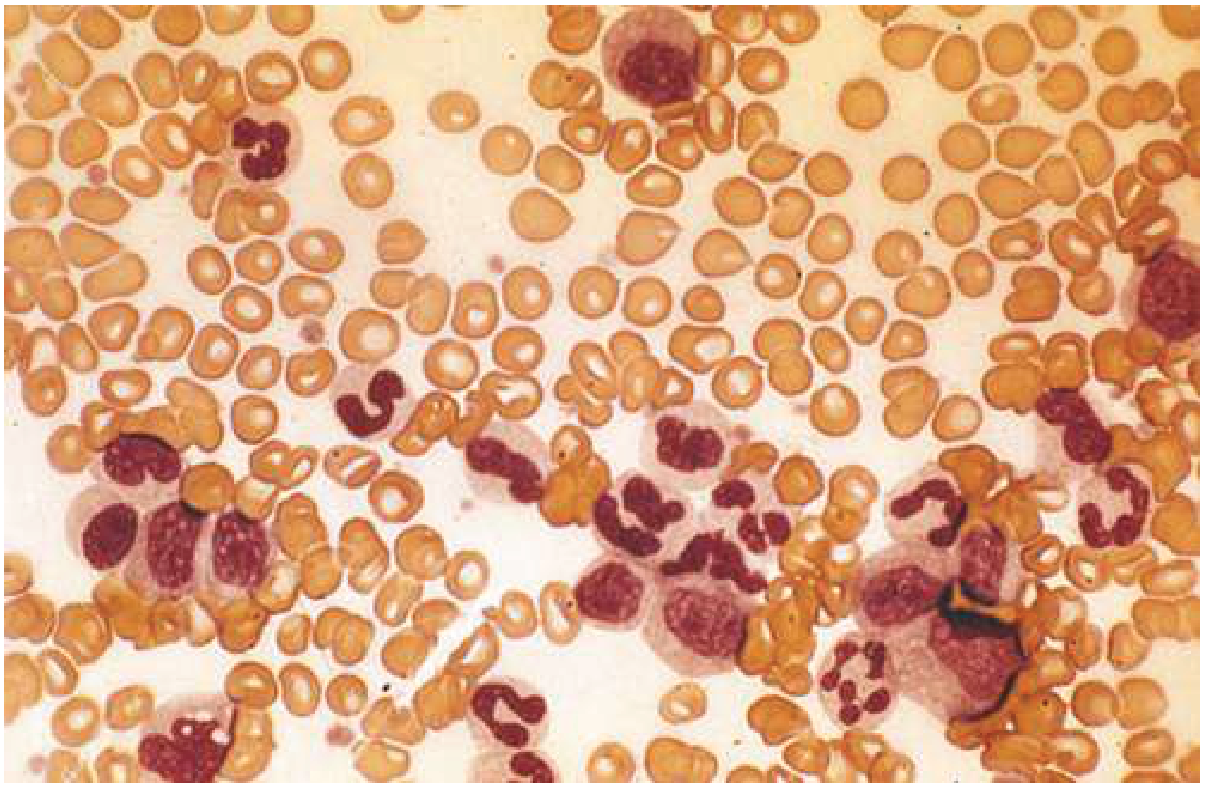
- Leukocytosis - often exceeds 100,000/µL
- Full myeloid spectrum on smear: neutrophils, bands, metamyelocytes, myelocytes, promyelocytes, occasional blasts
- "Myelocyte peak" = myelocytes > metamyelocytes (characteristic pattern)
- Basophilia - hallmark; independent adverse prognostic factor
- Eosinophilia
- Blasts typically <10% in chronic phase
- Thrombocytosis (platelets often elevated, sometimes markedly)
- Anemia (mild to moderate, normocytic)
- NO toxic granulation, NO Döhle bodies (distinguishes from leukemoid reaction)
Bone Marrow
- Markedly hypercellular (nearly 100% cellularity)
- Massively increased granulocytic precursors at all stages
- Elevated eosinophils and basophils
- Megakaryocytes increased - small dysplastic forms
- Sea-blue histiocytes (scattered macrophages with wrinkled green-blue cytoplasm) - characteristic
- Increased reticulin; overt fibrosis rare in chronic phase
- Erythroid progenitors normal or mildly decreased
Other Labs
| Test | CML |
|---|---|
| LAP/NAP score | Very LOW (0-15) |
| Vitamin B12 | Elevated (increased transcobalamin from leukemic cells) |
| Uric acid | Elevated (cell turnover) |
| LDH | Elevated |
| BCR-ABL (RT-PCR) | Positive |
| Philadelphia chromosome | Present (>90%) |
Diagnosis
| Level | Method | Use |
|---|---|---|
| Chromosome | Metaphase cytogenetics (karyotype) | Initial diagnosis, detects Ph + other abnormalities |
| DNA | FISH (Fluorescence in situ hybridization) | Detects BCR-ABL fusion gene; useful if cytogenetics fails; can be done on peripheral blood |
| mRNA | RT-PCR (Reverse transcriptase PCR) | Most sensitive; baseline for monitoring; quantitative (qPCR for minimal residual disease) |
- CBC + peripheral smear
- Bone marrow aspirate: morphology (blast count) + cytogenetics (Ph chromosome + other abnormalities)
- FISH if cytogenetics fail
- RT-PCR to establish baseline for therapy monitoring
Response Criteria During TKI Therapy
| Response Type | Definition | Target Timepoint |
|---|---|---|
| Hematologic Response (CHR) | Normal CBC, no blasts, no symptoms | 3 months |
| Cytogenetic Response (CyR) | Ph+ cells in marrow; CCyR = 0% Ph+ | 12 months |
| Molecular Response (MR) | BCR-ABL by RT-PCR; MMR = ≤0.1% (IS) | 12-18 months |
| Deep Molecular Response | MR4 = ≤0.01%; MR4.5 = ≤0.0032% | Prerequisite for TFR |
Treatment
First-Line: Tyrosine Kinase Inhibitors (TKIs)
| Drug | Generation | CCyR at 1 year | 5-year OS | Notable Side Effects |
|---|---|---|---|---|
| Imatinib (Gleevec/Glivec) | 1st | 65% at 5 yr | 83% at 11 yr | Muscle spasms (41%), edema (37%), hypophosphatemia |
| Dasatinib | 2nd | 86% at 2 yr | 91% at 5 yr | Neutropenia (29%), pleural effusion (28%), diarrhea |
| Nilotinib | 2nd | 85% at 4 yr | 94% at 54 months | Rash (38%), headache (32%), fatigue; QTc prolongation |
| Bosutinib | 2nd | 77% at 1 yr | N/A | Diarrhea (70%), elevated ALT |
| Ponatinib | 3rd | 45% at 2 yr | 90% at 2 yr | Vascular events; for T315I mutation |
Imatinib Resistance
- Primary resistance: BCR-ABL mutations (especially in tyrosine kinase domain and P-loop); T315I = "gatekeeper mutation" - resistant to all 1st and 2nd gen TKIs
- Secondary mechanisms: MDR1/P-glycoprotein overexpression; BCR-ABL amplification
- T315I → use ponatinib (3rd gen)
Advanced Phase Treatment
- Accelerated/blast phase: TKI + ALL-like or AML-like chemotherapy regimens
- Omacetaxine: approved for chronic and accelerated phase (non-TKI mechanism - inhibits protein synthesis)
- Allogeneic stem cell transplant (allo-SCT): reserved for TKI-resistant/intolerant patients, accelerated phase, blast crisis
Treatment-Free Remission (TFR)
- Patients who achieve deep molecular response (MR4 or MR4.5) for ≥2 years may attempt stopping TKI
- ~40-50% maintain remission off therapy - closely monitored by PCR
- Imatinib discontinuation is the paradigm ("STOP imatinib" studies)
CML vs. Leukemoid Reaction - Quick Reference
| Key discriminator | CML | Leukemoid Reaction |
|---|---|---|
| LAP score | Very low (0-15) | High (>120) |
| Basophilia | Present | Absent |
| BCR-ABL | Positive | Negative |
| Ph chromosome | Present | Absent |
| Toxic granulation | Absent | Present |
CML vs. Other MPNs
| Feature | CML | PV | ET | PMF |
|---|---|---|---|---|
| Molecular marker | BCR-ABL | JAK2 V617F (>95%) | JAK2/CALR/MPL | JAK2/CALR/MPL |
| WBC | Very high | Mildly elevated | Normal/mildly elevated | Variable |
| RBC | Low | Very high | Normal | Low |
| Platelets | Elevated | Elevated | Very high | Variable |
| LAP | Low | High | High | High |
| Splenomegaly | Massive | Moderate | Moderate | Massive |
| Blast crisis risk | Yes (~20-25%) | Rare | Rare | Yes (transformation) |
Summary of High-Yield Points for MBBS
- CML = BCR-ABL = Philadelphia chromosome t(9;22) - this is the most tested fact
- The Ph chromosome is the shortened chromosome 22 (der(22)), not chromosome 9
- BCR-ABL p210 is the oncogene in >95% of CML; p190 causes Ph+ ALL
- Peripheral smear shows "myelocyte peak" + basophilia + eosinophilia
- LAP score is very low (0-15) in CML - key differentiator from leukemoid reaction
- Natural history: chronic → accelerated → blast crisis (~3-5 years untreated)
- Blast crisis: 70% myeloid, 30% lymphoid
- Imatinib (first TKI) revolutionized CML therapy - transformed CML from fatal to a manageable chronic disease
- T315I = most important TKI resistance mutation; requires ponatinib (3rd gen TKI)
- Allo-SCT reserved for TKI failure or advanced phase
- Sea-blue histiocytes in bone marrow are a characteristic (though not specific) finding
- Massive splenomegaly is the hallmark clinical sign
How to differentiate from other leukemia
acute myeloid leukemia AML blast peripheral blood smear
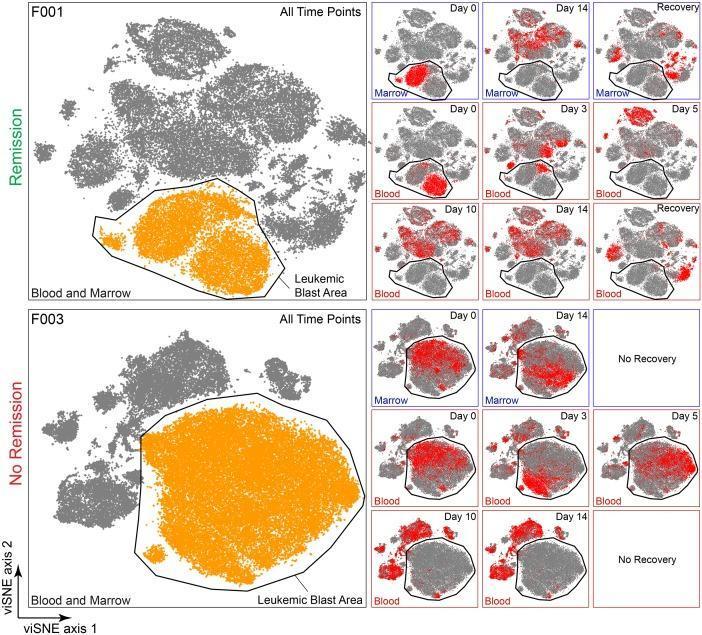
This infographic presents a 27-dimensional viSNE (visual t-distributed Stochastic Neighbor Embedding) analysis of mass cytometry data from two Acute Myeloid Leukemia (AML) patients, labeled F001 and F003, visualizing clinical response over time. The primary visualization for each patient includes a combined viSNE map of all live cells from all time points. A black outline demarcates the 'Leukemic Blast Area,' highlighted in orange, representing the phenotypic space occupied by malignant cells. Patient F001 is labeled 'Remission,' while Patient F003 is labeled 'No Remission.' To the right, series of longitudinal viSNE maps represent specific time points (Day 0, 3, 5, 10, 14, and Recovery) from both bone marrow and peripheral blood. In these temporal maps, cells from the specific time point are highlighted in red against a grey background of all historical cells. The visualization demonstrates educational concepts in hematology-oncology, specifically the clearance of malignant blasts in the remission patient (F001) versus the persistence of the leukemic population within the blast area in the non-remission patient (F003) across induction therapy.
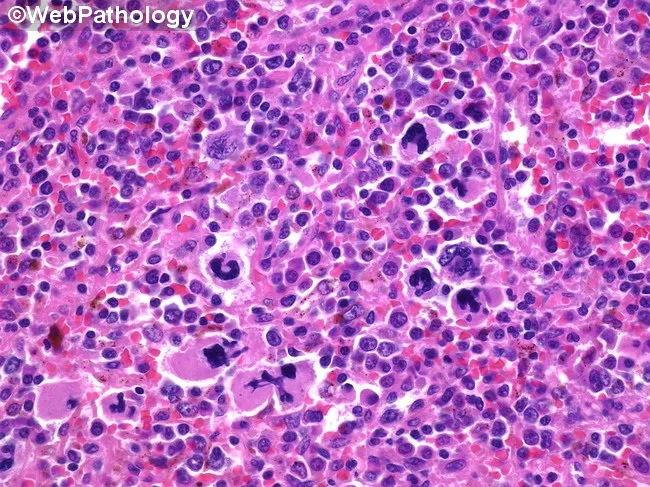
High-magnification brightfield micrograph of a human bone marrow aspirate smear stained with Hematoxylin and Eosin, demonstrating dysplastic megakaryocytes in a hematopoietic background. The megakaryocytes exhibit atypical nuclear morphology, including multinucleation, irregular lobulation, and nuclear fragmentation, with variable cytoplasmic basophilia. Background cellularity shows concurrent dyserythropoiesis and dysplastic myeloid precursors consistent with a myelodysplastic spectrum. Overall architecture may be hypercellular or variably cellular, with scattered normal hematopoietic elements interspersed among abnormal cells. Features are most prominent in the megakaryocytic lineage, where dysplasia is a salient hallmark. The image illustrates morphologic criteria that support a diagnosis in the context of possible progression toward acute leukemia, and should be correlated with peripheral blood counts, marrow blast percentage, cytogenetic and molecular studies. Clinically, such dysplastic megakaryocytes are associated with cytopenias and splenomegaly, and approximately a fifth of patients with related myelodysplastic/myeloproliferative conditions progress to acute myeloid leukemia. This representation is valuable for educational, diagnostic, and research purposes, particularly in studies of megakaryocytic dysplasia, MDS/AML continuum, prognostication, and therapeutic planning focused on palliation and cytopenia management. Careful documentation of features and context enhances reproducibility, supports standardized reporting, and facilitates cross-institutional data sharing for outcome studies and biomarker-driven clinical trials.
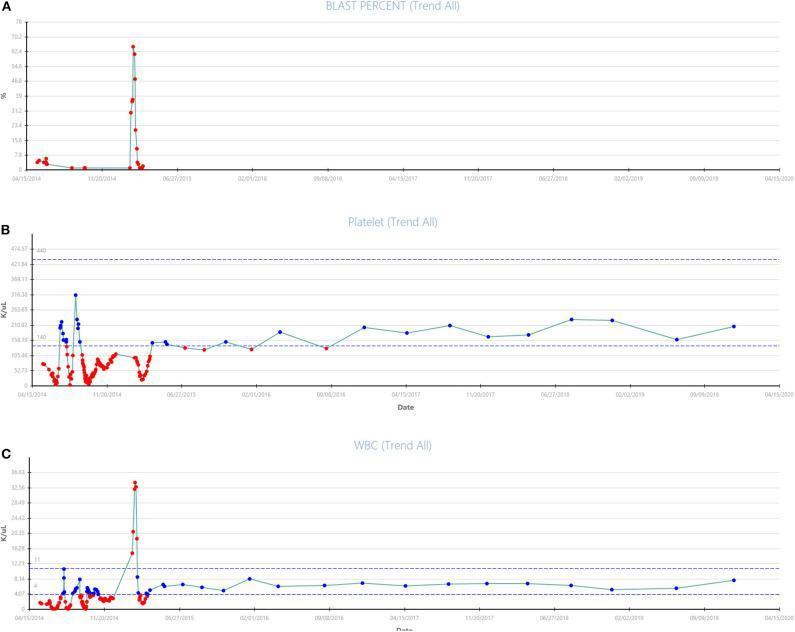
A composite clinical chart comprising three longitudinal line graphs (A, B, and C) tracking hematologic parameters in a patient over a multi-year period (2014–2020) during treatment for leukemia. Graph A (Blast Percent) displays a sharp, transient spike in peripheral blast percentage reaching approximately 70% in late 2014, followed by a rapid decline and sustained suppression near 0% through 2020, indicating successful induction of remission. Graph B (Platelet Trend) shows significant initial fluctuations in platelet count (range ~50–350 K/uL) before stabilizing within the normal to near-normal range (150–200 K/uL) following the initiation of combination therapy. Graph C (WBC Trend) illustrates a concurrent leukocytosis peak (~36 K/uL) coinciding with the blast crisis in late 2014, followed by stabilization within a normal range of 4–8 K/uL. These charts demonstrate the clinical efficacy of Vidaza (azacitidine) and Sorafenib in maintaining molecular and hematologic response in a patient with FLT3-mutated acute myeloid leukemia (AML).
Differentiating CML from Other Leukemias - Complete MBBS Notes
Quick Overview: The "Big 4" Leukemias
| Feature | CML | CLL | AML | ALL |
|---|---|---|---|---|
| Type | Chronic myeloid | Chronic lymphoid | Acute myeloid | Acute lymphoid |
| Cell of origin | Pluripotent HSC (myeloid bias) | Mature B-cell (99%) | Myeloid progenitor | Lymphoid progenitor (pre-B or pre-T) |
| Age peak | 5th-6th decade | >60 years (elderly) | Adults (median ~65 yr) | Children (peak 2-5 yr); 2nd peak in elderly |
| Onset | Insidious | Insidious | Acute | Acute |
| WBC | Very high (often >100,000) | Elevated (lymphocytes) | Variable; often elevated | Variable; often elevated |
| Specific marker | BCR-ABL / Ph chromosome | CD5+CD19+CD23+ B-cells | Auer rods / MPO+ | TdT+ / CD10+ |
| LAP score | Very low | Normal | Normal | Normal |
| Blast count | <10% (chronic phase) | <10% (mature lymphocytes, not blasts) | ≥20% (diagnostic threshold) | ≥20% lymphoblasts |
| Prognosis | Excellent (TKI era) | Indolent (variable) | Variable; often poor | Good in children (~85% cure); worse in adults |
1. CML vs CLL
Key Distinguishing Points
| Feature | CML | CLL |
|---|---|---|
| Cell type | Granulocytic (myeloid lineage) | Lymphocytic (B-cell, 99%) |
| Peripheral smear | All stages of myeloid series (myelocyte peak), basophilia, eosinophilia | Mature small lymphocytes + smudge/basket cells |
| Splenomegaly | Massive | Mild to moderate |
| Lymphadenopathy | Absent/mild | Prominent |
| Genetics | BCR-ABL / t(9;22) | Trisomy 12, del(13q), del(11q), del(17p) |
| Immunophenotype | Not helpful | CD5+, CD19+, CD23+, dim CD20, dim sIg |
| Smudge cells | Absent | Pathognomonic (fragile lymphocytes rupture on smear) |
| Basophilia | Present (hallmark) | Absent |
| LAP score | Very low | Normal |
| Treatment | TKIs (imatinib etc.) | Watch-and-wait or BTK inhibitors (ibrutinib) |
CLL Blood Smear
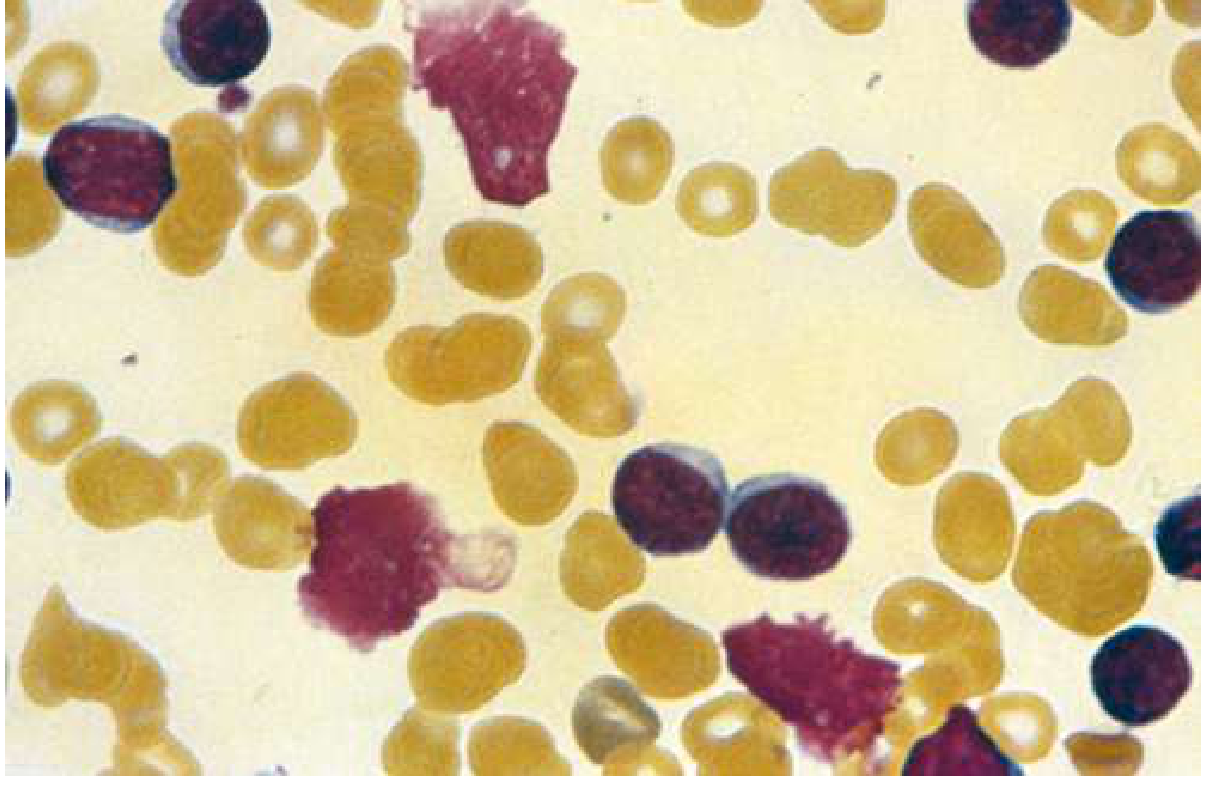
- Absolute B-lymphocyte count ≥5000/µL sustained >3 months
- Immunophenotype: CD5 + CD19 + CD23 co-expression with dim surface Ig (monoclonal) - definitive by flow cytometry
- Smudge cells correlate with more indolent disease
2. CML vs AML
Key Distinguishing Points
| Feature | CML | AML |
|---|---|---|
| Cell maturation | Preserved - full myeloid spectrum | Blocked - blasts accumulate, maturation halted |
| Blast count | <10% (chronic), 10-19% (accelerated), ≥20-30% (blast crisis) | ≥20% blasts = diagnostic |
| Auer rods | Absent in chronic phase | Present (pathognomonic for AML - not in ALL) |
| Peripheral smear | Full spectrum (myeloblasts to mature neutrophils) | Blasts predominate; "leukemic hiatus" - blasts + mature cells, few intermediates |
| Basophilia/eosinophilia | Yes | Not characteristic |
| Key cytogenetic | t(9;22) BCR-ABL | t(15;17) APL; t(8;21); inv(16); FLT3; NPM1 |
| Cytochemistry (MPO) | Neutrophils MPO+ (mature cells) | Blasts MPO+ (diagnostic for myeloid lineage) |
| Sudan Black B | Negative in blasts | Positive in myeloblasts |
| NSE (non-specific esterase) | Negative | Positive in monocytic AML (inhibited by NaF) |
| Presentation | Insidious, incidental | Acute: infection, bleeding, pallor, bruising |
| Cytopenia | Mild anemia; thrombocytosis common | Pancytopenia - typical |
| Bone marrow | Hypercellular, all myeloid series | Hypercellular, >20% blasts, arrest of maturation |
| Sea-blue histiocytes | Present in marrow | Not characteristic |
| DIC | Uncommon | Common in APL (AML-M3) |
| LAP | Very low | Normal |
Leukemic Hiatus (AML vs CML)
- AML: Blasts + mature neutrophils, with gap (few intermediate forms) = leukemic hiatus
- CML: Continuous spectrum from blasts to mature cells - no hiatus (full myeloid "ladder")
Key AML Cytogenetic Subtypes
| Cytogenetic Abnormality | AML Subtype | Key Feature |
|---|---|---|
| t(15;17)(q22;q12) | APL (M3) | PML-RARA; DIC; treat with ATRA + arsenic |
| t(8;21)(q22;q22) | AML with maturation (M2) | Auer rods common; Chloroma |
| inv(16)(p13;q22) | AML-M4Eo | Abnormal eosinophils in marrow |
| FLT3-ITD mutation | AML-M3, others | Poor prognosis; midostaurin |
| NPM1 mutation | Various AML | Good prognosis if FLT3-negative |
3. CML vs ALL
Key Distinguishing Points
| Feature | CML | ALL |
|---|---|---|
| Age | Adults (5th-6th decade) | Children (peak 2-5 yr); also adults |
| Cell type | Myeloid | Lymphoid (pre-B or pre-T) |
| Peripheral smear | Full myeloid spectrum | Lymphoblasts (fine chromatin, scant cytoplasm, small nucleoli) |
| Auer rods | Absent | Absent (Auer rods are myeloid only) |
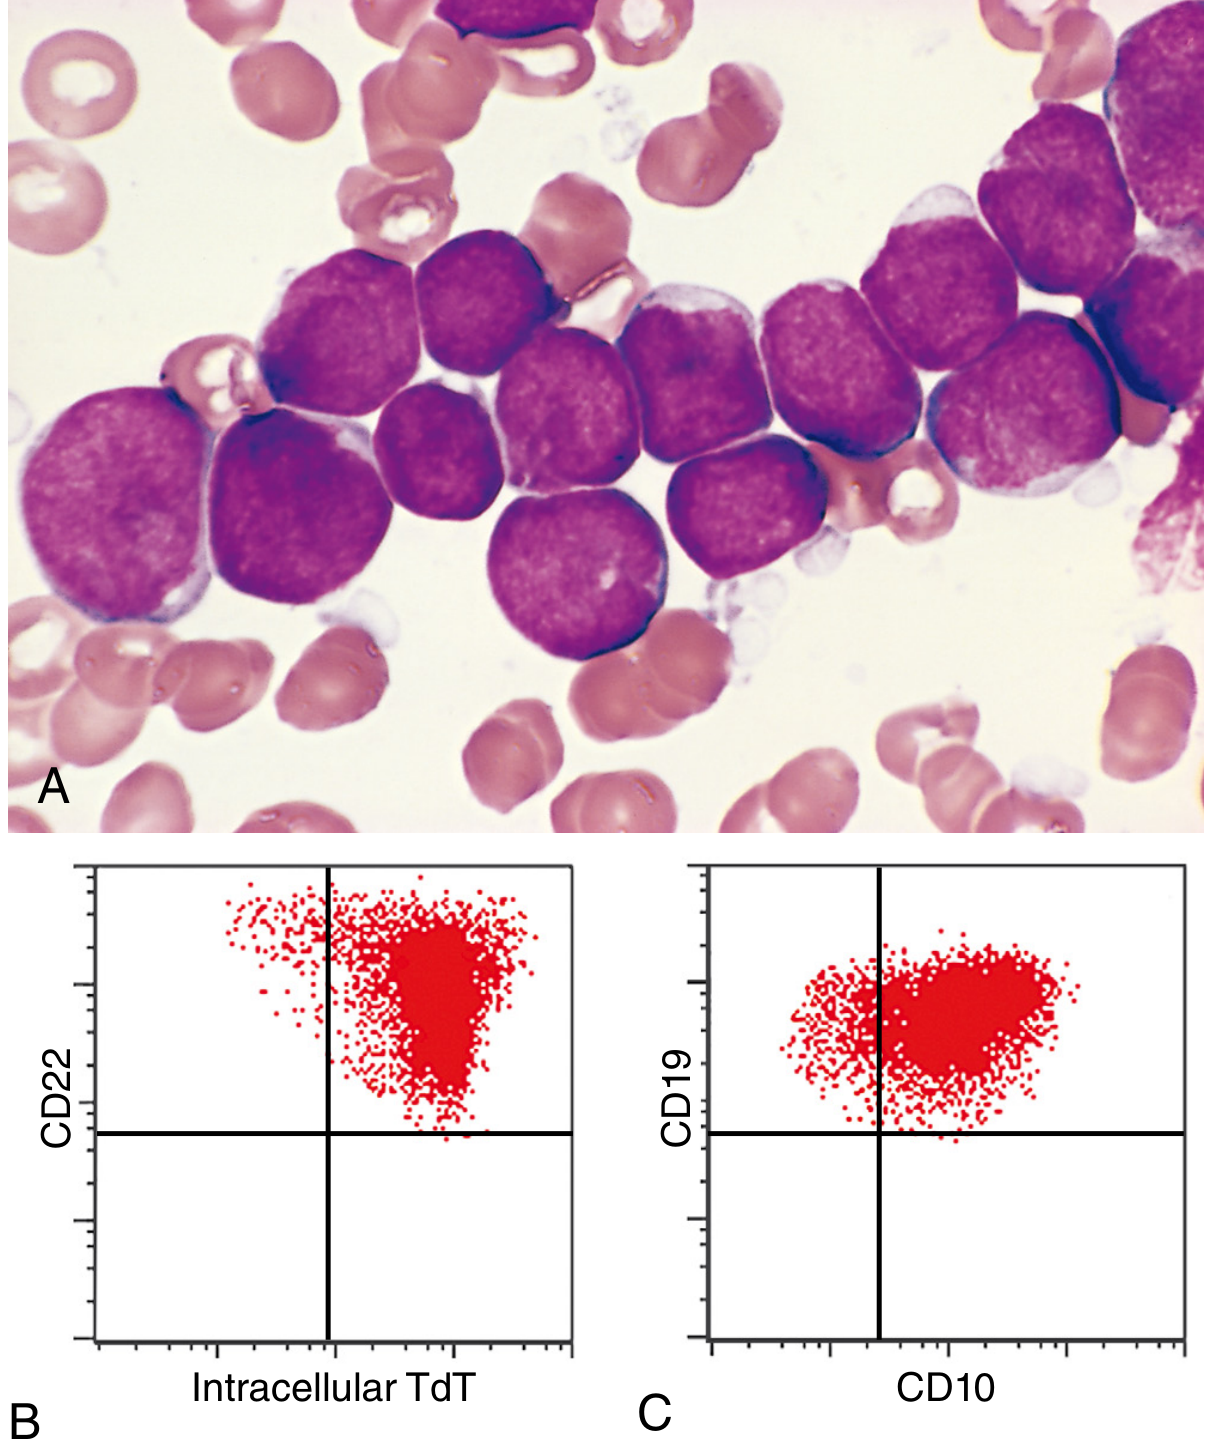
| TdT (terminal deoxynucleotidyl transferase) | Negative | Positive in >95% |
| MPO (myeloperoxidase) | Positive (in mature cells) | Negative (lymphoblasts) |
| PAS stain | Variable | Positive - block/rosary bead pattern |
| Sudan Black B | Positive (myeloid cells) | Negative or faintly positive |
| CD markers | Myeloid: CD13, CD33, MPO | B-ALL: CD19, CD22, CD10 (CALLA), TdT T-ALL: CD2, CD5, CD7, CD1 |
| Philadelphia chromosome | Present in CML | Present in ~25% of adult B-ALL (poor prognosis) |
| CNS involvement | Rare | Common - prophylactic intrathecal treatment |
| Mediastinal mass | Absent | Common in T-ALL (50-70%) |
| Starry sky pattern (marrow) | Absent | Present (apoptotic cells ingested by macrophages) |
| Treatment | TKIs (BCR-ABL targeted) | Multi-agent chemotherapy; TKI if Ph+ |
| Outcome | Excellent (TKI era) | Children: ~85-90% cure; Adults: ~40% |
ALL Blood Smear + Flow Cytometry
4. CML vs Leukemoid Reaction (Recap from previous session)
| Feature | CML | Leukemoid Reaction |
|---|---|---|
| LAP score | Very low (0-15) | High (>120) |
| BCR-ABL | Positive | Negative |
| Basophilia | Present | Absent |
| Splenomegaly | Massive | Absent |
| Toxic granulation | Absent | Present |
| Cause | Neoplastic | Reactive |
Master Comparison Table: All Four Leukemias
| Feature | CML | CLL | AML | ALL |
|---|---|---|---|---|
| Lineage | Myeloid (chronic) | Lymphoid/B-cell (chronic) | Myeloid (acute) | Lymphoid (acute) |
| Maturation | Preserved | Preserved (mature cells) | Blocked (>20% blasts) | Blocked (>20% blasts) |
| Typical age | Middle-aged adult | Elderly (>60) | Adult | Child (2-5 yr) |
| Onset | Insidious | Insidious | Acute | Acute |
| Hallmark finding | BCR-ABL, basophilia | Smudge cells, CD5+CD19+ | Auer rods, MPO+ | TdT+, CD10+/CD19+ |
| WBC | Very high (>100K) | Elevated (lymphos) | Variable | Variable |
| Anemia | Mild | Mild (AIHA possible) | Severe | Severe |
| Thrombocytopenia | No (thrombocytosis) | Mild/AITP possible | Yes | Yes |
| Splenomegaly | Massive | Mild-moderate | Mild | Mild |
| Lymphadenopathy | Minimal | Prominent | Minimal | Present (esp. T-ALL) |
| DIC | No | No | Yes (APL) | Rare |
| CNS disease | Rare | Rare | Rare | Common |
| Specific genetics | t(9;22) BCR-ABL | del(13q), trisomy 12, del(11q) | t(15;17), t(8;21), FLT3, NPM1 | ETV6-RUNX1, BCR-ABL (adult) |
| LAP score | Very low | Normal | Normal | Normal |
| TdT | Negative | Negative | Negative | Positive (>95%) |
| MPO | Positive (mature cells) | Negative | Positive (blasts) | Negative |
| Auer rods | Absent | Absent | Present (pathognomonic) | Absent |
| Smudge cells | Absent | Present | Absent | Absent |
| CD5 | Negative | Positive | Negative | Negative (T-ALL: CD5+) |
| CD10 (CALLA) | Negative | Negative | Negative | Positive (B-ALL) |
| BCR-ABL | 100% | Negative | Negative | ~25% adult B-ALL |
| Specific therapy | TKIs (imatinib) | BTK inhibitors, watch-wait | Daunorubicin + cytarabine ("7+3"); ATRA for APL | Multi-agent chemo; TKI if Ph+ |
| Prognosis | Excellent (TKI) | Indolent; variable | Poor-intermediate | Children: excellent; Adults: poor |
Cytochemistry Quick Summary (VERY High Yield)
| Stain | CML (mature cells) | AML (blasts) | ALL (blasts) | CLL |
|---|---|---|---|---|
| MPO (myeloperoxidase) | + | + (≥3% = myeloid) | - | - |
| Sudan Black B (SBB) | + | + (black) | - or faint grey | - |
| PAS | - | - (or diffuse) | + block/rosary bead | - |
| NSE (non-specific esterase) | - | + (monocytic), inhibited by NaF | - | - |
| TdT | - | - | +++ (>95%) | - |
| LAP | Very low | Normal | Normal | Normal |
Immunophenotype Summary
CML
- Mature myeloid cells: CD13+, CD33+, CD15+, MPO+
- No specific diagnostic immunophenotype needed - BCR-ABL is sufficient
CLL (Classic)
- CD5+ CD19+ CD23+ (co-expression of T-cell marker CD5 with B-cell marker CD19 is the hallmark)
- Dim CD20, dim surface Ig (light chain restricted - monoclonal)
- Negative: FMC7, CD10, cyclin D1
AML
- CD13+, CD33+, CD34+, HLA-DR+, MPO+
- APL (M3): CD34-, HLA-DR- (unusual - helps identify APL)
- Monocytic: CD14+, CD64+, NSE+
ALL (B-cell)
- TdT+ (universal for both B and T ALL)
- CD19+, CD22+, CD10+ (CALLA), PAX5+
- More mature: CD20+, cytoplasmic IgM+ (μ chain)
ALL (T-cell)
- TdT+
- CD2+, CD5+, CD7+ (T-cell markers)
- Often CD1+; variable CD3, CD4, CD8
Summary Mnemonic
- CML: BCR-ABL, Basophilia, Big spleen, Myelocyte peak
- CLL: CD5+CD19+, Smudge Cells, Slow/indolent, elderly
- AML: Auer rods (pathognomonic), MPO+, Adult acute illness, Arrest of maturation
- ALL: TdT+, CD10+, Lymphoblasts, Little children, L for lymphoid