
Investigation for pulmonary embolism
"pulmonary embolism"[MeSH Terms] AND diagnosis[MeSH Terms]
pulmonary embolism CT pulmonary angiography CTPA diagnosis algorithm
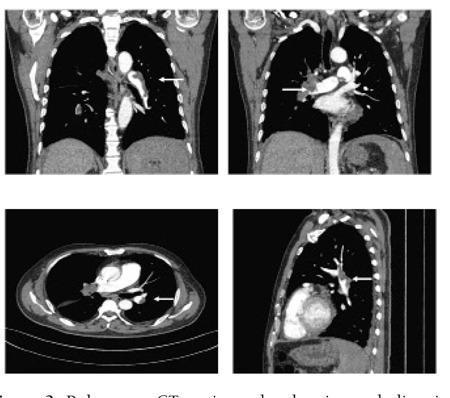
This diagnostic image set consists of four pulmonary CT angiography (CTPA) views, including coronal, axial, and sagittal planes. The primary finding is the presence of multiple, irregular intravascular filling defects within the bilateral pulmonary arteries and their segmental branches, indicated by white arrows. These defects represent acute pulmonary emboli causing varying degrees of luminal obstruction. In the coronal views, the emboli are visible in the proximal pulmonary vasculature, while the axial slice highlights a defect in the left pulmonary arterial tree. Secondary findings include small bilateral pleural effusions, visible as fluid accumulation in the dependent pleural spaces. The lung parenchyma shows localized areas of increased density/haziness. These images are clinically significant for the diagnosis of pulmonary embolism and associated secondary thoracic complications in a patient presenting with respiratory distress.
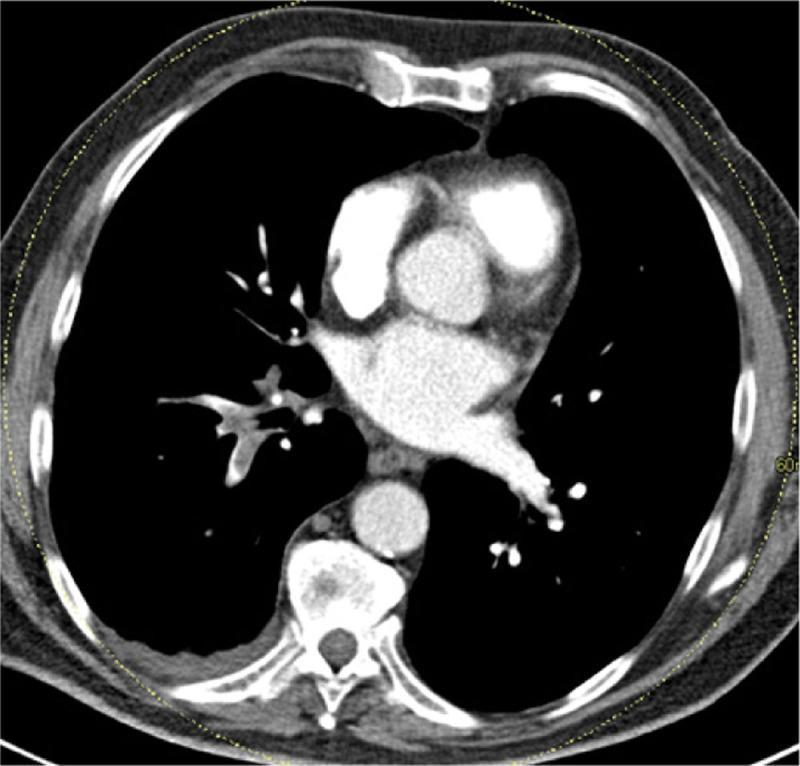
This diagnostic image is an axial contrast-enhanced CT Pulmonary Angiography (CTPA) of the thorax at the level of the main pulmonary artery bifurcation. The primary finding is the presence of multiple hypoattenuating intraluminal filling defects within the right pulmonary artery branches, characteristic of acute pulmonary embolism (PE). These defects represent thromboemboli partially or completely obstructing the vascular lumen. The mediastinal window demonstrates a patent ascending aorta, descending aorta, and superior vena cava with normal contrast opacification. The cardiac chambers visible at this level appear unremarkable in size. In the right posterior hemithorax, there is evidence of a small pleural effusion and adjacent dependent atelectasis or subpleural consolidation, which may correlate with pulmonary infarction in the clinical context of PE. The image serves as a classic educational example of utilizing CTPA for the definitive diagnosis of pulmonary thromboembolic disease by identifying pathognomonic filling defects in the pulmonary vasculature.
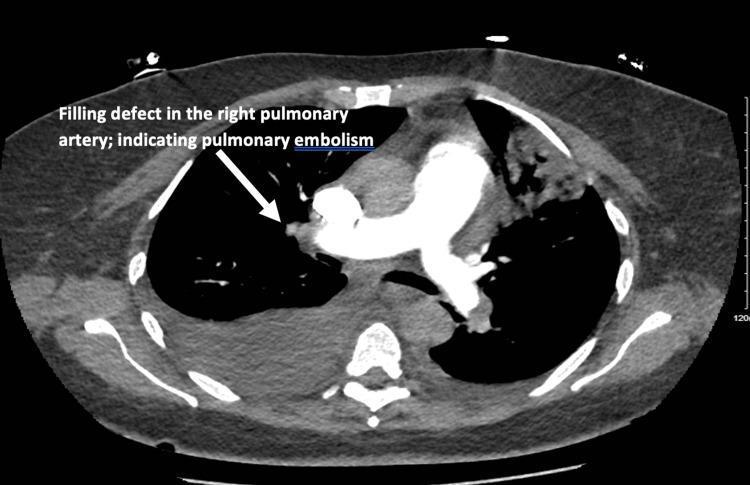
This diagnostic image is an axial contrast-enhanced CT pulmonary angiography (CTPA) of the thorax at the level of the main pulmonary artery bifurcation. The primary finding is an intraluminal filling defect located within the right pulmonary artery, indicated by a white arrow and text annotation, which is diagnostic of a pulmonary embolism (PE). This defect appears as a hypoattenuating area surrounded by hyperattenuating contrast medium within the vessel lumen. Additionally, there is evidence of bilateral pleural effusions, more pronounced on the right side, appearing as dependent, crescent-shaped areas of fluid attenuation in the posterior pleural spaces. The image demonstrates the hallmark radiological signs used in the emergency diagnosis of venous thromboembolism and associated thoracic fluid collections. It is intended for medical education regarding radiological manifestations of pulmonary vascular disease and secondary complications such as pleural fluid accumulation.
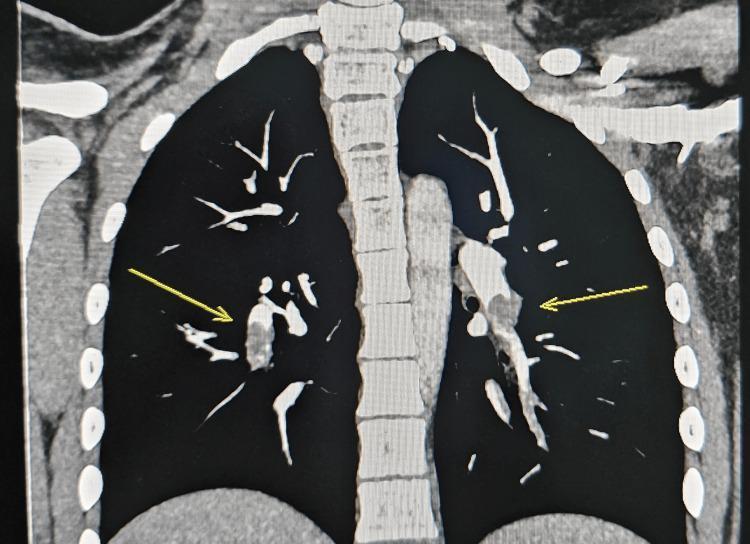
This coronal CT pulmonary angiography (CTPA) scan demonstrates acute pulmonary embolism. The image focuses on the pulmonary vasculature, specifically the arteries supplying the lower lobes of both lungs. Yellow arrows indicate prominent intraluminal filling defects within the left and right pulmonary arteries. These defects appear as hypoattenuating (darker) areas within the bright, contrast-opacified blood vessels, signifying the presence of thrombi that obstruct blood flow. The filling defects result in irregular vessel outlines and a disruption of the continuous contrast enhancement typically seen in healthy arteries. The surrounding lung parenchyma appears clear with normal attenuation, showing no immediate signs of pulmonary infarction, consolidation, or pleural effusion. This diagnostic image serves as a classic illustration of bilateral pulmonary embolism in a clinical setting, emphasizing the importance of vascular contrast imaging for identifying life-threatening thromboembolic events.
pulmonary embolism Wells score diagnostic algorithm D-dimer flowchart
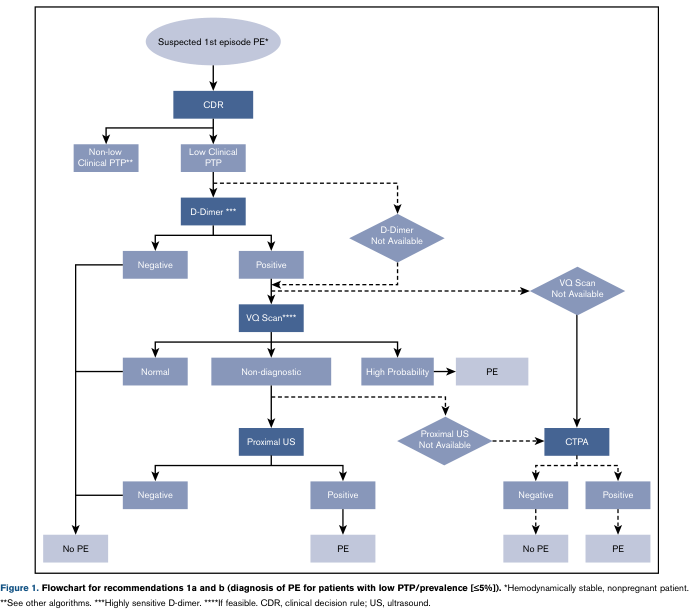
Summary : This flowchart outlines the diagnostic pathway for suspected first episode pulmonary embolism (PE) in hemodynamically stable, nonpregnant patients with low pre-test probability (PTP ≤5%), based on clinical decision rules (CDR), D-dimer testing, ventilation-perfusion (VQ) scan, proximal ultrasound (US), and computed tomography pulmonary angiography (CTPA). flowchart: # Nodes : • Start (ellipse): "Suspected 1st episode PE*" • Decision (rectangle): "CDR" • Branch (rectangle): "Non-low Clinical PTP**" • Branch (rectangle): "Low Clinical PTP" • Test (rectangle): "D-Dimer***" • Result (rectangle): "Negative" • Result (rectangle): "Positive" • Alternative (parallelogram): "D-Dimer Not Available" • Test (rectangle): "VQ Scan****" • Result (rectangle): "Normal" • Result (rectangle): "Non-diagnostic" • Result (rectangle): "High Probability" • Diagnosis (rectangle): "PE" • Test (rectangle): "Proximal US" • Result (rectangle): "Negative" • Result (rectangle): "Positive" • Diagnosis (rectangle): "No PE" • Alternative (parallelogram): "VQ Scan Not Available" • Test (rectangle): "CTPA" • Result (rectangle): "Negative" • Result (rectangle): "Positive" • Alternative (parallelogram): "Proximal US Not Available" # Connectors : • Downward arrows indicate progression through the diagnostic pathway. • From "Suspected 1st episode PE*" to "CDR". • "CDR" splits into "Non-low Clinical PTP**" (left) and "Low Clinical PTP" (right). • "Low Clinical PTP" leads to "D-Dimer***". • "D-Dimer***" splits into "Negative" (left) and "Positive" (right). • "Negative" leads to "No PE". • "Positive" leads to "VQ Scan****". • "D-Dimer Not Available" (dashed arrow from "Low Clinical PTP") leads to "VQ Scan****". • "VQ Scan****" splits into "Normal", "Non-diagnostic", and "High Probability". • "Normal" leads to "No PE". • "High Probability" leads to "PE". • "Non-diagnostic" leads to "Proximal US". • "Proximal US" splits into "Negative" (to "No PE") and "Positive" (to "PE"). • "Proximal US Not Available" (dashed arrow from "Non-diagnostic") leads to "CTPA". • "VQ Scan Not Available" (dashed arrow from "D-Dimer Not Available") leads to "CTPA". • "CTPA" splits into "Negative" (to "No PE") and "Positive" (to "PE"). # Layout : • The flowchart is organized top-down, with decision points and tests branching horizontally. • Dashed arrows indicate alternative pathways when certain tests are not available. • The chart merges at diagnostic endpoints: "No PE" or "PE". # Analysis : • The flowchart provides a structured, stepwise approach for diagnosing PE in low PTP patients. • It prioritizes non-invasive tests (D-dimer, VQ scan) and reserves imaging (CTPA) for cases where initial tests are unavailable or inconclusive. • The use of dashed arrows highlights contingency plans for test unavailability, ensuring diagnostic continuity. • The pathway minimizes unnecessary imaging in low-risk patients, reducing exposure and resource use.
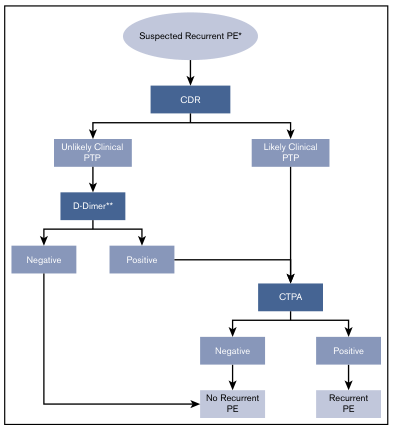
Summary : This flowchart outlines the diagnostic pathway for suspected recurrent pulmonary embolism (PE), using clinical decision rules (CDR), clinical pre-test probability (PTP), D-Dimer testing, and computed tomography pulmonary angiography (CTPA) to determine the presence or absence of recurrent PE. flowchart: # Nodes : • Suspected Recurrent PE* (ellipse) • CDR (rectangle) • Unlikely Clinical PTP (rectangle) • D-Dimer** (rectangle) • Negative (rectangle) • Positive (rectangle) • Likely Clinical PTP (rectangle) • CTPA (rectangle) • Negative (rectangle) • Positive (rectangle) • No Recurrent PE (rectangle) • Recurrent PE (rectangle) # Connectors : • Arrow from Suspected Recurrent PE* to CDR. • CDR splits into two branches: Unlikely Clinical PTP and Likely Clinical PTP. • Unlikely Clinical PTP leads to D-Dimer**. • D-Dimer** splits into Negative and Positive. • Negative leads to No Recurrent PE. • Positive leads to CTPA. • Likely Clinical PTP leads directly to CTPA. • CTPA splits into Negative and Positive. • Negative leads to No Recurrent PE. • Positive leads to Recurrent PE. # Layout : • Top-down hierarchical structure. • Initial decision node (CDR) branches into two parallel diagnostic pathways (Unlikely vs. Likely Clinical PTP). • Both pathways converge at CTPA if D-Dimer is positive or Likely Clinical PTP is present. • Final outcomes are No Recurrent PE or Recurrent PE. # Analysis : • The flowchart provides a clear, stepwise approach for evaluating suspected recurrent PE. • Patients with unlikely clinical PTP undergo D-Dimer testing, with negative results ruling out recurrent PE and positive results prompting further imaging. • Patients with likely clinical PTP proceed directly to CTPA. • CTPA results determine the final diagnosis of recurrent PE or its exclusion. • The process ensures efficient use of diagnostic resources and minimizes unnecessary imaging.
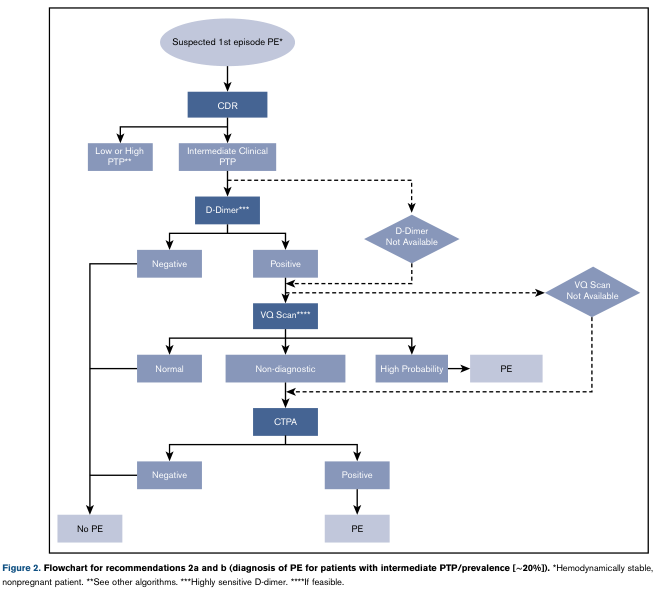
Summary : This flowchart outlines the diagnostic pathway for suspected first episode pulmonary embolism (PE) in hemodynamically stable, nonpregnant patients with intermediate clinical pre-test probability (PTP), as per recommendations 2a and 2b. flowchart: # Nodes : • Suspected 1st episode PE* (ellipse) • CDR (rectangle) • Low or High PTP** (rectangle) • Intermediate Clinical PTP (rectangle) • D-Dimer*** (rectangle) • Negative (rectangle) • Positive (rectangle) • D-Dimer Not Available (rectangle) • VQ Scan**** (rectangle) • VQ Scan Not Available (diamond) • Normal (rectangle) • Non-diagnostic (rectangle) • High Probability (rectangle) • CTPA (rectangle) • Negative (rectangle) • Positive (rectangle) • No PE (rectangle) • PE (rectangle) # Connectors : • Downward arrows from "Suspected 1st episode PE*" to "CDR". • "CDR" splits to "Low or High PTP**" and "Intermediate Clinical PTP". • "Intermediate Clinical PTP" leads to "D-Dimer***". • "D-Dimer***" branches to "Negative" (left) and "Positive" (right). • "Negative" leads to "No PE". • "Positive" leads to "VQ Scan****". • "D-Dimer Not Available" (right branch from "Intermediate Clinical PTP") leads to "VQ Scan****". • "VQ Scan****" branches to "Normal", "Non-diagnostic", and "High Probability". • "Normal" leads to "No PE". • "High Probability" leads to "PE". • "Non-diagnostic" leads to "CTPA". • "CTPA" branches to "Negative" (left) and "Positive" (right). • "Negative" leads to "No PE". • "Positive" leads to "PE". • If "VQ Scan Not Available", arrows direct to "CTPA". • Dashed lines indicate alternative routes if D-Dimer or VQ Scan are not available. # Layout : • Top-down hierarchical structure. • Initial decision splits into three main branches: Low/High PTP, Intermediate Clinical PTP with D-Dimer, and D-Dimer Not Available. • Multiple feedback loops and alternative routes using dashed lines for unavailable tests. • Merges at "CTPA" for non-diagnostic or unavailable VQ scan results. # Analysis : • The flowchart provides a stepwise approach to diagnosing PE, prioritizing non-invasive tests (D-Dimer, VQ scan) before proceeding to CTPA. • Negative results at each step lead to exclusion of PE, while positive or high-probability results confirm PE. • The algorithm accounts for test availability, offering alternative diagnostic routes. • The structure ensures efficient use of resources and minimizes unnecessary imaging.
Investigation for Pulmonary Embolism (PE)
Step 1: Assess Pre-test Probability
Wells Score for PE (most widely used)
| Clinical Variable | Points |
|---|---|
| Clinical signs/symptoms of DVT | 3 |
| PE is most likely diagnosis (or equally likely) | 3 |
| Heart rate > 100 bpm | 1.5 |
| Immobilization or surgery in previous 4 weeks | 1.5 |
| Previous DVT or PE | 1.5 |
| Hemoptysis | 1 |
| Active malignancy (treatment within 6 months, or palliative) | 1 |
- 0-1 points = Low probability
- 2-6 points = Moderate probability
- ≥7 points = High probability
PERC Rule (Pulmonary Embolism Rule-Out Criteria)
- Age < 50
- HR < 100 bpm
- SpO₂ ≥ 95%
- No prior DVT or PE
- No recent surgery or trauma requiring hospitalisation in past 4 weeks
- No unilateral leg swelling
- No hemoptysis
- No exogenous estrogen use
Step 2: D-Dimer
What it is
When to use
- In low or moderate pre-test probability patients: a negative high-sensitivity D-dimer (<500 ng/mL FEU) effectively rules out PE. A negative D-dimer with a Wells score ≤4 has a missed-diagnosis rate of only 0.5%.
- In high pre-test probability: D-dimer is not useful - proceed directly to imaging.
- D-dimer is not specific: it is elevated in infection, inflammation, malignancy, post-surgery, pregnancy, and age.
Age-adjusted D-dimer
Step 3: Imaging
CT Pulmonary Angiography (CTPA) - First-line Imaging
- Direct visualization of thrombi in the pulmonary arteries down to segmental level
- Wide availability and rapid results
- Ability to provide an alternative diagnosis in patients who do not have PE
- Sensitivity ~83% (increases to ~90% when combined with CT venography), specificity adequate for stand-alone use
Ventilation-Perfusion (V/Q) Scanning
- Contrast allergy
- Renal impairment (eGFR too low for contrast)
- Pregnancy (lower radiation dose to thorax vs. CTPA)
- SPECT-V/Q delivers roughly one-third the radiation dose of CTPA
- Ventilation phase: inhalation of radioactive xenon or technetium aerosol
- Perfusion phase: IV injection of technetium-labeled macroaggregated albumin; occluded segments show absent uptake
- A V/Q mismatch (normal ventilation + reduced perfusion) indicates PE
| Result | Interpretation |
|---|---|
| Normal perfusion | PE excluded |
| High probability (≥1 segmental mismatch) | PE confirmed |
| Non-diagnostic | Further testing needed (proximal US or CTPA) |
Duplex (Compression) Ultrasonography of the Legs
- Detects proximal DVT, which serves as a surrogate marker for PE
- Sensitivity ~95%, specificity ~96% for proximal DVT; lower sensitivity for isolated calf DVT
- Used when:
- CTPA is contraindicated
- A high-risk patient has a negative CTPA (combined CTA + duplex has ~100% NPV)
- Serial negative ultrasounds in a patient with adequate pulmonary reserve can safely exclude PE
- Non-compressibility of the vein at a single point is diagnostic of DVT - Murray & Nadel's Textbook of Respiratory Medicine
CT Venography (CTV)
Pulmonary Angiography (Conventional)
Echocardiography
- Massive/high-risk PE: may show right ventricular dilation, septal bowing (D-sign), reduced RV function, or McConnell sign (RV free wall akinesia with preserved apex)
- Hemodynamically unstable patients where CTPA is not immediately possible
- Differentiating from other causes of acute decompensation (tamponade, aortic dissection)
Step 4: Additional Blood Tests
| Test | Purpose |
|---|---|
| ABG / SpO₂ | Hypoxemia, low PaCO₂ (from hyperventilation); may be normal in small PE |
| Troponin (I or T) | Marker of RV myocardial injury; elevated = higher mortality risk |
| BNP / NT-proBNP | Marker of RV strain; used for risk stratification, not diagnosis |
| FBC, U&E, LFTs | Baseline before anticoagulation |
| Coagulation screen (PT/APTT) | Baseline; check for thrombophilia later if unprovoked |
| Thrombophilia screen | Defer until off anticoagulation; indicated for unprovoked PE, young patients, recurrent VTE |
Diagnostic Algorithm Summary
- Apply clinical decision rule (Wells / Geneva / PERC)
- Low probability + PERC negative → PE excluded, no further testing
- Low/moderate probability + PERC positive → D-dimer
- Negative D-dimer → PE excluded
- Positive D-dimer → Imaging (CTPA or V/Q)
- High probability → Proceed directly to CTPA (D-dimer not useful)
- CTPA positive → PE confirmed
- CTPA negative in high-risk patients → Consider duplex leg US + V/Q scan + pulmonary angiography
Special Situations
| Situation | Preferred Investigation |
|---|---|
| Pregnancy | V/Q scan (lower fetal radiation) or CTPA (lower breast radiation); D-dimer unreliable in pregnancy |
| Renal impairment / contrast allergy | V/Q scan |
| Hemodynamically unstable | Bedside echocardiography; proceed to empirical thrombolysis if PE confirmed or strongly suspected |
| Massive PE (arrest or near-arrest) | Clinical diagnosis + echocardiography sufficient; do not delay treatment for CTPA |
| Subsegmental PE on CTPA | Lower limb US to assess DVT burden; consider whether anticoagulation is needed |
- Murray & Nadel's Textbook of Respiratory Medicine, Chapter 81
- Goldman-Cecil Medicine, Chapter 68
- Symptom to Diagnosis: An Evidence-Based Guide, 4th Ed., Chapter 15