
Write about ecg changes in hypokalemia hyperkalemia and myocardial infarction
Reading File
Finding Sources
Finding Sources
Finding Sources
Finding Sources
Finding Sources
Finding Sources
Reading File
Reading File
Reading File
Reading File
Reading File
Reading File
Loading Image
Loading Image
Reading File
Reading File
Loading Image
I now have comprehensive information from multiple authoritative textbooks. Let me compose the full, detailed answer.
ECG Changes in Hypokalemia, Hyperkalemia, and Myocardial Infarction
1. Hypokalemia
Normal serum K+: 3.5-5.0 mEq/L. Hypokalemia: <3.5 mEq/L.
Hypokalemia prolongs repolarization and increases myocardial excitability, reflected in progressive ECG changes as potassium falls:
ECG Changes (in order of severity)
| Serum K+ (mEq/L) | ECG Finding |
|---|---|
| ~3.5 | Low/flat T wave |
| ~3.0 | Low T wave + prominent U wave |
| ~2.5 | Low T wave, high U wave, ST-segment depression |
| <2.0 | T-U fusion, prolonged apparent QT (actually Q-U interval), ventricular arrhythmias |
Key features:
- T-wave flattening or inversion - the earliest and most characteristic sign
- Prominent U wave - a positive deflection after the T wave, best seen in V2-V3. The U wave becomes taller than the T wave in significant hypokalemia.
- ST-segment depression - occurs with moderate-to-severe hypokalemia (K+ 2-2.5 mEq/L)
- Apparent QT prolongation - this is actually a Q-U (not Q-T) interval, because the U wave merges with the T wave
- Arrhythmias - atrial fibrillation, ventricular extrasystoles, and in severe cases, ventricular tachycardia/fibrillation (risk is amplified in patients on digoxin or with ischemic heart disease)
"Moderate-to-severe hypokalemia (2-2.5 mEq/L) leads to muscle weakness, ECG abnormalities (ST-segment depression, T-wave depression, U-wave elevation), and arrhythmias (atrial fibrillation and ventricular extrasystoles)." - Miller's Anesthesia, 10e
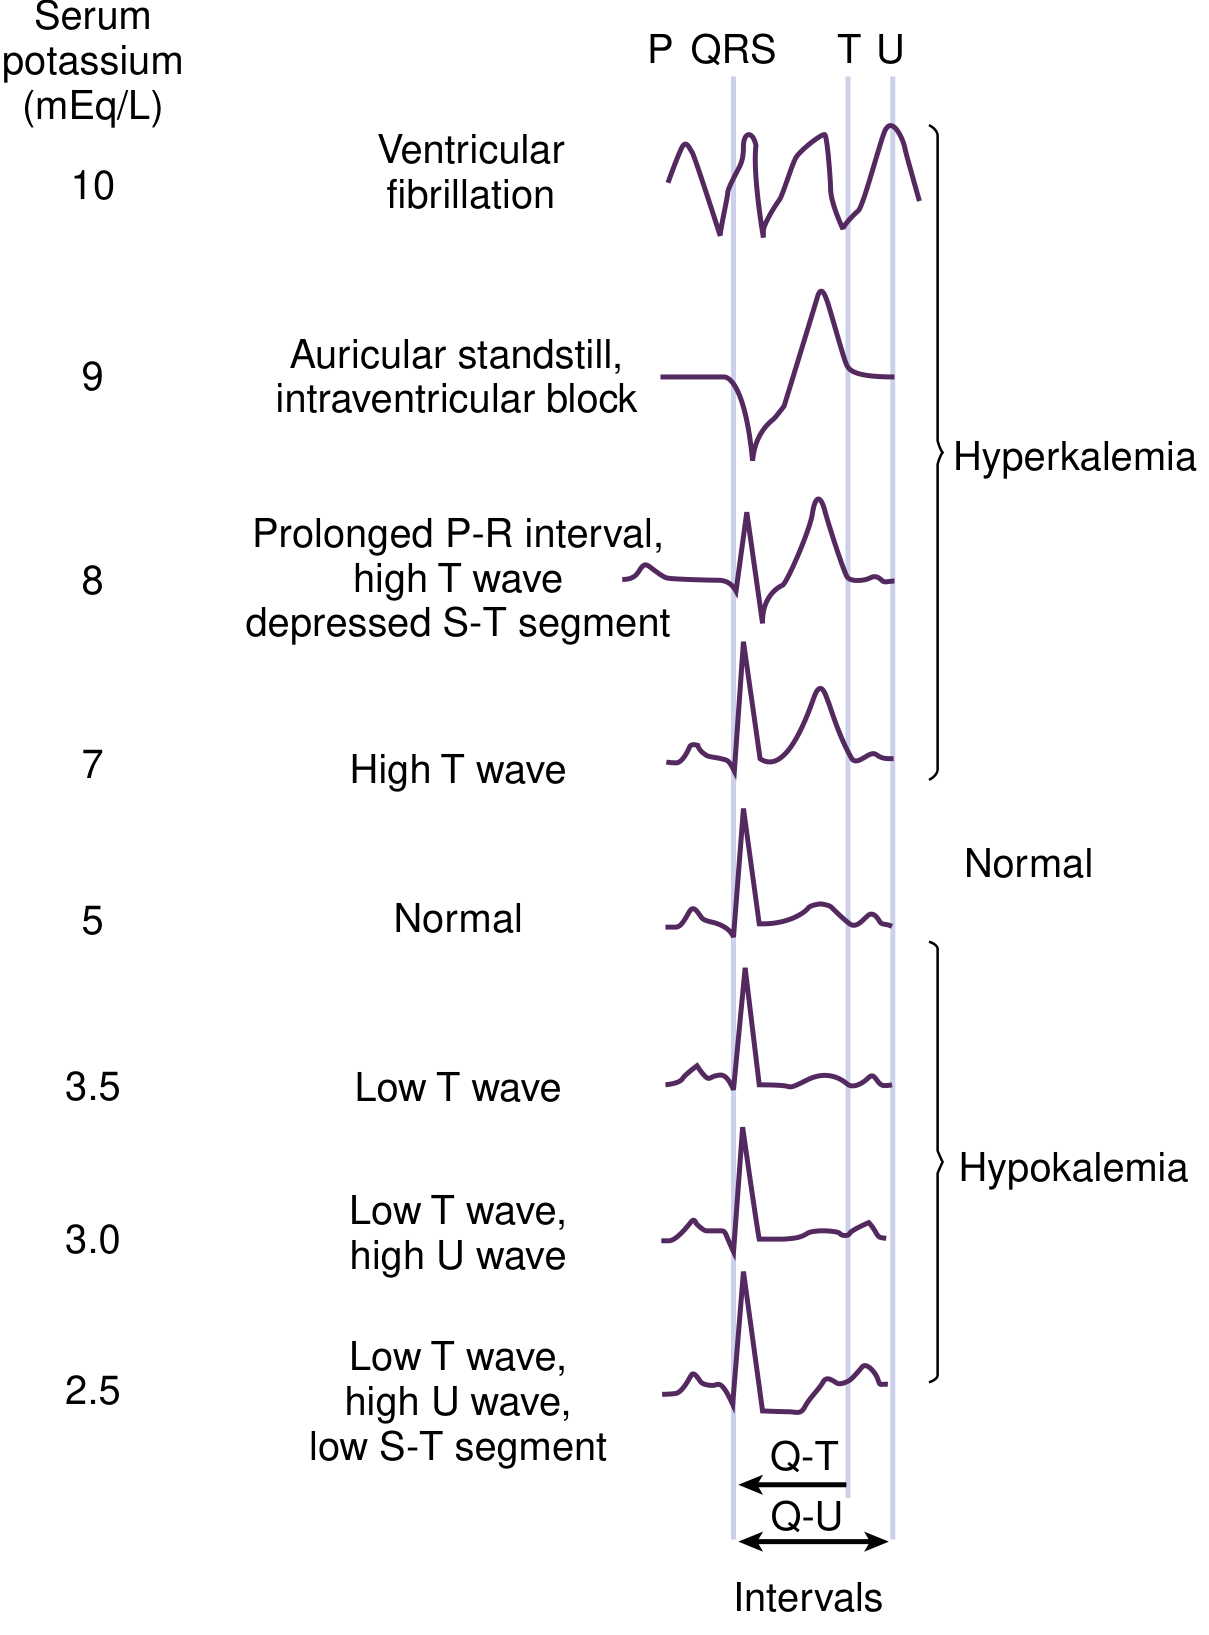
Typical ECG waveform changes correlated with serum potassium levels - National Kidney Foundation Primer on Kidney Diseases, 8e
2. Hyperkalemia
Hyperkalemia: >5.5 mEq/L. Life-threatening at >7.0 mEq/L.
Hyperkalemia reduces the resting membrane potential and slows conduction throughout the heart. ECG changes progress in a predictable, sequential fashion with rising K+ levels.
ECG Changes (Sequential Progression)
| Serum K+ (mEq/L) | ECG Finding |
|---|---|
| 5.5 - 6.5 | Tall, peaked (tented) T waves with shortened QT interval |
| 6.5 - 7.5 | Flattening of P waves, prolonged PR interval |
| 7.0 - 8.0 | Widened QRS complex (intraventricular conduction delay) |
| 8.0 - 9.0 | P wave disappears (atrial standstill / auricular standstill) |
| >9.0 | Sine wave pattern (QRS merges with T wave), ventricular fibrillation, asystole |
Key features explained:
- Peaked T waves are symmetric, narrow, and "tented" in shape - the hallmark early sign. This reflects enhanced/accelerated repolarization.
- P-wave flattening and disappearance reflects impaired atrial conduction (sinoatrial and atrial conduction slowing).
- PR prolongation reflects delayed AV nodal conduction.
- QRS widening reflects slowed intraventricular conduction (similar to bundle branch block pattern).
- Sine wave pattern - the QRS and T wave become indistinguishable, representing severe, life-threatening toxicity.
- Ventricular fibrillation or asystole can occur at any stage of progression; it is not strictly linear.
"The ECG is helpful in making the diagnosis of hyperkalemia and can be used in unstable patients to initiate treatment. Classic electrocardiographic changes - the peaked T wave, flattened P wave with prolonged PR interval..." - Rosen's Emergency Medicine
"Hypocalcemia, hyponatremia, and acidosis accentuate the cardiac effects of hyperkalemia." - Morgan & Mikhail's Clinical Anesthesiology, 7e
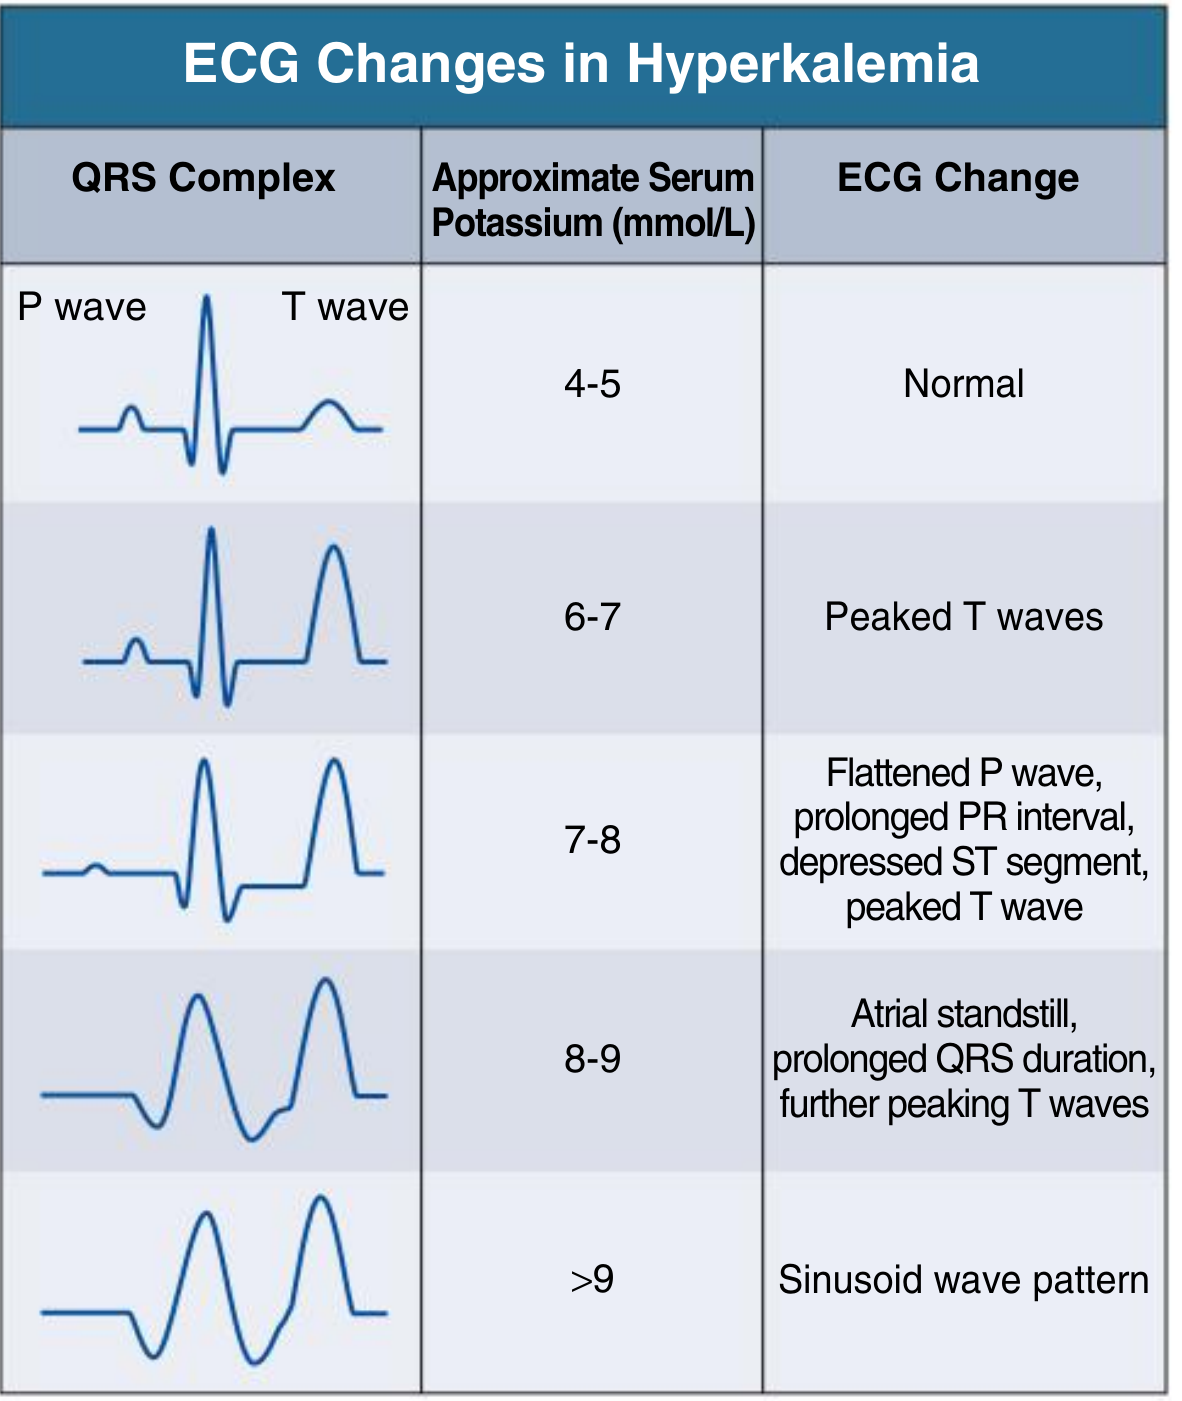
Progressive ECG changes in hyperkalemia correlated with serum K+ - Comprehensive Clinical Nephrology, 7e
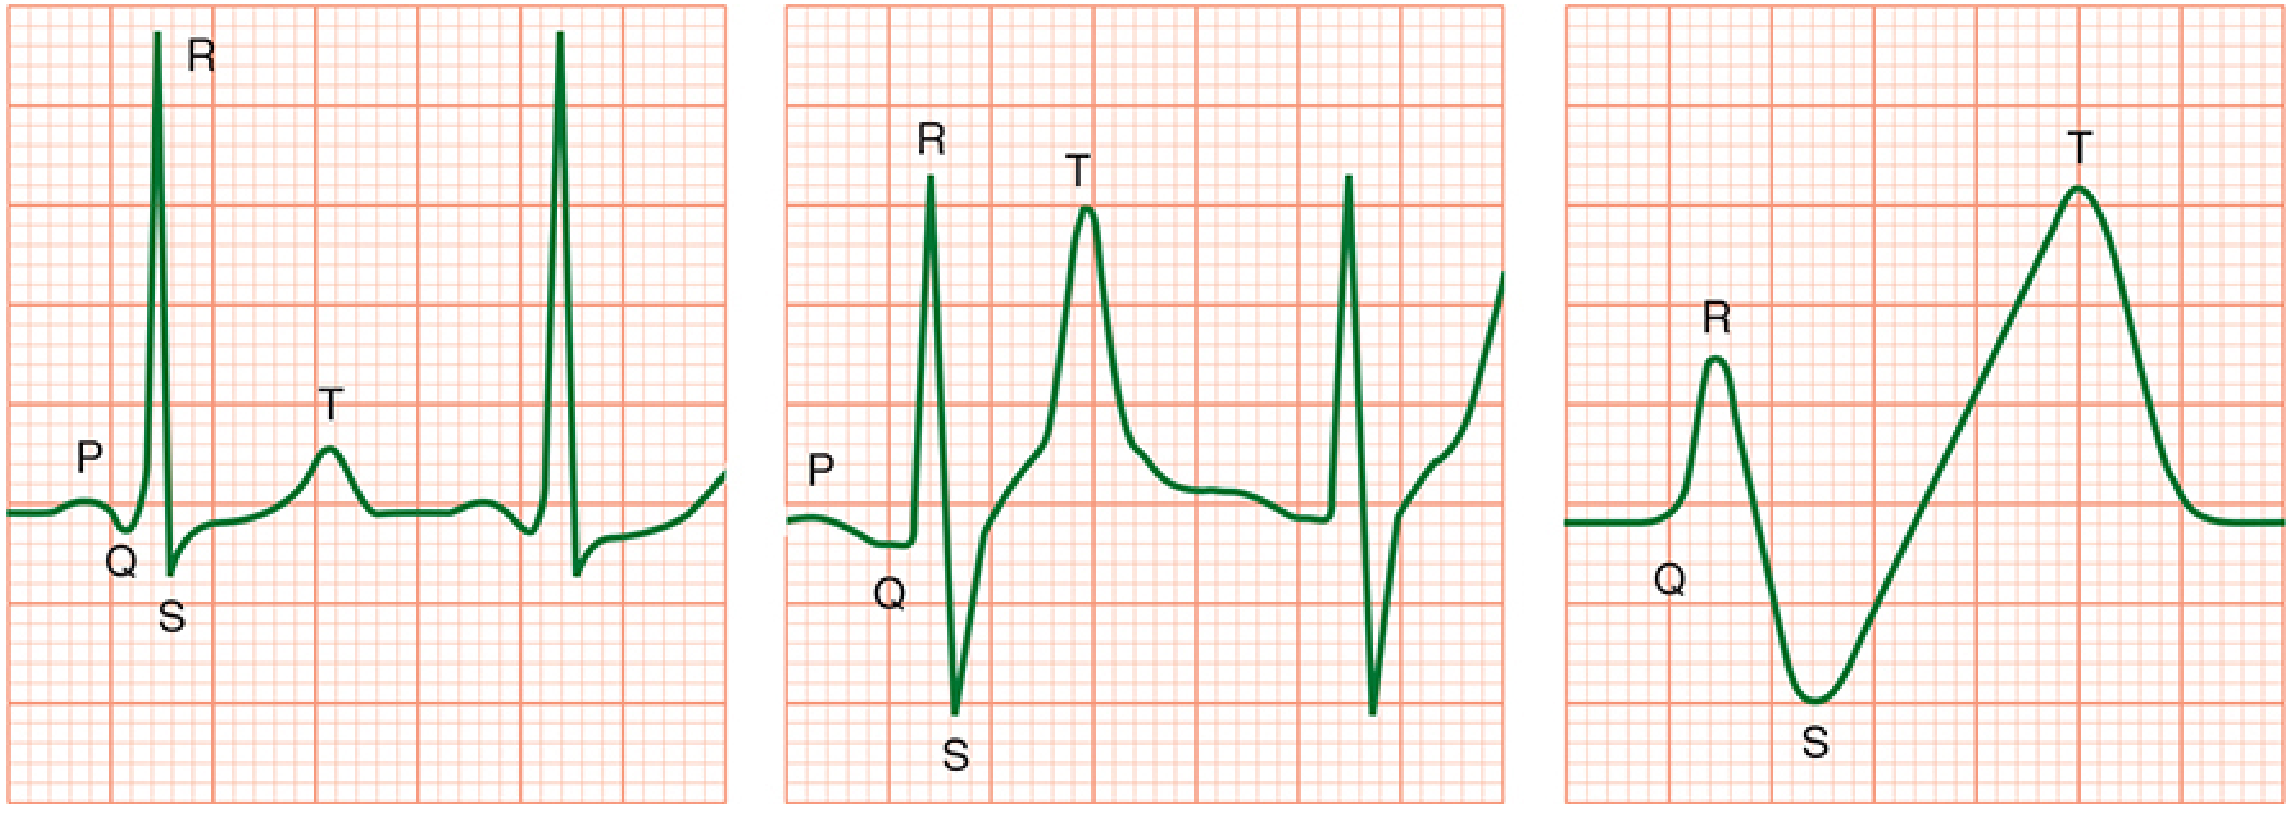
Normal ECG (left), peaked T waves with QRS widening (middle), sine wave pattern (right) - Morgan & Mikhail's Clinical Anesthesiology, 7e
3. Myocardial Infarction (MI)
The ECG in MI reflects three underlying electrophysiological events occurring in the infarcted zone, as summarized in the table below (from Ganong's Review of Medical Physiology, 26e):
| Defect in Infarcted Cells | Current Flow | Resultant ECG Change |
|---|---|---|
| Rapid repolarization | Out of infarct | ST-segment elevation |
| Decreased resting membrane potential (TQ depression) | Into infarct | TQ segment depression (recorded as ST elevation) |
| Delayed depolarization | Out of infarct | ST-segment elevation |
Temporal Evolution of ECG Changes
ECG changes in MI evolve in phases over hours to weeks:
Phase 1 - Hyperacute (minutes to hours):
- Tall, broad, hyperacute T waves - the very earliest sign (within minutes of occlusion), reflecting abnormal repolarization of ischemic cells
- ST-segment elevation in leads overlying the infarcted zone - the hallmark of STEMI (transmural/epicardial injury)
- Reciprocal ST depression in leads opposite the infarct (mirror image)
Phase 2 - Acute (hours to days):
- Evolving ST elevation (peaked or convex upward)
- T-wave inversion begins to appear
- Q waves start developing - reflect electrically silent, necrotic myocardium. A pathological Q wave is ≥40 ms wide and/or ≥25% of the R-wave amplitude in the same lead.
Phase 3 - Subacute (days to weeks):
- ST segment returns toward baseline
- Deep T-wave inversions persist
- Q waves deepen and stabilize
Phase 4 - Chronic/Old MI:
- ST and T waves normalize
- Persistent Q waves - often permanent, indicating scar
- Failure of R-wave progression in anterior leads (anterior MI)
Localization of MI by Lead Distribution
| Infarct Territory | Artery Involved | Leads Showing Changes |
|---|---|---|
| Anterior / Anteroseptal | LAD | V1-V4 |
| Lateral | LCx or Diagonal | I, aVL, V5-V6 |
| Inferior | RCA (85%) or LCx | II, III, aVF |
| Posterior | RCA or LCx | Reciprocal changes in V1-V3 (tall R, ST depression) |
| Right ventricular | Proximal RCA | V1, right-sided leads (V3R-V4R) |
"When the acute ischemia is transmural, the ST vector usually is shifted in the direction of the outer (epicardial) layers, producing ST elevations and sometimes, in the earliest stages of ischemia, tall, positive so-called hyperacute T waves over the ischemic zone." - Harrison's Principles of Internal Medicine, 22e
STEMI vs. NSTEMI
- STEMI: New ST elevation at the J-point in ≥2 contiguous leads (≥1 mm in limb leads, ≥2 mm in precordial leads V1-V3). Requires urgent reperfusion.
- NSTEMI / Unstable angina: ST depression, T-wave inversions, or no ECG changes - diagnosis rests on elevated troponins in NSTEMI.
Special Patterns
- Wellens' sign: Deep symmetric T-wave inversions in V1-V4, indicating critical LAD stenosis - a "pre-infarction" pattern requiring urgent intervention.
- De Winter T waves: Upsloping ST depression with tall positive T waves in V1-V6 (LAD occlusion equivalent, no ST elevation).
- Posterior MI: The mirror-image pattern - tall R waves and ST depression in V1-V3 (what appears as "ST elevation" on posterior leads V7-V9).
Quick Summary Comparison Table
| Feature | Hypokalemia | Hyperkalemia | Acute MI |
|---|---|---|---|
| P wave | Normal | Flat → absent | Normal (unless conduction affected) |
| PR interval | Normal | Prolonged | May be affected |
| QRS | Normal (narrow) | Widened | ST elevation; Q waves develop |
| ST segment | Depressed | Depressed | Elevated (STEMI) or depressed (NSTEMI) |
| T wave | Flat/inverted | Tall, peaked, tented | Hyperacute tall → inverted |
| U wave | Prominent | Absent | Absent |
| Arrhythmia risk | VT/VF, AF | VF, asystole | VT/VF (early), heart block |
| Fatal pattern | Torsades de pointes | Sine wave, asystole | VF |
Sources:
- National Kidney Foundation Primer on Kidney Diseases, 8e, Ch. 10
- Comprehensive Clinical Nephrology, 7e, Fig. 10.6
- Morgan & Mikhail's Clinical Anesthesiology, 7e, Ch. 49
- Miller's Anesthesia, 10e, Ch. 43
- Ganong's Review of Medical Physiology, 26e, Ch. 29
- Harrison's Principles of Internal Medicine, 22e (2025), Ch. 247
- Rosen's Emergency Medicine, Ch. 114
This is a shared conversation. Sign in to Orris to start your own chat.