
Intranucelar and intravyyoplasmic receptors
intracellular nuclear receptor mechanism steroid hormone signaling
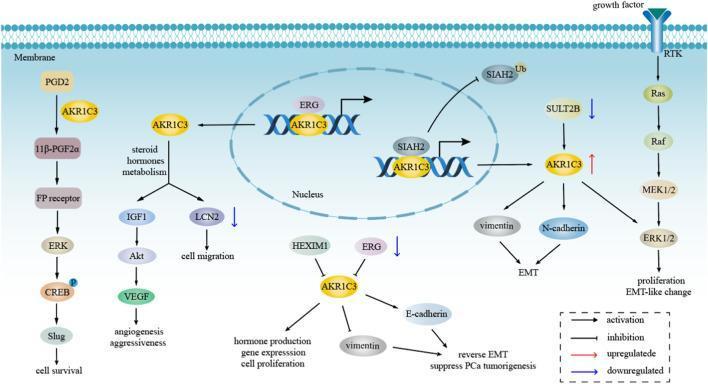
A pathophysiology diagram illustrating the intracellular signaling pathways of AKR1C3 in the context of cancer progression, specifically hormone-dependent tumors like prostate cancer. The diagram maps several concurrent pathways: 1) A growth factor-induced Receptor Tyrosine Kinase (RTK) pathway activating the Ras/Raf/MEK/ERK cascade leading to proliferation and EMT-like changes. 2) Prostaglandin metabolism where AKR1C3 converts PGD2 to 11β-PGF2α, signaling through the FP receptor/ERK/CREB/Slug axis to promote cell survival. 3) Steroid hormone metabolism where AKR1C3 influences IGF1/Akt/VEGF for angiogenesis and LCN2 for cell migration. 4) Nuclear interactions where AKR1C3 complexes with ERG and SIAH2 to modulate gene expression. 5) Cytoplasmic regulation where AKR1C3 upregulates vimentin and N-cadherin (promoting EMT) or downregulates E-cadherin to affect PCa tumorigenesis. The visual uses arrows to denote activation, T-bars for inhibition, and color-coded arrows for up/down-regulation, highlighting AKR1C3 as a central mediator of oncogenic signaling, epithelial-mesenchymal transition, and therapeutic resistance.
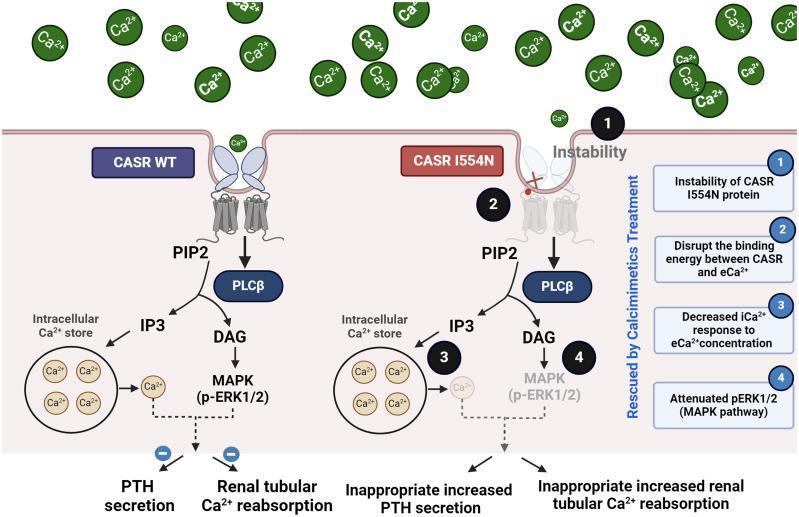
This pathophysiology diagram illustrates the molecular mechanism of the Calcium-Sensing Receptor (CASR) wild-type (WT) compared to the pathogenic I554N mutation. The left side (CASR WT) depicts normal signaling: extracellular calcium (eCa2+) binds to the intact receptor, activating the PLC̠ pathway (PIP2 to IP3 and DAG), which triggers intracellular calcium release and the MAPK (p-ERK1/2) pathway to inhibit Parathyroid Hormone (PTH) secretion and renal tubular calcium reabsorption. The right side (CASR I554N) highlights four pathological consequences: (1) protein instability, (2) disrupted binding energy between CASR and eCa2+, (3) decreased intracellular calcium (iCa2+) response, and (4) attenuated MAPK signaling. These defects lead to clinical manifestations of Familial Hypocalciuric Hypercalcemia type 1 (FHH1), specifically inappropriate increased PTH secretion and increased renal tubular calcium reabsorption. A vertical label indicates that this dysfunctional state can be 'Rescued by Calcimimetics Treatment.' The diagram serves as an educational tool for understanding G-protein coupled receptor (GPCR) dysfunction and calcium homeostasis disorders.
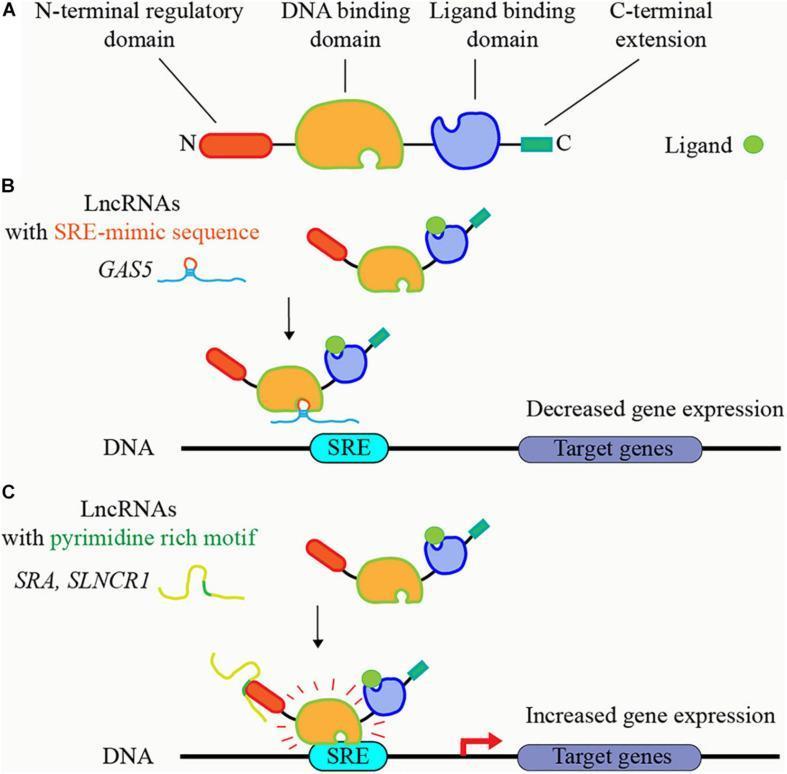
This pathophysiology diagram illustrates the regulatory mechanisms of long non-coding RNAs (lncRNAs) on steroid receptor signaling pathways. Part A depicts the domain architecture of a typical steroid receptor, showing the N-terminal regulatory domain, a central DNA-binding domain (DBD), a ligand-binding domain (LBD), and a C-terminal extension. Part B demonstrates a mechanism of transcriptional repression where lncRNAs containing steroid receptor responsive element (SRE)-mimic sequences, such as GAS5, competitively bind to the receptor's DBD. This prevents the receptor from docking at the genomic SRE site on DNA, leading to decreased target gene expression. Part C illustrates transcriptional activation where lncRNAs with pyrimidine-rich motifs, such as SRA and SLNCR1, bind to the N-terminal regulatory domain. This interaction facilitates or stabilizes the binding of the steroid receptor-ligand complex to the DNA SRE site, resulting in increased expression of downstream target genes. The diagram utilizes color-coded shapes and arrows to map molecular interactions and their resulting genomic outcomes, serving as an educational resource for molecular biology and endocrinology.
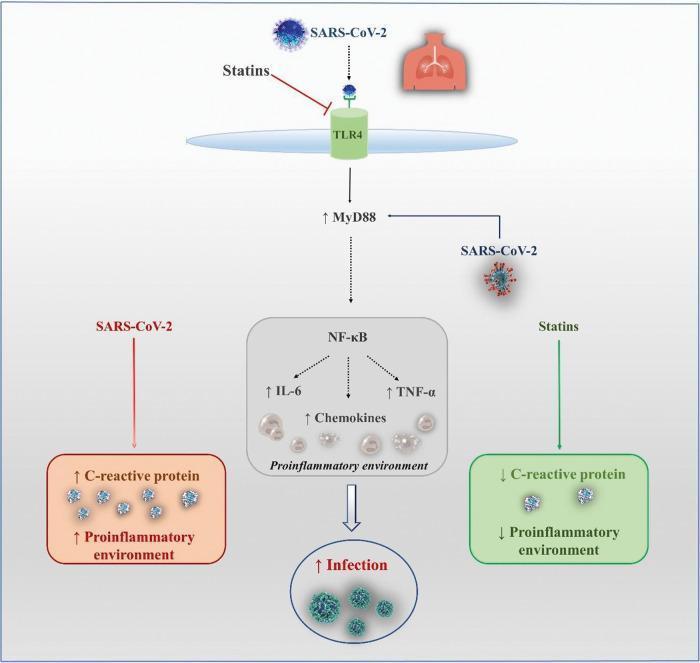
This pathophysiology diagram illustrates the signaling pathways involved in SARS-CoV-2 infection and the potential modulatory role of statins. The flowchart depicts SARS-CoV-2 interacting with the Toll-like receptor 4 (TLR4) on a cell membrane, which triggers an intracellular signaling cascade. This leads to the upregulation of MyD88, subsequently activating the nuclear factor kappa B (NF-κB) transcription factor. Activation of NF-κB results in the increased production of proinflammatory cytokines and mediators, specifically Interleukin-6 (IL-6), Tumor Necrosis Factor-alpha (TNF-α), and various chemokines, establishing a proinflammatory environment that contributes to increased infection severity. Parallel pathways show that SARS-CoV-2 leads to elevated C-reactive protein (CRP) and a systemic proinflammatory state. Conversely, the diagram highlights the protective mechanism of statins, which are shown to inhibit the TLR4 pathway and decrease levels of C-reactive protein, thereby mitigating the proinflammatory environment. The visual represents key concepts in immunology and pharmacology within the context of COVID-19 management.
steroid hormone nuclear receptor DNA transcription activation mechanism cytoplasm
This pathophysiology diagram illustrates the regulatory mechanisms of long non-coding RNAs (lncRNAs) on steroid receptor signaling pathways. Part A depicts the domain architecture of a typical steroid receptor, showing the N-terminal regulatory domain, a central DNA-binding domain (DBD), a ligand-binding domain (LBD), and a C-terminal extension. Part B demonstrates a mechanism of transcriptional repression where lncRNAs containing steroid receptor responsive element (SRE)-mimic sequences, such as GAS5, competitively bind to the receptor's DBD. This prevents the receptor from docking at the genomic SRE site on DNA, leading to decreased target gene expression. Part C illustrates transcriptional activation where lncRNAs with pyrimidine-rich motifs, such as SRA and SLNCR1, bind to the N-terminal regulatory domain. This interaction facilitates or stabilizes the binding of the steroid receptor-ligand complex to the DNA SRE site, resulting in increased expression of downstream target genes. The diagram utilizes color-coded shapes and arrows to map molecular interactions and their resulting genomic outcomes, serving as an educational resource for molecular biology and endocrinology.
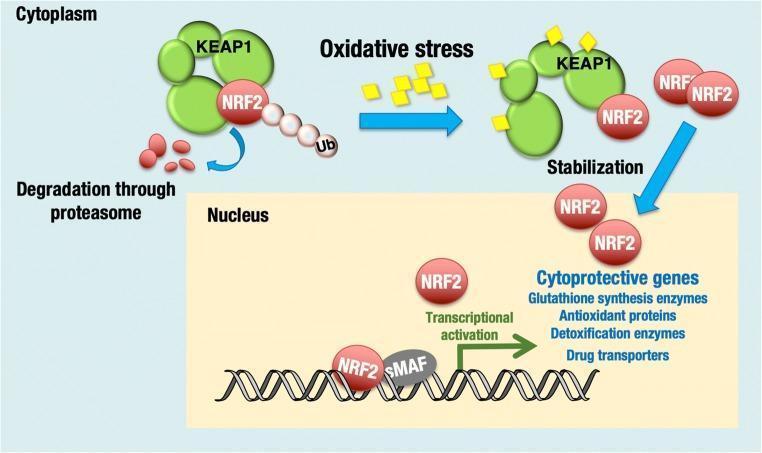
A pathophysiology diagram illustrating the KEAP1-NRF2 signaling pathway in response to oxidative stress. The diagram is divided into cytoplasmic and nuclear compartments. In the 'Unstressed condition' (cytoplasm), the transcription factor NRF2 is shown sequestered by the inhibitor protein KEAP1. This interaction leads to the ubiquitination (Ub) of NRF2, targeting it for degradation through the proteasome. Under 'Oxidative stress' conditions, reactive species interact with KEAP1, causing its modification and the subsequent stabilization of NRF2. This results in the translocation of NRF2 from the cytoplasm into the nucleus. Within the nucleus, NRF2 heterodimerizes with small Maf (sMAF) proteins and binds to DNA, initiating 'Transcriptional activation' of various cytoprotective genes. The diagram lists these targets as including glutathione synthesis enzymes, antioxidant proteins, detoxification enzymes, and drug transporters. This educational schematic demonstrates the cellular mechanism for maintaining redox homeostasis and the protective response against electrophilic and oxidative damage.
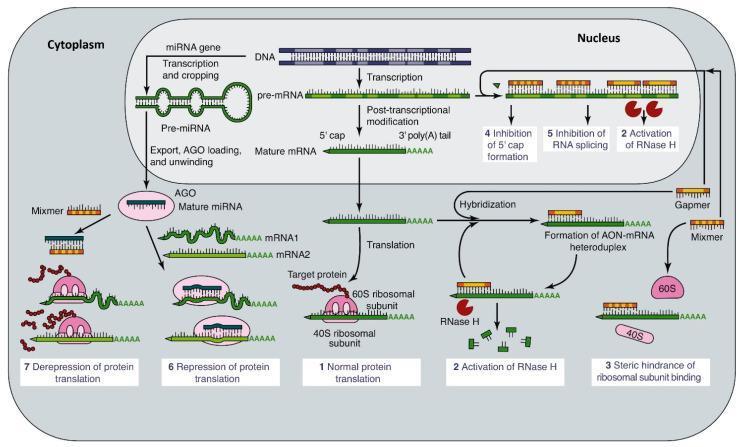
This pathophysiology diagram illustrates the mechanisms of gene expression modulation by antisense oligonucleotides (ASOs), microRNAs (miRNAs), and small interfering RNAs (siRNAs) within the nucleus and cytoplasm. In the nucleus, the diagram shows DNA transcription into pre-mRNA, which then undergoes post-transcriptional modifications including 5' capping and 3' polyadenylation to form mature mRNA. Interventions shown include ASO-mediated inhibition of 5' cap formation, inhibition of RNA splicing, and nuclear RNase H activation. In the cytoplasm, the diagram depicts normal translation via 40S and 60S ribosomal subunits. Modulatory pathways shown include: (1) miRNA processing involving export, Argonaute (AGO) loading, and unwinding to repress translation; (2) AON-mRNA heteroduplex formation leading to cytoplasmic RNase H-mediated mRNA degradation; (3) steric hindrance of ribosomal binding by Mixmers; and (4) derepression of protein translation. The visual highlights pharmacological targets for gene silencing and protein modulation, relevant to molecular biology and genetic therapeutics.
Intranuclear and Intracytoplasmic Receptors
Overview
The Mechanism (Step by Step)
-
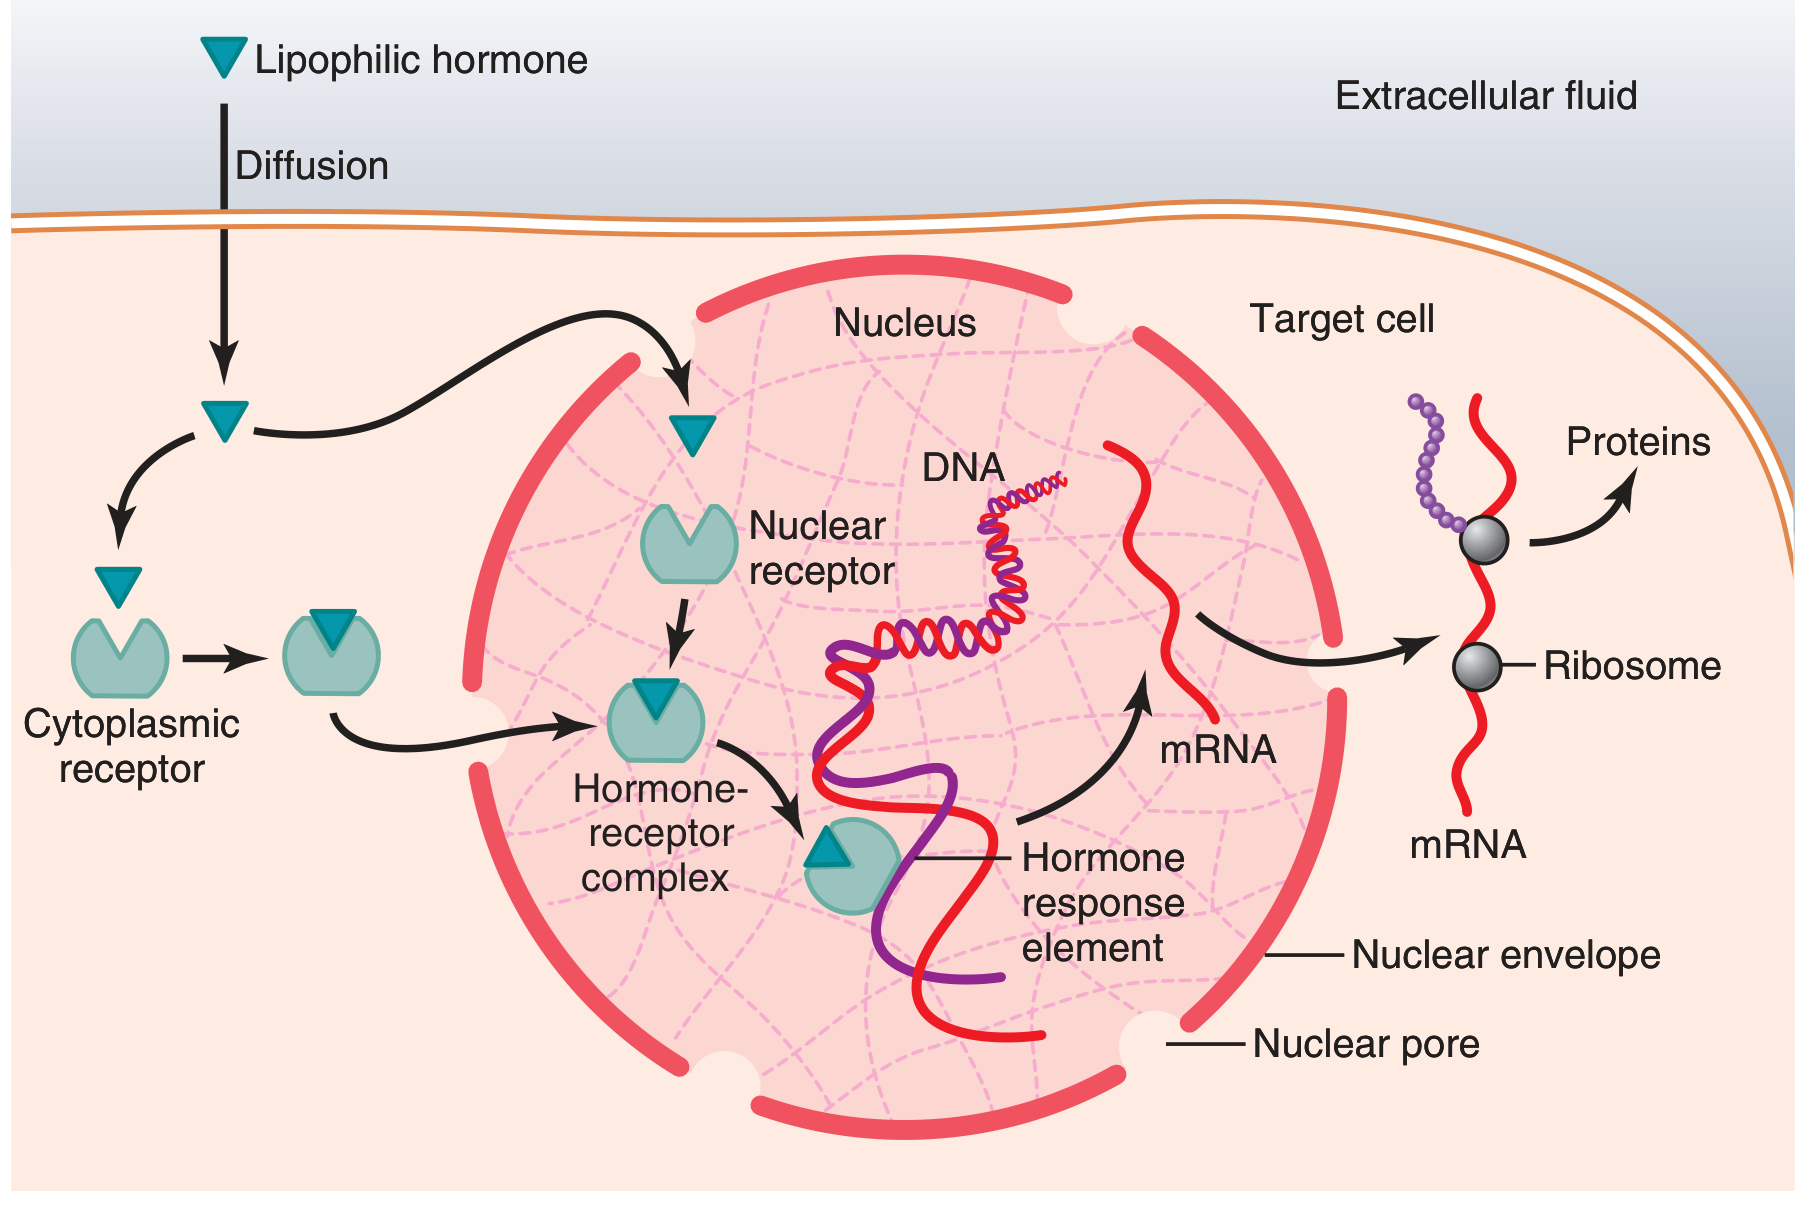
Entry into cell - Steroid hormones, vitamin D, and retinoic acid are lipophilic and diffuse freely through the lipid bilayer. Thyroid hormones (charged amino acid derivatives) may enter by diffusion or carrier-mediated transport.
-
Binding the receptor - The ligand binds to an intracellular receptor, which is a protein with distinct domains:
- N-terminal regulatory domain - variable, involved in transactivation
- DNA-binding domain (DBD) - contains zinc fingers; recognizes specific DNA sequences
- Ligand-binding domain (LBD) - binds the hormone; also involved in dimerization
-
Receptor activation - Binding displaces heat-shock proteins (chaperones) that keep the receptor in an inactive state.
-
Nuclear translocation (if cytoplasmic) - The activated complex moves through nuclear pores into the nucleus.
-
Dimerization - The receptor dimerizes (see below) and binds to the HRE on DNA.
-
Gene regulation - Transcription is either activated or repressed, leading to synthesis of new mRNA and ultimately new proteins within minutes to days. This is the classic genomic effect.
Intracytoplasmic vs. Intranuclear Location
| Feature | Intracytoplasmic Receptor | Intranuclear Receptor |
|---|---|---|
| Resting location | Cytoplasm (bound to HSP90 chaperones) | Nucleus (pre-bound to DNA) |
| Examples | Glucocorticoid receptor (GR), Androgen receptor (AR), Mineralocorticoid receptor (MR), Progesterone receptor (PR) | Thyroid hormone receptor (TR), Retinoic acid receptor (RAR), Vitamin D receptor (VDR), Estrogen receptor (ER - partially) |
| After ligand binding | Releases from HSP90, translocates to nucleus | Undergoes conformational change in situ |
| Mechanism of action | Genomic (via HRE binding) | Genomic (via HRE binding) |
The Nuclear Receptor Superfamily
1. Steroid Hormone Receptors (Homodimers)
| Receptor | Full Name | Ligand |
|---|---|---|
| GR | Glucocorticoid receptor | Cortisol |
| MR | Mineralocorticoid receptor | Aldosterone |
| PR | Progesterone receptor | Progesterone |
| ER (ERα, ERβ) | Estrogen receptor | Estradiol |
| AR | Androgen receptor | Testosterone, DHT |
2. Non-Steroid Receptors (Heterodimers with RXR)
| Receptor | Full Name | Ligand |
|---|---|---|
| TR | Thyroid hormone receptor | T3 (triiodothyronine) |
| VDR | Vitamin D receptor | 1,25-(OH)2 vitamin D3 |
| RAR | Retinoic acid receptor | Retinoic acid (vitamin A) |
| PPARα/γ/δ | Peroxisome proliferator-activated receptors | Fatty acids, fibrates (PPARα), thiazolidinediones (PPARγ) |
| FXR | Bile acid receptor | Bile acids |
| LXR | Liver X receptor | Oxysterols |
| SXR/PXR | Steroid and xenobiotic receptor | Xenobiotics |
Key Features
Examples Linking Receptor Type to Clinical Pharmacology
- Glucocorticoids (e.g., prednisolone) - bind cytoplasmic GR → nucleus → suppress NF-κB → anti-inflammatory gene expression
- Thyroid hormones (T3) - bind intranuclear TR/RXR heterodimer → regulate metabolic gene transcription
- Vitamin D - binds VDR/RXR → regulates calcium transport proteins (calbindin) in intestine
- Retinoic acid (Vitamin A derivatives) - bind RAR/RXR → crucial for differentiation; used in acute promyelocytic leukemia (ATRA therapy)
- Thiazolidinediones (e.g., pioglitazone) - bind PPARγ → improve insulin sensitivity via gene transcription in adipose tissue
- Guyton and Hall Textbook of Medical Physiology - "Intracellular Hormone Receptors and Activation of Genes," p. 911-912
- Medical Physiology (Boron & Boulpaep) - "Steroid and thyroid hormones enter the cell and bind to members of the nuclear receptor superfamily," Table 3-6, p. 82-83