
Gaspin
What did you mean by 'Gaspin'?
gasping respiration causes clinical
gasping breathing causes pathophysiology clinical significance
gasping agonal breathing respiratory pattern abnormal
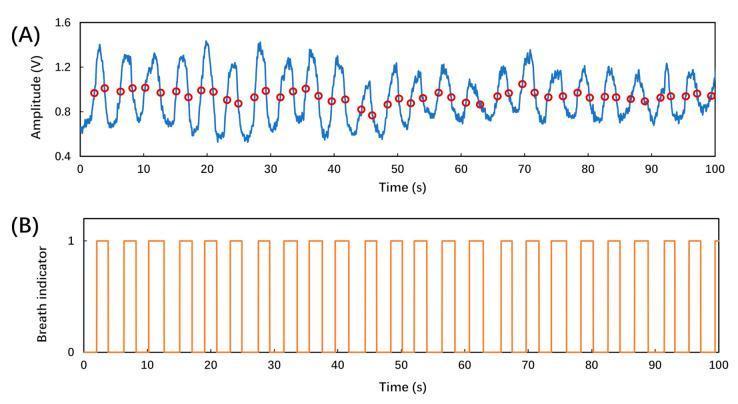
This physiological data visualization displays respiratory monitoring results from a fiber-tip microcantilever breath sensor. Figure (A) illustrates a 100-second raw amplitude signal (blue waveform) representing time-dependent reflected light intensity. The signal exhibits periodic oscillations between approximately 0.6V and 1.4V, corresponding to real-time breathing cycles. Superimposed red circles indicate dynamic thresholds calculated from adjacent peak-valley pairs to account for baseline drift and turbulent airflow variations. Figure (B) displays a processed square-wave breath indicator derived from the dynamic thresholds in panel A. This binary signal alternates between state '0' (inhalation) and state '1' (exhalation), demonstrating a rhythmic, regular breathing pattern. The data illustrates the clinical application of micro-interferometer technology in respiratory rate (RR) monitoring and breath cycle phase identification, which is critical for assessing respiratory health and identifying abnormal ventilation patterns.
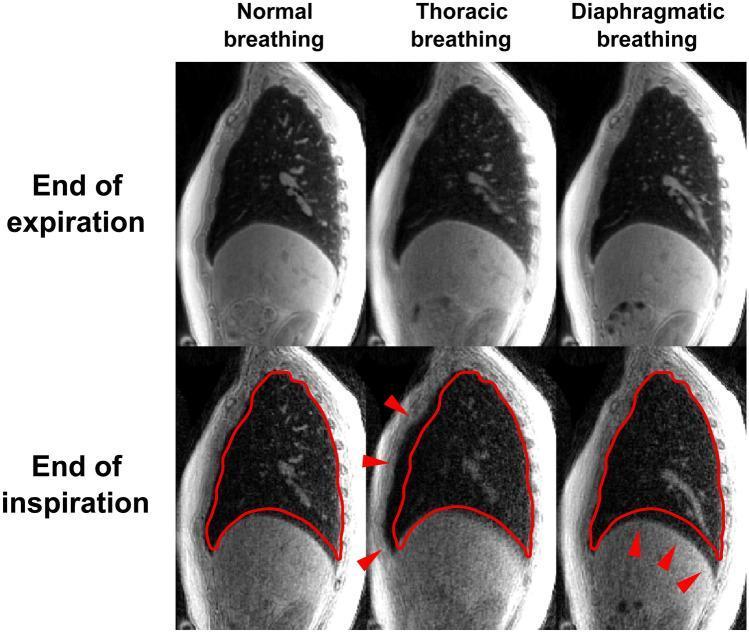
This diagnostic image provides a comparison of human respiratory dynamics using sagittal-view gated CT imaging across three breathing patterns: normal, thoracic, and diaphragmatic. The panel is organized into two rows representing physiological states: 'End of expiration' (top) and 'End of inspiration' (bottom). Each column highlights a specific respiratory technique. In the bottom row (inspiration), a red outline superimposes the lung border from the previous expiratory phase to visually demonstrate lung volume expansion. Red arrows indicate primary mechanical drivers for each pattern: the thoracic breathing column displays anterior movement of the chest wall, while the diaphragmatic breathing column emphasizes significant inferior displacement of the diaphragm and expansion of the lower thoracic cavity. This comparison illustrates the mechanical differences between costal and abdominal breathing, demonstrating how different muscle groups contribute to changes in pleural pressure and lung volume. The imagery serves as an educational tool for pulmonology and physiology, focusing on respiratory mechanics and accessory muscle recruitment.
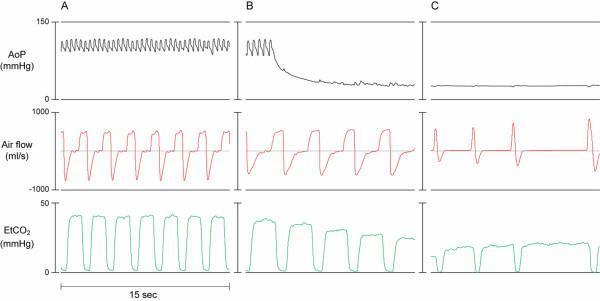
Comparison chart showing physiologic waveforms across three cardiovascular states: (A) Normal sinus rhythm with spontaneous breathing, (B) Acute ventricular fibrillation (VF) with initial spontaneous breathing, and (C) Untreated VF with agonal gasping. The chart tracks three parameters over 15-second intervals: Aortic Pressure (AoP in mmHg), Air Flow (ml/s), and End-tidal CO2 (EtCO2 in mmHg). In state A, AoP shows regular rhythmic oscillations, and air flow exhibits a plateau in the inspiratory phase. In state B, AoP demonstrates a rapid decay in pulse pressure and mean arterial pressure following VF induction; air flow remains relatively regular but with slightly reduced amplitude and EtCO2 begins to decline. In state C, AoP is nearly flat, indicating a lack of cardiac output; the air flow signal transforms into sharp, infrequent 'gasping' peaks characterized by a lack of an inspiratory plateau and a rapid rise and fall, while the EtCO2 signal becomes irregular and significantly lower in amplitude. This infographic illustrates the hemodynamic and ventilatory changes during the progression of cardiac arrest.
Gasping / Agonal Respiration
What Is It?
Contexts Where Gasping Occurs
1. Cardiac Arrest (most common)
- Coronary artery disease / acute MI
- Ventricular fibrillation or pulseless VT
- Asystole / pulseless electrical activity
- Hypertrophic cardiomyopathy (especially in young athletes)
- Non-cardiac causes: massive PE, aortic rupture, subarachnoid hemorrhage - Goldman-Cecil Medicine, p.2095
2. Obstructive Sleep Apnea (OSA)
3. Severe Respiratory Distress (non-cardiac)
Pathophysiology
| Feature | Detail |
|---|---|
| Generator | Medulla oblongata (brainstem) |
| Trigger | Hypoxia / anoxia / cerebral ischemia |
| Nature | Involuntary brainstem reflex, NOT effective breathing |
| Duration | Seconds to minutes after cardiac arrest; longer in OSA arousals |
| Significance | Confirms brainstem activity is present; does NOT mean the patient is breathing adequately |
Key Clinical Points
- Do not mistake agonal gasping for normal breathing - if a person is unresponsive and gasping, treat it as cardiac arrest and begin CPR immediately.
- Gasping does not mean the patient is breathing adequately - it is a sign of cardiovascular/respiratory collapse.
- In OSA, gasping is episodic and associated with arousal from sleep - it is not life-threatening in the same acute sense, but does impair sleep quality and carries long-term cardiovascular risk.
- After cardiac arrest, gasping may persist for a few minutes after the heart stops due to brief residual brainstem perfusion.
Immediate Response
- Call emergency services (911 / local emergency number)
- Begin CPR immediately - do not wait
- Use an AED if available
- Do not assume they are breathing adequately just because they are making sounds
Hocm
hypertrophic cardiomyopathy management
hypertrophic obstructive cardiomyopathy HOCM echocardiogram septal hypertrophy LVOT obstruction
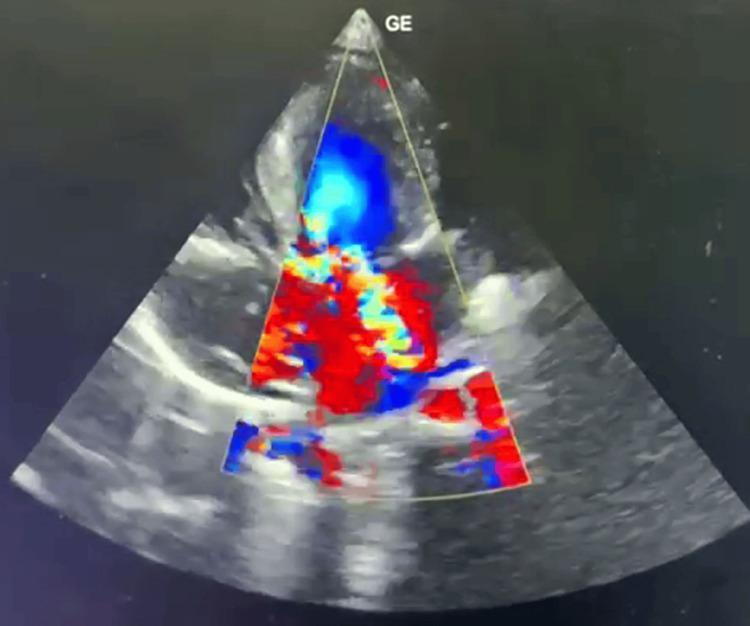
This diagnostic image is a 2D color Doppler echocardiogram illustrating Hypertrophic Obstructive Cardiomyopathy (HOCM). The ultrasound shows significant asymmetrical septal hypertrophy, which leads to the narrowing of the Left Ventricular Outflow Tract (LVOT). The color Doppler overlay reveals complex, turbulent blood flow patterns: a prominent blue jet at the top indicating flow away from the transducer, and mosaic red-yellow regions in the mid-section suggestive of high-velocity flow and significant pressure gradients (96 mmHg). These findings are consistent with dynamic outflow obstruction and associated moderate-to-severe mitral regurgitation (MR). Additional visualized features include valvular and supravalvular pulmonary stenosis and a prominent eustachian valve. This clinical image is a primary educational resource for identifying the anatomical and hemodynamic markers of pediatric HOCM, specifically demonstrating the relationship between septal thickening and turbulent outflow.
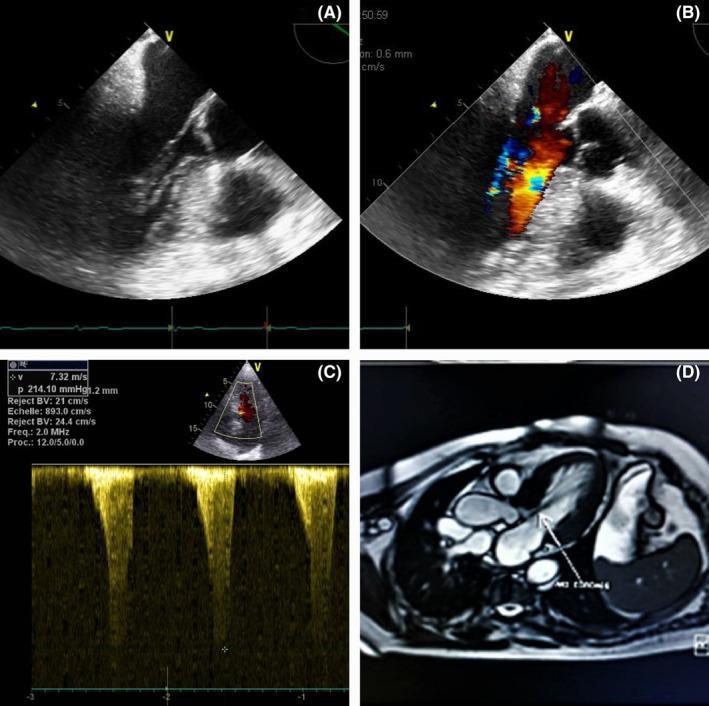
This composite figure illustrates a case of Hypertrophic Obstructive Cardiomyopathy (HOCM) using multimodal imaging. Panel A shows a 2D transthoracic echocardiogram in the apical view, highlighting asymmetric septal hypertrophy (20mm thickness) and significant narrowing of the left ventricular outflow tract (LVOT). Two anomalous subvalvular chordae are visible attached to the interventricular septum and mitro-aortic trigone. Panel B is a Color Doppler image demonstrating turbulent, high-velocity flow acceleration (aliasing/mosaic pattern) across the LVOT and concomitant moderate mitral regurgitation. Panel C displays a Continuous-Wave (CW) Doppler tracing showing a peak velocity of 7.32 m/s and a peak pressure gradient of approximately 210 mmHg, characterized by a classic late-peaking 'dagger-shaped' waveform pathognomonic for dynamic LVOT obstruction. Panel D provides a cardiac MRI (CMR) correlation, confirming the abnormal insertion of chordae tendineae and the dominance of basal septal hypertrophy in causing the obstruction. This collection is used to teach the diagnostic features of dynamic outflow tract obstruction and the role of adjunctive imaging in characterizing subvalvular anatomy.
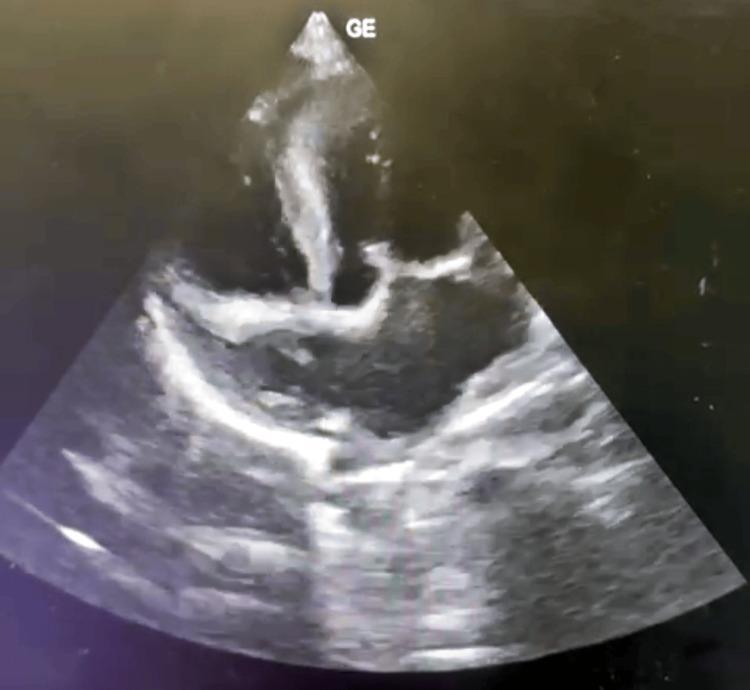
This diagnostic image is a 2D transthoracic echocardiogram in a parasternal long-axis (PLAX) orientation, illustrating hallmark features of Hypertrophic Obstructive Cardiomyopathy (HOCM). The ultrasound shows significant asymmetrical septal hypertrophy, where the interventricular septum (IVS) is markedly thickened compared to the posterior wall of the left ventricle. This septal bulging narrows the left ventricular outflow tract (LVOT), creating a substrate for dynamic obstruction. The image also captures the relationship between the hypertrophied septum and the anterior leaflet of the mitral valve, which often exhibits systolic anterior motion (SAM) in such clinical presentations. The increased echogenicity of the myocardial tissue in the septal region suggests densification or fibrosis consistent with cardiomyocyte disarray. This imaging modality is essential for evaluating cardiac structural abnormalities, assessing blood flow velocities, and measuring peak gradients across the LVOT to determine the severity of obstructive cardiac conditions in pediatric or adult cardiology.
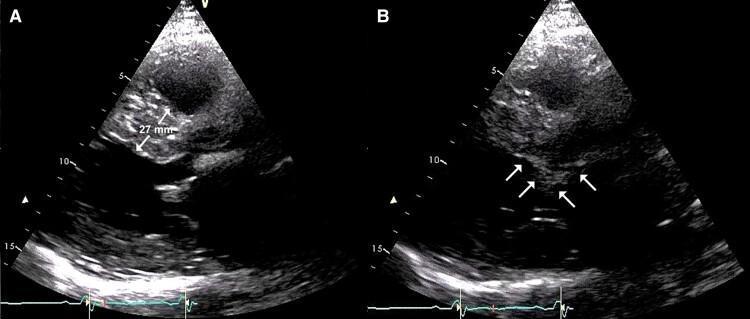
This diagnostic image displays a dual-panel transthoracic echocardiogram (TTE) in a parasternal long-axis view, illustrating key pathological hallmarks of Hypertrophic Obstructive Cardiomyopathy (HOCM). Panel A demonstrates significant asymmetric septal hypertrophy, with the interventricular septum (IVS) measured at 27 mm. The hypertrophied myocardium exhibits a dense, speckled echogenicity pattern. Panel B identifies the hemodynamic consequence of this structural change: systolic anterior motion (SAM) of the anterior mitral valve leaflet. White arrows highlight the abnormal anterior displacement of the mitral leaflet toward the hypertrophied septum during systole, a mechanism that contributes to left ventricular outflow tract (LVOT) obstruction. These findings are critical for diagnosing obstructive phenotypes of hypertrophic cardiomyopathy and assessing the risk of dynamic outflow obstruction.
HOCM 2024 AHA ACC guideline treatment mavacamten septal reduction
HOCM - Hypertrophic Obstructive Cardiomyopathy
Definition
Genetics & Pathogenesis
- Autosomal dominant inheritance with variable penetrance
- Mutations in sarcomeric contractile protein genes account for ~50-60% of cases; >1400 mutations identified
- Key genes: MYH7 (β-myosin heavy chain), MYBPC3 (myosin-binding protein C), TNNT2 (troponin T) - these three account for 70-80% of all HCM cases
- Mutations are gain-of-function → myocyte hypercontractility → increased energy use → net negative energy balance - Robbins & Kumar Basic Pathology, p.1125
- The same genes mutated in DCM cause loss-of-function, while in HCM they cause gain-of-function - an important distinction
Morphology / Pathology
- Massive myocardial hypertrophy without ventricular dilation
- 90% asymmetric septal hypertrophy (IVS >> LV free wall); 10% concentric
- LV cavity compressed into a "banana-shaped" configuration
- Anterior mitral leaflet contacts the hypertrophied septum during systole → fibrous endocardial plaque in LVOT
- Left atrium is enlarged
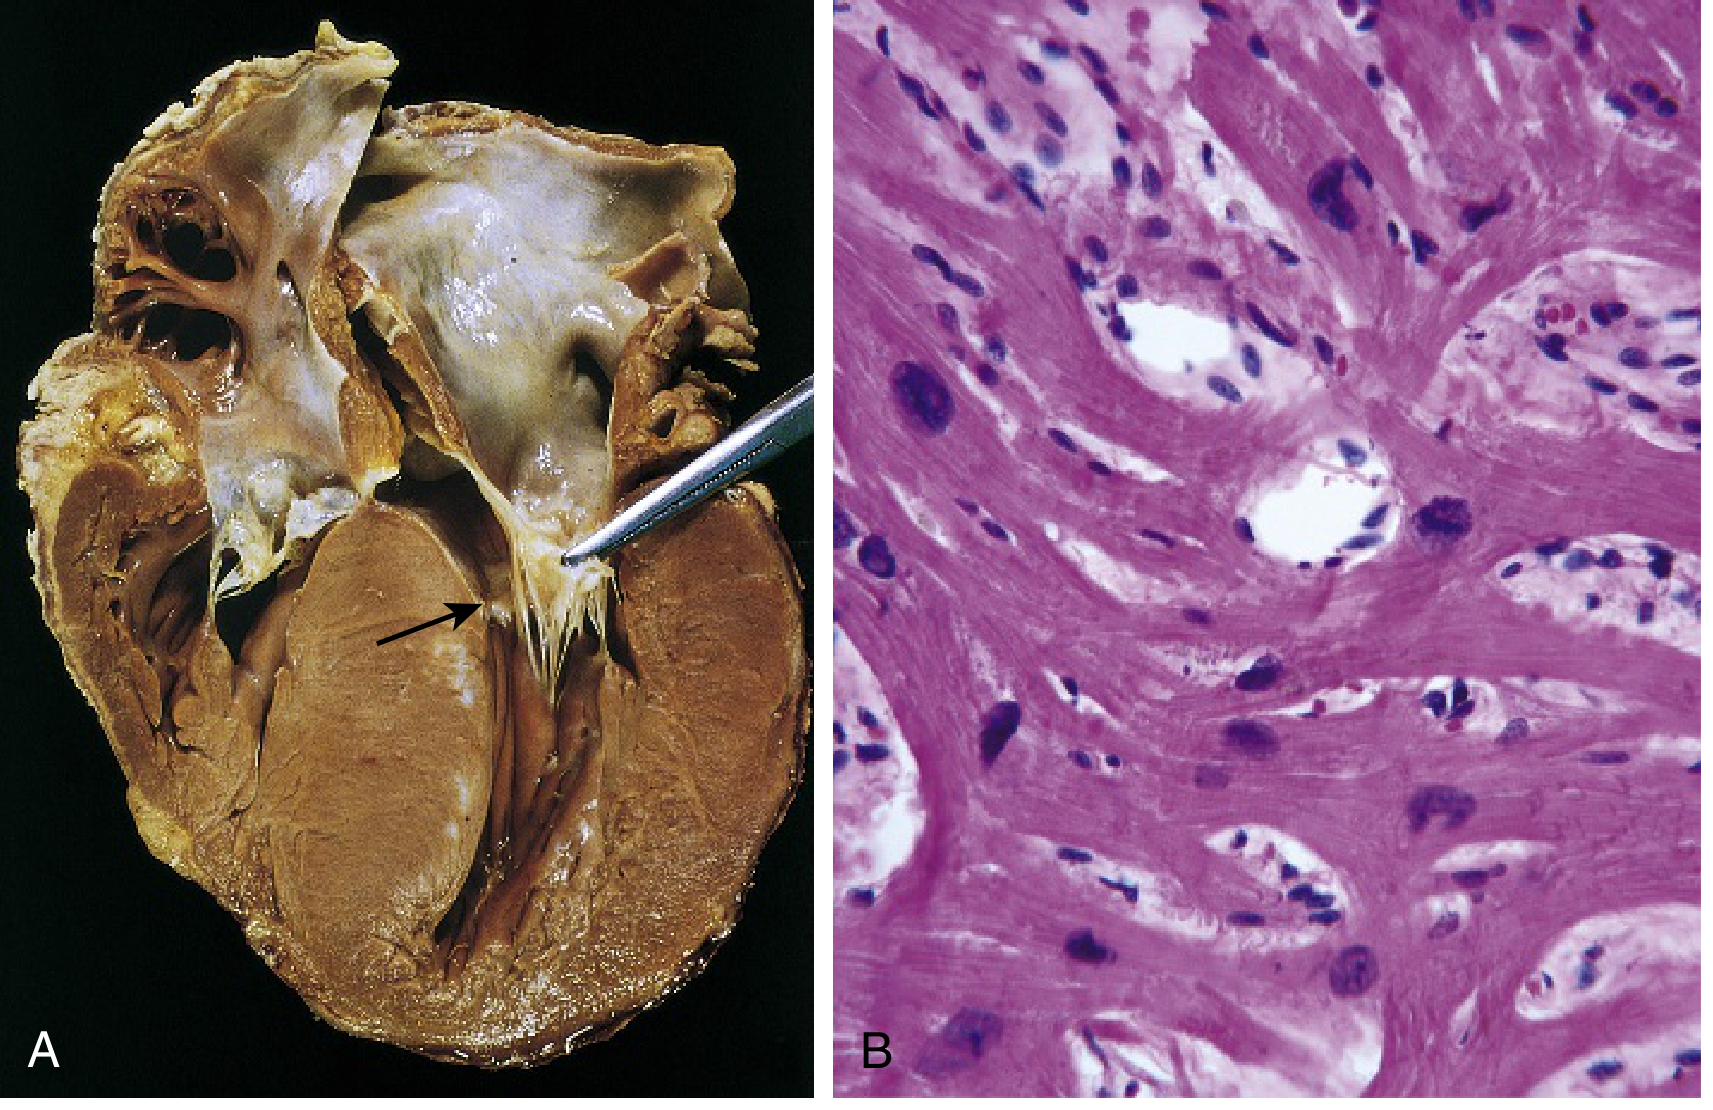
- Myocyte hypertrophy (extreme)
- Myocyte/myofiber disarray (haphazard arrangement)
- Interstitial fibrosis
- Robbins & Kumar Basic Pathology, p.1143
Mechanism of LVOT Obstruction
- Asymmetric septal hypertrophy narrows the LVOT anatomically
- Systolic Anterior Motion (SAM) of the mitral valve - the anterior mitral leaflet is dragged toward the hypertrophied septum during ejection by the Venturi effect, further obstructing the LVOT and causing mitral regurgitation
Clinical Features
- Diastolic dysfunction (impaired relaxation → reduced filling)
- LVOT obstruction (reduced cardiac output)
- Secondary pulmonary venous hypertension
| Feature | Detail |
|---|---|
| Exertional dyspnea | Most common symptom |
| Angina | Myocardial ischemia despite normal coronaries (massive hypertrophy + impaired intramural flow) |
| Syncope / presyncope | From LVOT obstruction or arrhythmia |
| Harsh systolic ejection murmur | Increases with Valsalva/standing (↓preload worsens obstruction); decreases with squatting (↑preload) |
| Atrial fibrillation | Risk of mural thrombus and stroke |
| Sudden cardiac death | Ventricular fibrillation - leading cause in athletes <35 years |
| CHF | Late complication |
- Robbins & Kumar Basic Pathology, p.1145; Goldman-Cecil Medicine, p.4197
Echocardiographic Diagnosis
- Asymmetric septal hypertrophy (IVS ≥15 mm, or ratio IVS:posterior wall >1.3)
- Systolic Anterior Motion (SAM) of mitral valve
- Dynamic LVOT obstruction (peak gradient ≥30 mmHg at rest, ≥50 mmHg provoked = hemodynamically significant)
- Diastolic dysfunction
- Mitral regurgitation (secondary to SAM)
- Textbook of Clinical Echocardiography, p.3380-3388
Management (2024 AHA/ACC Guideline)
Stepwise Pharmacological Approach for Obstructive HCM
- Beta-blockers OR non-dihydropyridine CCBs (verapamil, diltiazem)
- Add oral diuretic if congestion present (Class 2a)
- Add mavacamten (cardiac myosin ATPase inhibitor) - Class 2a
- OR add disopyramide
- OR refer for septal reduction therapy (Class 1, at experienced centers)
- Vasodilators (nitrates, dihydropyridine CCBs)
- Digoxin
- High-dose diuretics (reduce preload → worsen obstruction)
Septal Reduction Therapy (SRT)
| Procedure | Description | Preferred When |
|---|---|---|
| Surgical myectomy | Transaortic resection of basal septum | Anomalous papillary muscle, elongated mitral leaflet, intrinsic MV disease, multivessel CAD, valvular AS |
| Alcohol septal ablation | Ethanol injected into septal perforator → controlled infarction of proximal septum | Older patients, high surgical risk |
ICD / SCD Prevention
- ICD implantation considered for patients with high SCD risk (prior cardiac arrest, sustained VT, massive hypertrophy ≥30mm, family history of SCD, unexplained syncope, NSVT on Holter, abnormal BP response to exercise)
- Quantitative late gadolinium enhancement on cardiac MRI is a powerful predictor of SCD risk - meta-analysis 2024 (PMID: 37632503)
Atrial Fibrillation in HCM
- Preferred rate/rhythm control: disopyramide + beta-blocker, verapamil, diltiazem, or amiodarone
- All patients with HCM and AF should receive anticoagulation (high thromboembolic risk)
Key Differentials
| Condition | Distinguishing Features |
|---|---|
| Hypertensive LVH | Concentric, symmetric; responds to BP treatment |
| Aortic stenosis | Fixed LVOT obstruction; murmur decreases with Valsalva |
| Athletic heart | Regression with detraining; no SAM; normal diastolic function |
| Cardiac amyloid | Restrictive pattern; sparkling echo texture; low-voltage ECG |
Fibroid
uterine fibroid leiomyoma types submucosal intramural subserosal diagram
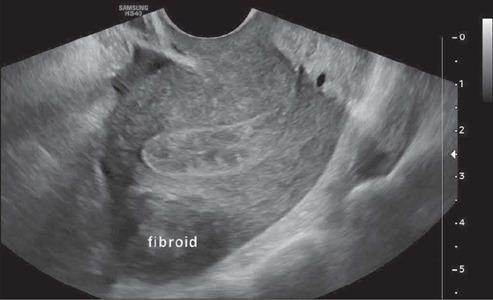
A gray-scale transvaginal ultrasound image in a longitudinal view demonstrating a uterine fibroid (leiomyoma) located in the posterior wall of the uterine fundus. The lesion is characterized as a solid, well-defined, and predominantly hypoechoic mass relative to the adjacent myometrium. Its internal echotexture is heterogeneous with visible areas of varying gray-scale intensity. According to the FIGO classification system, this is a FIGO Type 6 fibroid, defined as a subserosal lesion with an intramural component involving less than 50% of its volume. The image clearly shows the majority of the fibroid protruding from the uterine serosa into the pelvic space, while a smaller portion remains embedded within the muscular uterine wall. This diagnostic image is essential for gynecological assessment and surgical planning, helping to differentiate between intramural, submucosal, and subserosal pathologies.
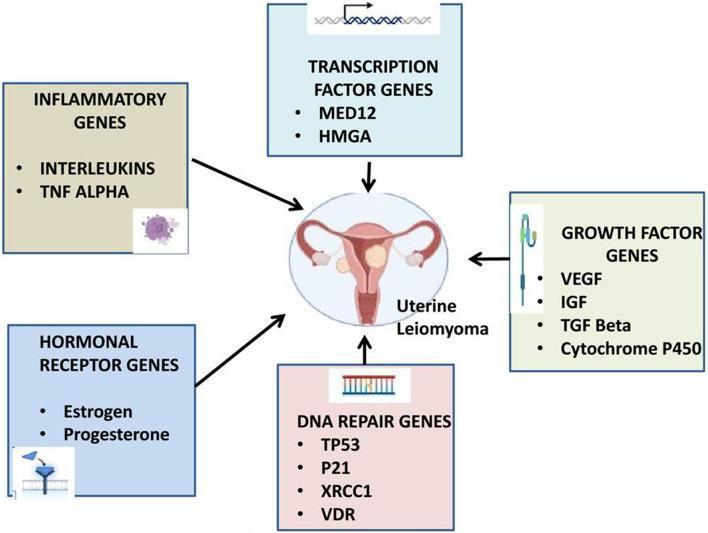
A pathophysiology diagram illustrating the genetic and epigenetic factors involved in the pathogenesis of uterine leiomyoma (fibroids). The central visual element is an anatomical illustration of a uterus with multiple intramural and subserosal leiomyomas, labeled 'Uterine Leiomyoma.' Surrounding this central figure are five color-coded categorical boxes with arrows pointing toward the uterus, indicating their contributory roles. The categories and specific genes/factors listed include: 1) Inflammatory Genes (Interleukins, TNF Alpha); 2) Transcription Factor Genes (MED12, HMGA); 3) Growth Factor Genes (VEGF, IGF, TGF Beta, Cytochrome P450); 4) DNA Repair Genes (TP53, P21, XRCC1, VDR); and 5) Hormonal Receptor Genes (Estrogen, Progesterone). Each category box is accompanied by a small icon representing biological structures like DNA strands or receptors. This educational diagram is intended for oncology and gynecology curricula to summarize the polygenic nature of fibroid development and susceptibility.
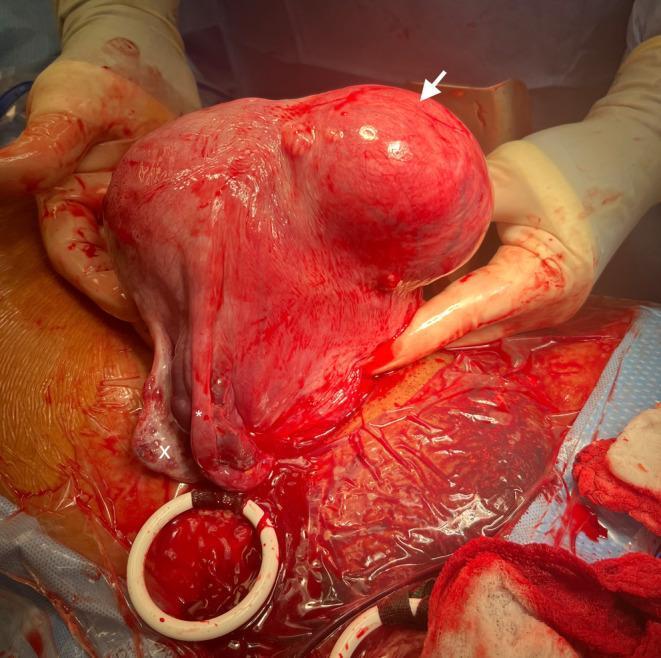
This clinical photograph captures an intraoperative view of an exteriorized uterus during a cesarean section. The primary finding is a large, well-circumscribed, subserosal uterine leiomyoma (fibroid), approximately 9 cm in size, located on the left anterior lateral uterine wall (indicated by a white arrow). The fibroid presents as a smooth, reddish-pink bulbous mass protruding from the uterine serosa. To the lower left of the primary uterine body (anatomical right), a normal right fallopian tube (marked with an asterisk) and right ovary (marked with an 'x') are clearly visualized. The uterine tissue appears hyperemic, typical of the gravid state. The surgical field includes sterile drapes, gloved hands of the surgeon, and a surgical retractor. This image serves as a significant clinical example of a large subserosal fibroid encountered during obstetric surgery and illustrates the anatomical relationships between the gravid uterus, adnexa, and intramural pathology.
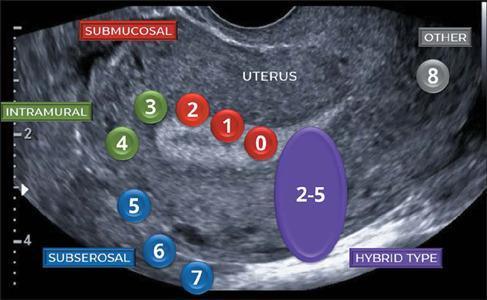
This diagnostic ultrasound image demonstrates the FIGO (International Federation of Gynecology and Obstetrics) classification system for uterine fibroids (leiomyomas). The image shows a grayscale sagittal view of a uterus with heterogeneous, hypoechoic texture. Numbered circular overlays are used to map fibroid locations relative to the uterine wall layers. Red markers 0, 1, and 2 identify 'Submucosal' fibroids (ranging from pedunculated intracavitary to ≥ 50% intramural). Green markers 3 and 4 identify 'Intramural' fibroids. Blue markers 5, 6, and 7 represent 'Subserosal' positions (ranging from ≥ 50% intramural to pedunculated subserosal). A large purple oval labeled '2-5' indicates the 'Hybrid Type' (contacting both the endometrium and serosa, but < 50% of each), and a gray marker '8' indicates 'Other' locations such as cervical or parasitic fibroids. This anatomical diagram serves as an educational guide for clinicians to determine surgical approaches, such as hysteroscopic versus laparoscopic myomectomy, based on lesion classification.
uterine fibroids leiomyoma management
uterine fibroids FIGO classification medical treatment relugolix elagolix 2024 2025
Uterine Fibroids (Leiomyoma / Myoma)
Definition
Genetics & Pathogenesis
- Fibroids are estrogen- and progesterone-dependent - they grow during reproductive years and shrink after menopause
- Most grow slowly; in pregnancy they may rapidly enlarge early but typically do not grow further
- Key mutations:
- MED12 gene (X chromosome) - most common somatic mutation
- FH (fumarate hydratase) gene germline mutations - associated with early-onset uterine + cutaneous leiomyomas + renal cell carcinoma (Reed's syndrome)
- Also involve: inflammatory genes (interleukins, TNF-alpha), growth factor genes (VEGF, TGF-beta, IGF), hormonal receptor genes (estrogen, progesterone)
- Robbins Pathology, p.221; Goldman-Cecil Medicine, p.465
FIGO Classification by Location
| FIGO Type | Location | Clinical Significance |
|---|---|---|
| 0 | Pedunculated intracavitary | Worst bleeding; hysteroscopic removal |
| 1 | Submucosal, <50% intramural | Heavy menstrual bleeding, subfertility |
| 2 | Submucosal, ≥50% intramural | Heavy menstrual bleeding |
| 3 | Intramural, touches endometrium | Bleeding + fertility impact |
| 4 | Intramural | Bulk symptoms, variable bleeding |
| 5 | Subserosal, ≥50% intramural | Bulk/pressure symptoms |
| 6 | Subserosal, <50% intramural | Bulk/pressure symptoms |
| 7 | Pedunculated subserosal | Torsion risk; least effect on bleeding |
| 8 | Other (cervical, parasitic) | Variable |
| 2-5 | Hybrid (transmural) | Both bleeding and bulk |
Clinical Features
| Symptom | Notes |
|---|---|
| Heavy menstrual bleeding (HMB) | Most common; caused especially by submucosal fibroids distorting the endometrial cavity |
| Pelvic pain / pressure / fullness | Bulk symptoms from large/multiple fibroids |
| Dysmenorrhoea | Painful periods |
| Subfertility / recurrent miscarriage | Submucosal fibroids most implicated |
| Urinary frequency / urgency | Bladder compression by anterior fibroids |
| Constipation | Posterior fibroids pressing on rectum |
| Acute pain | From fibroid degeneration (especially in pregnancy) or torsion of pedunculated fibroid |
- Goldman-Cecil Medicine, p.467; Creasy & Resnik Maternal-Fetal Medicine, p.3062
Diagnosis
- Pelvic examination: enlarged, irregularly shaped, non-tender uterus
- Transvaginal ultrasound (TVS): first-line imaging - spherical, well-defined, hypoechoic mass; heterogeneous if degenerated
- MRI: gold standard for fibroid mapping pre-surgery; best defines size, number, and location
- Sonohysterography / hysteroscopy: best for submucosal fibroids
- PALM-COEIN classification is used for abnormal uterine bleeding; "L" = leiomyoma
Management
When to Treat?
Medical (Non-surgical) Options
| Agent | Mechanism | Notes |
|---|---|---|
| NSAIDs (naproxen, mefenamic acid) | Prostaglandin inhibition | Reduces pain and bleeding; first-line for mild symptoms |
| Combined OCP / LNG-IUS | Hormonal suppression | Reduce bleeding but do not shrink fibroids |
| GnRH agonists (leuprolide) | Suppresses estrogen | Shrinks fibroids 30-50%; used pre-op; menopausal SE, max 6 months |
| Oral GnRH antagonists | Immediate estrogen suppression | Elagolix 300mg BD + add-back, or Relugolix 40mg OD + estradiol 1mg + norethindrone 0.5mg (Myfembree) - FDA-approved; reduces HMB and preserves bone density; up to 2 years use |
| Mifepristone (5-10mg) | Anti-progesterone | Effective 6-month course |
| Ulipristal acetate | Selective progesterone receptor modulator | 5-10mg for 13 weeks; EU use suspended due to liver toxicity concerns |
Surgical / Procedural Options
| Procedure | Description | Best For |
|---|---|---|
| Hysteroscopic myomectomy | Endoscopic removal via the cervix | Submucosal (FIGO 0-2); preserves fertility |
| Laparoscopic myomectomy | Keyhole surgery | Intramural/subserosal; fertility-preserving |
| Open (abdominal) myomectomy | Large or multiple fibroids | Fertility-preserving; highest recurrence risk |
| Uterine artery embolization (UAE) | Cuts blood supply to fibroids | Suitable for women not wanting surgery; 28% need subsequent hysterectomy |
| Radiofrequency ablation | Thermal destruction | Newer; outpatient; non-fertility-preserving data limited |
| MRI-guided focused ultrasound | Non-invasive thermal ablation | Suitable selected patients |
| Hysterectomy | Definitive cure | No desire for future pregnancy; recurrence impossible |
Fibroid Recurrence After Myomectomy
- Cumulative risk of clinically significant new fibroids: ~10% at 5 years (sonographic detection higher: ~51% at 5 years if no size limit used)
- Risk of requiring a second surgery: 11% if single fibroid removed, 26% if multiple
- Subsequent childbearing is protective: 10-year recurrence 16% vs. 28% without pregnancy
- Berek & Novak's Gynecology, p.204-237
Fibroids in Pregnancy
- Detected in ~3-4% of midtrimester ultrasound scans
- Associated with: placenta previa (OR 2.2), preterm birth, malpresentation
- Degeneration can cause acute pain in pregnancy (treated conservatively with analgesia)
- Myomectomy during cesarean section is generally avoided unless absolutely necessary
- Creasy & Resnik Maternal-Fetal Medicine, p.3064
Key Summary
- Most fibroids are asymptomatic - only treat if symptomatic
- Submucosal fibroids cause the most bleeding and fertility problems
- Relugolix (Myfembree) and elagolix (Oriahnn) are modern oral GnRH antagonists with add-back that are now standard of care for medical management
- Myomectomy preserves fertility; hysterectomy is the only definitive cure
- Always exclude uterine sarcoma before assuming a rapidly enlarging mass is benign