
Part eight critical care medicine, section 1, respiratory critical care chapter number 311 approach with critical chapter 312, acute respiratory distress syndrome, chapter 313, mechanical ventilator support, section 2, shock and cardiac arrest, chapter number 314, approached to the patient with shock 315 sepsis septic shock, 316 cardiogenic shock and Parmar 317 cardiovascular collapse cardiac arrest and sudden cardiac death. Section number three, neurological critical care chapter number 318, nervous system disorders in critical care, teach me everything I need to know from these topics from Harrison 22nd latest edition, so I can understand these topics and you can add any images if you can
ARDS acute respiratory distress syndrome chest X-ray CT scan diffuse bilateral infiltrates
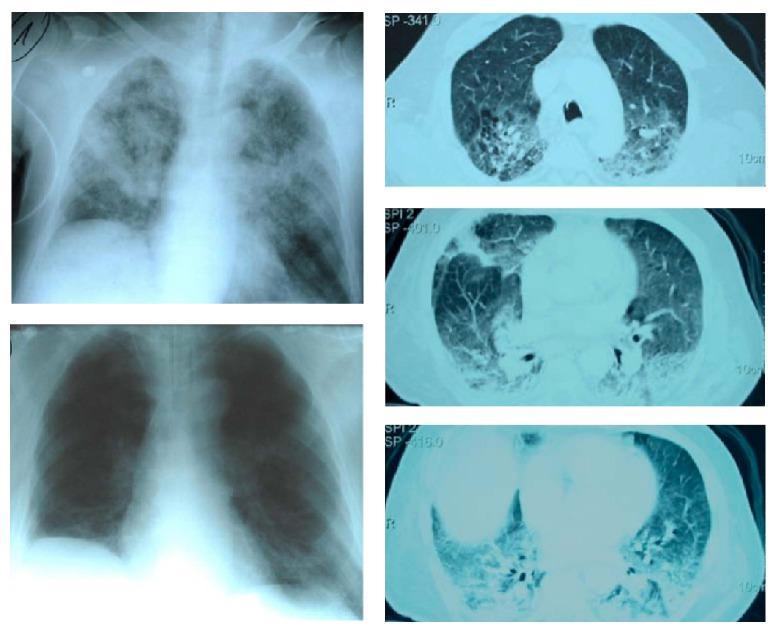
This composite diagnostic image includes chest X-rays and axial CT scans illustrating the progression and resolution of Acute Respiratory Distress Syndrome (ARDS). The top-left anterior-posterior chest X-ray shows diffuse, patchy bilateral alveolar infiltrates and ground-glass opacities in a postoperative patient, characteristic of pulmonary edema. To the right, three axial CT scan slices (cranial to caudal) demonstrate significant bilateral dorsal consolidation and dependent infiltrates with air bronchograms, typical of ARDS morphology. The bottom-left chest X-ray shows the same patient following Continuous Extrathoracic Negative Pressure Ventilation (CENPV), displaying marked regression of the bilateral infiltrates, improved lung aeration, and a reduction in previously noted pleural effusions. The educational focus is on the radiographic monitoring of lung recruitment and the resolution of pulmonary consolidations in critical care. This material is relevant for pulmonary medicine, anesthesia, and intensive care specialties.
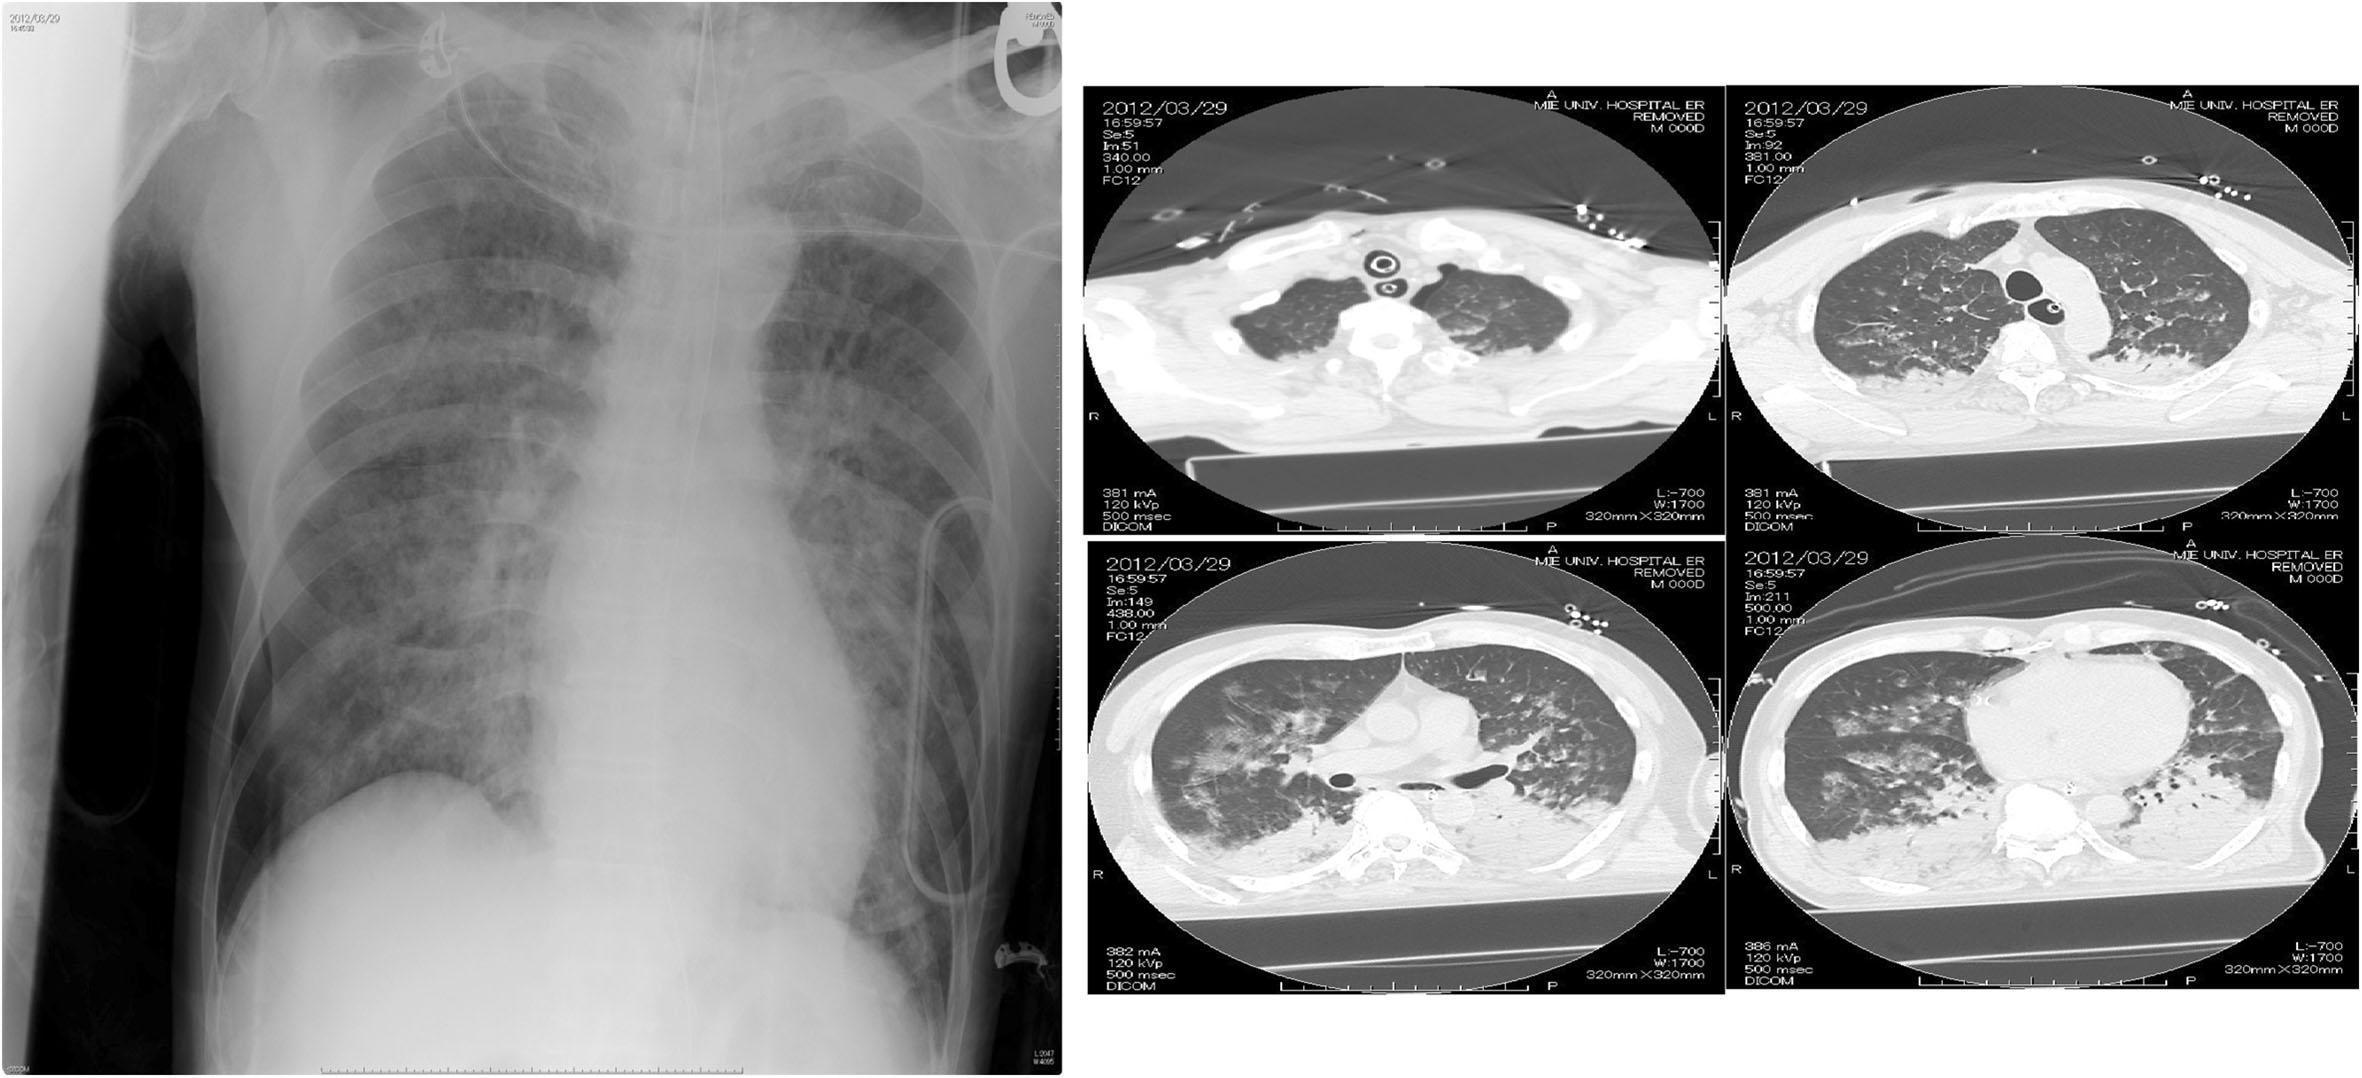
A composite diagnostic image featuring a frontal chest radiograph and multiple axial CT scans of the thorax. The chest X-ray demonstrates diffuse, patchy, bilateral pulmonary opacities and infiltrates involving all lung zones, characteristic of Acute Respiratory Distress Syndrome (ARDS) or extensive pulmonary edema. Normal vascular markings are obscured. The axial CT scan frames confirm widespread bilateral consolidation and ground-glass opacities, localized predominantly in the dependent (posterior) regions of the lungs in a supine patient. Additionally, the CT images reveal pathology in the left hemithorax, including multiple rib fractures and signs of a pneumohemothorax, characterized by air and fluid accumulation in the pleural space. Monitoring equipment, including an endotracheal tube and ECG leads, is visible. This clinical imaging set illustrates complex thoracic trauma and secondary respiratory failure, likely following chest compressions or acute lung injury.
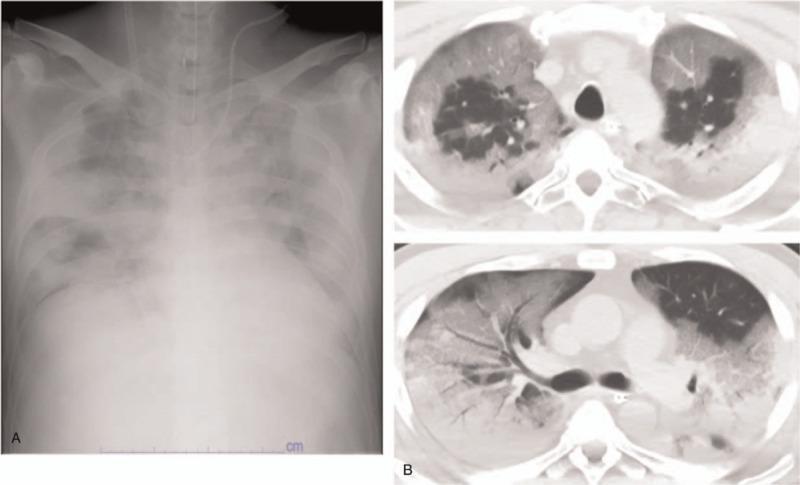
This composite diagnostic image displays imaging findings characteristic of Acute Respiratory Distress Syndrome (ARDS) in a patient with COVID-19 pneumonia. The left panel (A) is a front-view chest X-ray showing bilateral, diffuse alveolar infiltrates appearing as widespread hazy opacities across both lung fields. Notably, the cardiac silhouette appears normal in size, helping to differentiate this non-cardiogenic pulmonary edema from heart failure. The right panels (B) present two axial slices from a high-resolution computed tomography (HRCT) scan. These CT images demonstrate extensive, bilateral ground-glass opacities (GGOs)—areas of increased lung density where underlying bronchial and vascular structures remain visible. The distribution is peripheral and patchy, typical of viral pneumonitis progressing to ARDS. Clinical relevance includes the visual documentation of severe parenchymal lung disease requiring advanced respiratory support, such as mechanical ventilation or ECMO, as indicated by the presence of an endotracheal tube and monitoring lines in the X-ray.
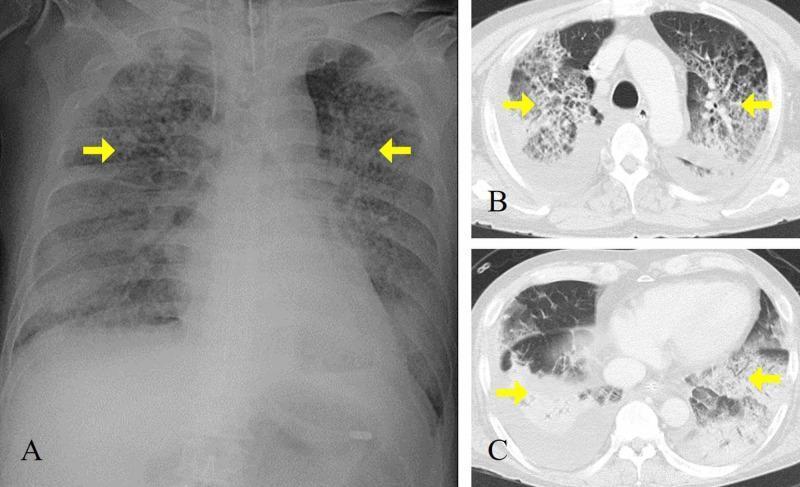
This composite diagnostic image features a chest X-ray (A) and axial CT scans (B, C) of a patient with Acute Respiratory Distress Syndrome (ARDS). (A) An anteroposterior chest radiograph demonstrates diffuse, bilateral alveolar infiltrates and patchy opacification across both lung fields, notably sparing the upper zones, with a normal cardiac silhouette and no signs of cardiomegaly. Yellow arrows highlight dense consolidation in the mid-lung regions. (B, C) Axial CT images at different thoracic levels reveal extensive, bilateral ground-glass opacities and dense consolidation, particularly in the dependent posterior regions of the lower lobes. Associated reticular patterns suggest interstitial involvement. The mediastinal structures and great vessels appear normal, and there is no evidence of significant pleural effusion. The imaging findings are classically consistent with non-cardiogenic pulmonary edema and diffuse alveolar damage typical of severe viral pneumonia (e.g., H1N1 influenza) progressing to ARDS. This material is suitable for training in intensive care medicine and radiology, focusing on the visual differentiation between cardiogenic and non-cardiogenic pulmonary opacities.
mechanical ventilation pressure volume curve lung protective ventilation
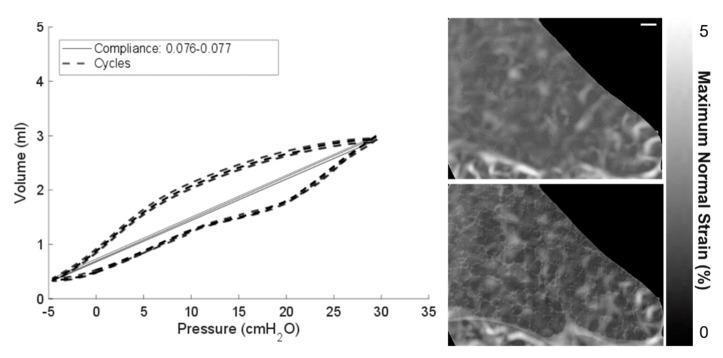
This composite educational graphic details lung mechanical ventilation reliability and tissue strain analysis using digital volume correlation (DVC). The left panel displays a Pressure-Volume (P-V) curve plot, showing the relationship between Pressure (cmH2O, x-axis from -5 to 35) and Volume (ml, y-axis from 0 to 5). Four ventilation cycles are overlaid as dashed lines, demonstrating sigmoidal hysteretic loops characteristic of respiratory compliance. A solid grey line indicates a consistent compliance range of 0.076–0.077. The right panel consists of two vertically stacked DVC strain field images of lung tissue within an intact thorax, labeled with a 200 µm scale bar. The top image shows the unfiltered strain field, while the bottom image shows the same field after Paganin filtering. The filtered version displays improved contrast between tissue and air by reducing noise within tissue boundaries. Both images include a grayscale color bar indicating 'Maximum Normal Strain (%)' ranging from 0 to 5. This figure illustrates the application of biomedical engineering principles to visualize local lung tissue deformation and characterize pulmonary mechanics during mechanical loading.
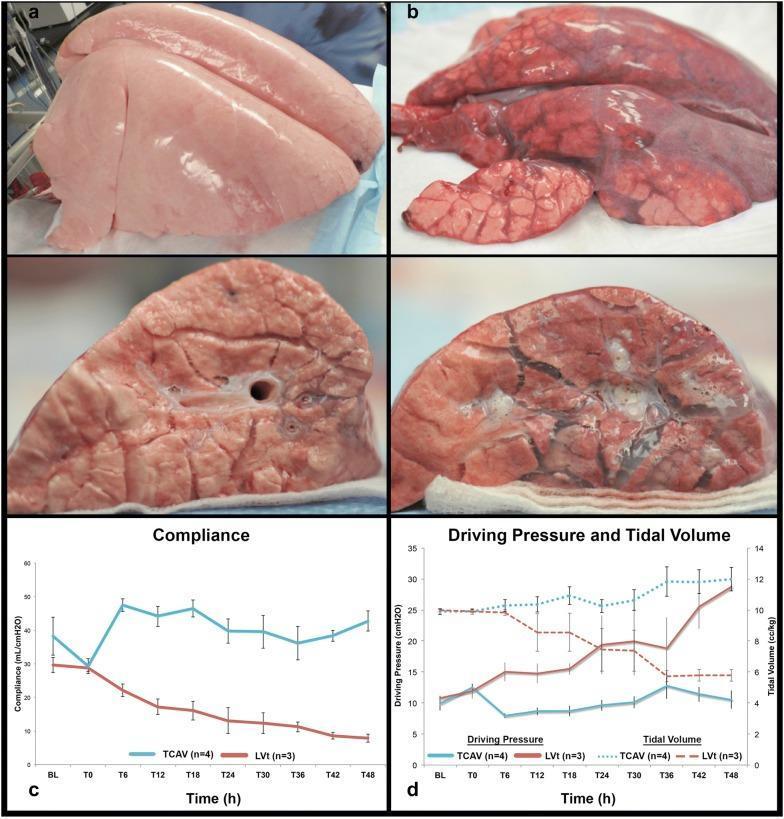
This educational image presents a comparison between two mechanical ventilation strategies—Time-Controlled Adaptive Ventilation (TCAV) and ARDSNet Low Tidal Volume (LVt) ventilation—in a 48-hour porcine model of Acute Respiratory Distress Syndrome (ARDS). Panels A and B show gross lung photographs and cross-sections. The TCAV-treated lung (a) exhibits a healthy, light pink, well-inflated appearance with a smooth pleural surface and minimal edema. In contrast, the ARDSNet LVt-treated lung (b) shows severe acute lung injury, characterized by a dark red, mottled, and congested appearance with visible atelectasis and significant pulmonary edema. Panels C and D provide quantitative physiological data over a 48-hour period. Graph C demonstrates that Respiratory System Compliance (CRS) remains stable and improves with TCAV, while it progressively declines with the LVt method. Graph D shows that TCAV maintains low Driving Pressure (ΔP) even as Tidal Volume (Vt) increases, whereas the LVt group experiences a sharp rise in ΔP despite decreasing Vt. This illustrates the lung-protective efficacy of TCAV in maintaining alveolar recruitment and mechanical stability compared to conventional low-volume strategies.
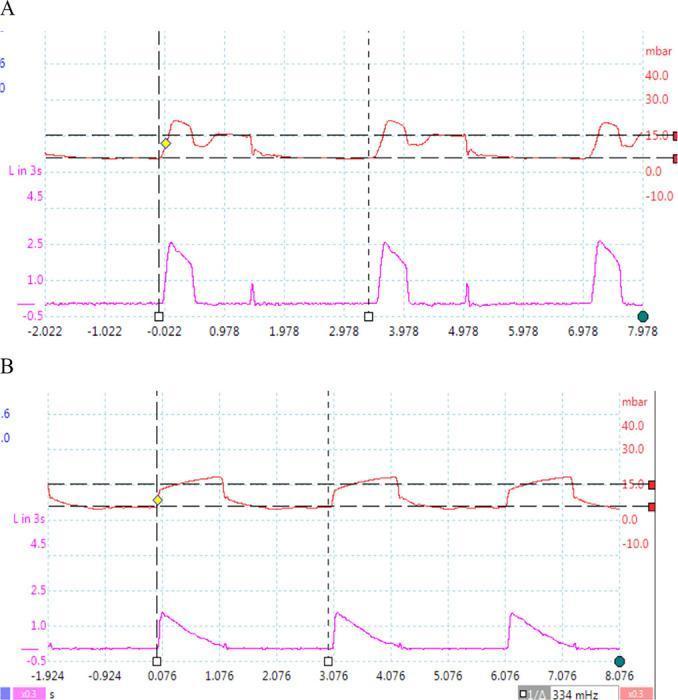
A comparison chart consisting of two sets of mechanical ventilation waveforms (pressure-time and flow-time curves) demonstrating different control variables. The upper panel (Ventilator 1) shows characteristics of volume-controlled ventilation, where the pressure curve (red) reaches a peak and then maintains a plateau, while the flow curve (purple) rises instantaneously and remains constant before falling, indicating a square flow waveform. The lower panel (Ventilator 2) illustrates pressure-controlled ventilation. In this mode, the pressure curve (red) rapidly rises to a set level (approximately 15 mbar) and maintains a plateau, while the flow curve (purple) shows a peak followed by a decelerating ramp pattern. Both panels show three respiratory cycles over an approximately 8-second window, with vertical dashed lines marking the start of inspiration. These waveforms are critical for respiratory therapy education to distinguish between volume-preset and pressure-preset mechanical ventilation strategies.
sepsis pathophysiology inflammatory cascade organ failure management bundle
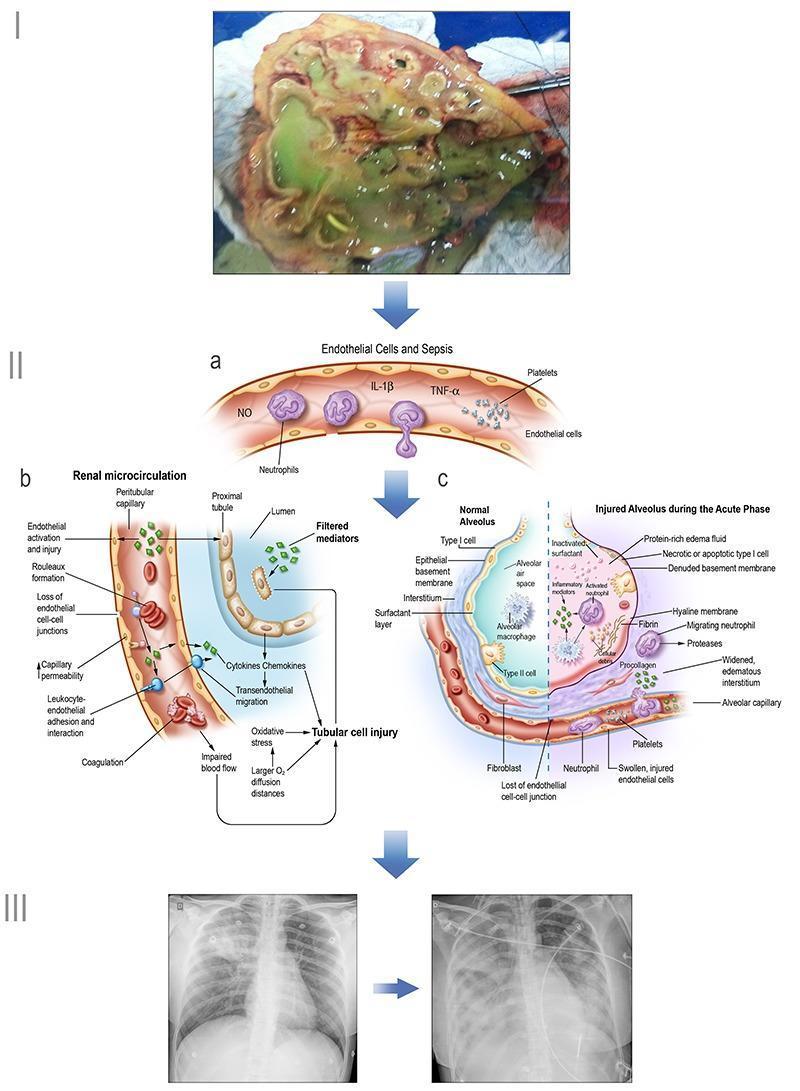
Educational infographic illustrating the pathogenesis of sepsis and multi-organ dysfunction. Section I shows a clinical photograph of a necrotic kidney (pyelonephritis). Section II contains three pathophysiology diagrams: (a) General endothelial changes in sepsis, depicting neutrophil extravasation, platelet activation, and release of inflammatory mediators like TNF-α, IL-1β, and NO; (b) Renal microcirculation injury, highlighting peritubular capillary changes (rouleaux formation, leukocyte adhesion, increased permeability) and subsequent tubular cell injury via oxidative stress and impaired blood flow; (c) Alveolar-capillary comparative diagram, contrasting a normal alveolus with one in the acute phase of ARDS, showing hyaline membrane formation, protein-rich edema, and Type I cell necrosis. Section III features diagnostic chest X-rays demonstrating progressive bilateral opacities consistent with acute respiratory distress syndrome. This visual summary correlates clinical findings, diagnostic imaging (radiography), and microscopic pathophysiology to explain systemic sepsis-induced organ failure.
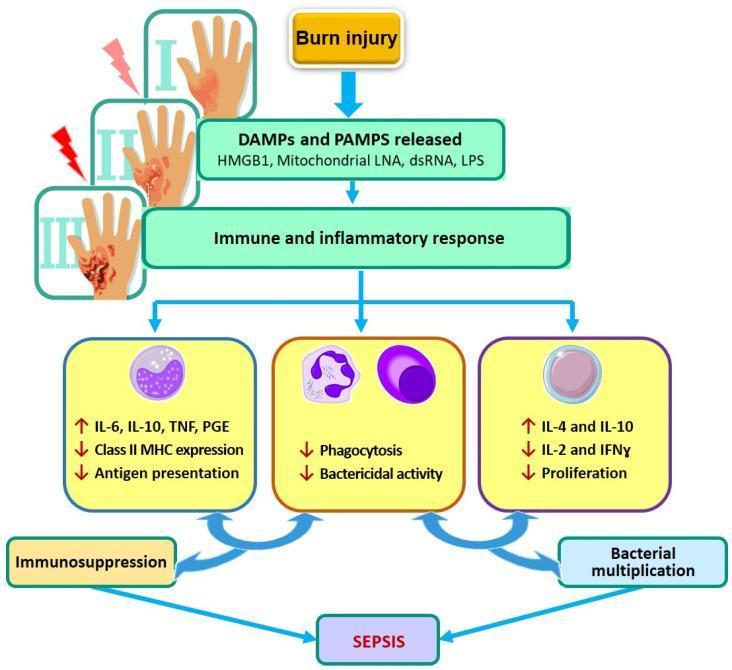
A pathophysiology flow diagram illustrating the immunological cascade from severe burn injury to the development of sepsis. The diagram begins with a burn injury, represented by illustrations of first-, second-, and third-degree burns on a hand, leading to the systemic release of Damage-Associated Molecular Patterns (DAMPs) and Pathogen-Associated Molecular Patterns (PAMPs), specifically citing HMGB1, mitochondrial LNA, dsRNA, and LPS. This initiates a complex immune and inflammatory response characterized by three convergent pathways: 1) Pro-inflammatory and anti-inflammatory cytokine imbalances (increased IL-6, IL-10, TNF, and PGE) alongside reduced Class II MHC expression and antigen presentation, leading to immunosuppression. 2) Impaired innate cellular function, specifically decreased phagocytosis and bactericidal activity. 3) Th2-skewed cytokine shifts (increased IL-4 and IL-10; decreased IL-2 and IFN̲γ) and reduced lymphocyte proliferation, promoting bacterial multiplication. These combined dysregulated host responses ultimately culminate in burn-induced sepsis.
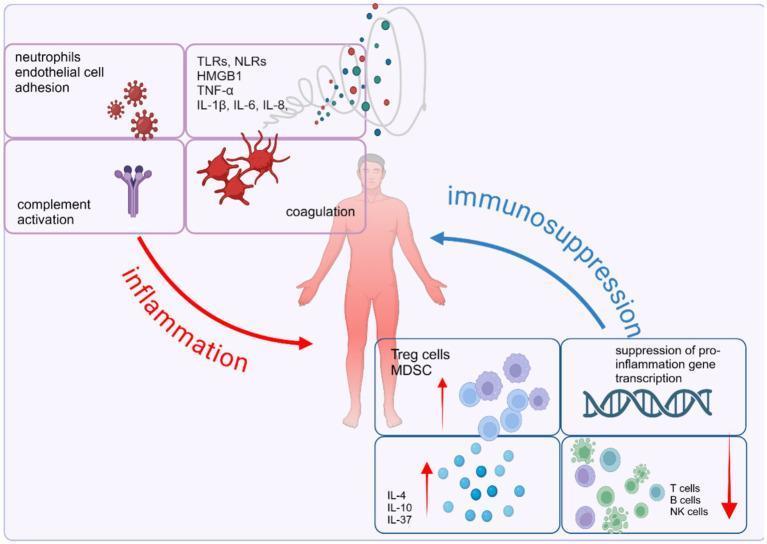
This pathophysiology diagram illustrates the dysregulated host immune response in sepsis, characterized by an imbalance between concurrent pro-inflammatory and anti-inflammatory pathways. Centered on a human figure, the left side (red 'inflammation' arrow) details the acute systemic inflammatory response syndrome (SIRS), featuring neutrophil-endothelial cell adhesion, complement activation, and coagulation cascades. A molecular cloud identifies key mediators including DAMPs/PAMPs (HMGB1, TLRs, NLRs) and pro-inflammatory cytokines (TNF-α, IL-1β, IL-6, IL-8). Conversely, the right side (blue 'immunosuppression' arrow) represents the compensatory anti-inflammatory response syndrome (CARS). This includes the expansion of suppressor cells (Treg cells, MDSCs) and anti-inflammatory cytokines (IL-4, IL-10, IL-37), the suppression of pro-inflammatory gene transcription, and the depletion or exhaustion of effector cells (T cells, B cells, and NK cells). The diagram serves as an educational tool for understanding the complex signaling pathways and cellular interactions that drive multi-organ dysfunction and immune homeostasis failure during septic shock.
cardiogenic shock cardiac arrest resuscitation algorithm CPR
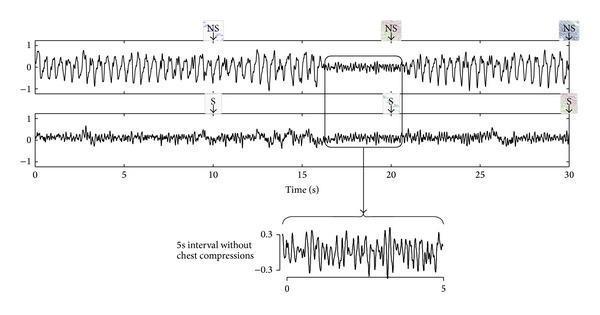
This comparative ECG waveform diagram illustrates the efficacy of adaptive filtering in suppressing cardiopulmonary resuscitation (CPR) artifacts during out-of-hospital cardiac arrest (OHCA). The top panel displays a 30-second electrocardiogram strip corrupted by high-amplitude, rhythmic oscillations caused by chest compressions. These artifacts obscure the underlying cardiac rhythm, leading a Shock Advisory Algorithm (SAA) to produce incorrect 'No-Shock' (NS) diagnoses. The bottom panel shows the same ECG segment after processing with an adaptive filter; the large-scale artifacts are significantly attenuated, revealing the underlying low-amplitude, disorganized activity characteristic of Ventricular Fibrillation (VF). An inset focus area highlights a 5-second interval where chest compressions were paused, providing visual confirmation that the filtered signal accurately represents the underlying VF. Following filtration, the SAA correctly identifies the rhythm as shockable ('S'). This graphic demonstrates the clinical importance of advanced signal processing in automated external defibrillators (AEDs) to maintain diagnostic accuracy during active resuscitation.
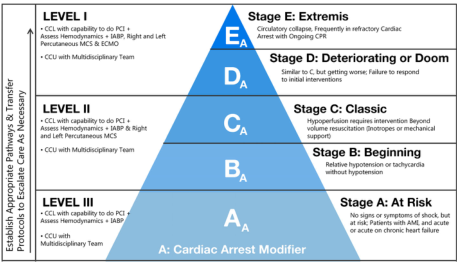
Summary : This figure presents a pyramid-based classification system for stages of cardiogenic shock, integrating care levels and escalation protocols. The stages range from "At Risk" to "Extremis," with a cardiac arrest modifier, and are mapped to three levels of care capability. flowchart: # Pyramid Structure & Stages : • The pyramid is divided into five horizontal stages labeled A, B, C, D, E (bottom to top). • Each stage corresponds to a clinical state: – Stage A: At Risk (no signs/symptoms of shock, but at risk; includes patients with AMI, acute or chronic heart failure) – Stage B: Beginning (relative hypotension or tachycardia without hypotension) – Stage C: Classic (hypoperfusion requiring intervention beyond volume resuscitation) – Stage D: Deteriorating or Doom (similar to C, but worsening; failure to respond to interventions) – Stage E: Extremis (circulatory collapse, refractory cardiac arrest with ongoing CPR) • Cardiac Arrest Modifier (Aₐ, Bₐ, Cₐ, Dₐ, Eₐ) overlays all stages. # Care Levels : • Three levels of care are shown on the left: – LEVEL I: Highest capability (PCI, hemodynamics, IABP, right/left percutaneous MCS & ECMO, CCU with multidisciplinary team) – LEVEL II: Intermediate capability (PCI, hemodynamics, IABP, right percutaneous MCS, CCU with multidisciplinary team) – LEVEL III: Basic capability (PCI, hemodynamics, CCU with multidisciplinary team) • Each care level is mapped to the pyramid stages, indicating where escalation and transfer protocols should be established. # Escalation & Transfer Protocols : • Arrow on the left indicates the need to "Establish Appropriate Pathways & Transfer Protocols to Escalate Care As Necessary" as the stage increases in severity. # Design Encodings : • Pyramid uses blue gradient shading from light (bottom) to dark (top). • Stage letters (A, B, C, D, E) are large and bold within each pyramid segment. • Cardiac Arrest Modifier is denoted by subscript "A" (e.g., Cₐ). • Text descriptions for each stage are provided within the pyramid. # Analysis : • The figure visually organizes the progression of cardiogenic shock from risk to extremis, emphasizing the need for escalating care and transfer protocols as severity increases. • The cardiac arrest modifier applies across all stages, highlighting the importance of recognizing cardiac arrest at any point. • The pyramid structure reinforces the concept of increasing severity and required resources as patients move up the stages. • The left-aligned care levels clarify the capabilities needed at each stage, supporting rapid decision-making and resource allocation.
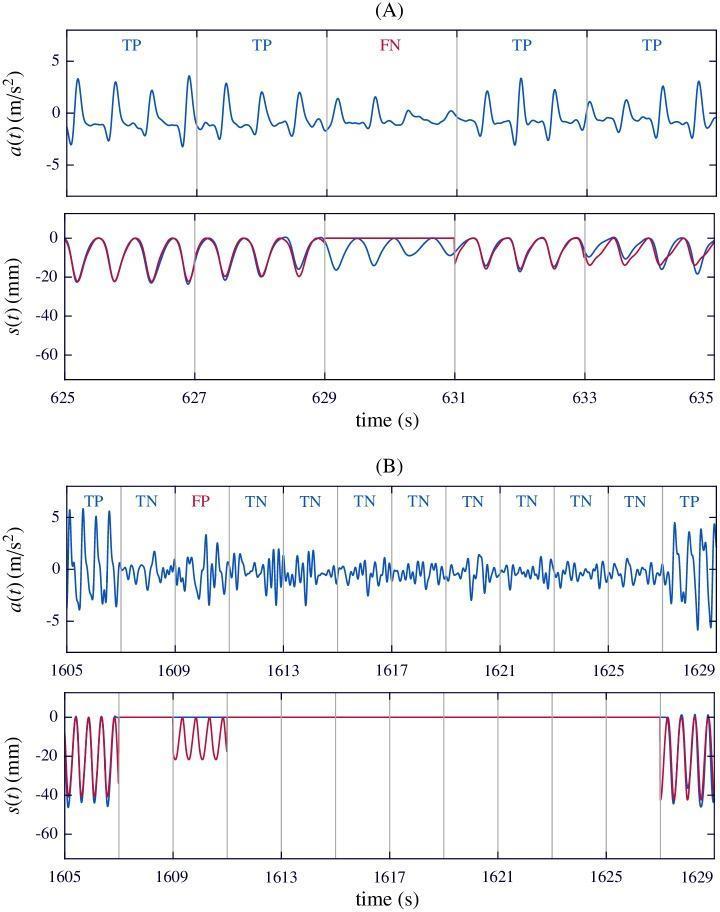
Comparison of chest compression acceleration and displacement signals used in cardiopulmonary resuscitation (CPR) feedback algorithms. Panel A displays a time-series plot of acceleration a(t) in m/s² and compression depth s(t) in mm. It illustrates an 'isolated false negative' (FN) where low-amplitude acceleration and shallow compression depth (approximately 10 mm) lead the algorithm to reconstruct a flat line (red) instead of tracking the actual sinusoidal displacement (blue). Panel B illustrates an 'isolated false positive' (FP), where noisy acceleration signals during a 'hands-off' interval (no compressions) are incorrectly interpreted by the algorithm as compression activity, shown by the red reconstructed signal. The graphs utilize segments labeled TP (True Positive), TN (True Negative), FP, and FN to evaluate algorithm performance. These diagnostic signals are critical for real-time monitoring of CPR quality, ensuring adherence to guidelines for compression rate and depth to optimize hemodynamics during cardiac arrest management.
intracranial pressure brain herniation ICP waveform neurological critical care
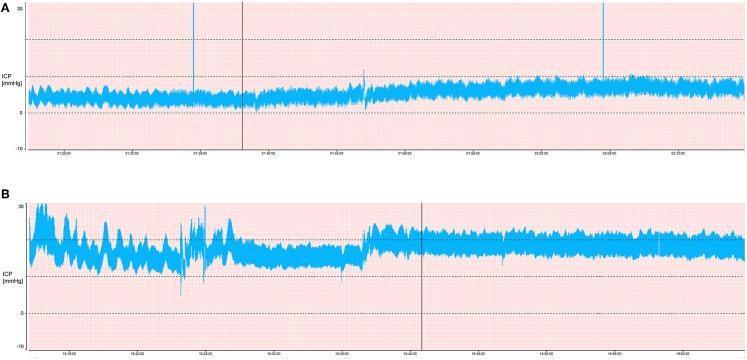
A comparison of two intracranial pressure (ICP) waveforms illustrating the visual differences between physiological and pathological pressure states. Panel A shows a normal ICP tracing with a mean pressure of approximately 5 mmHg. The signal is stable, exhibiting low pulse wave amplitude and high uniformity, reflecting normal intracranial compliance. Panel B displays a pathological ICP tracing at a mean pressure of 20 mmHg, a common clinical treatment threshold for intracranial hypertension. This waveform is characterized by increased pulsatility, higher pulse wave amplitude, and greater signal instability. The increased jaggedness and wider vertical oscillation in Panel B indicate reduced intracranial compliance. Both charts plot pressure in mmHg over time, set against a grid for quantitative assessment of mean levels and rhythmic fluctuations. These tracings are used in neuro-intensive care to identify abnormal pressure patterns such as Lundberg A or B waves and to guide treatment for traumatic brain injury (TBI) and other neurological conditions.
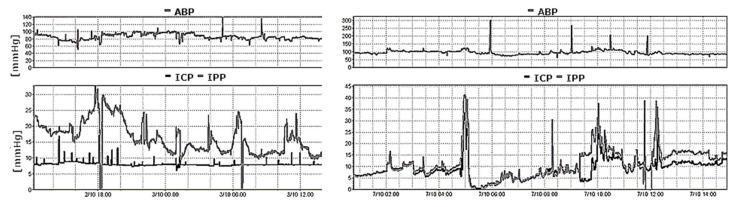
A comparative medical waveform display illustrating intracranial pressure monitoring dynamics in a patient with subarachnoid hemorrhage. The visual is divided into two clinical states: 'Drain Opened' (left panels) and 'Drain Closed' (right panels). The top row monitors Arterial Blood Pressure (ABP) in mmHg, while the bottom row provides a dual-trace of Intracranial Pressure (ICP) via an External Ventricular Drain (EVD) and Intraparenchymal Pressure (IPP). When the EVD is open (left), the ICP trace remains a horizontal constant representing the drainage level relative to the heart, showing no correlation with the fluctuating IPP. When the EVD is closed (right), the ICP and IPP traces become synchronous and highly correlated, reflecting shared intracranial dynamics. The graphic demonstrates the clinical importance of clamping an EVD to obtain accurate, comparable physiological intracranial pressure measurements. This monitoring is critical for managing cerebral perfusion pressure (CPP) and detecting elevated ICP that may lead to cerebral ischemia or herniation in neurocritical care settings.
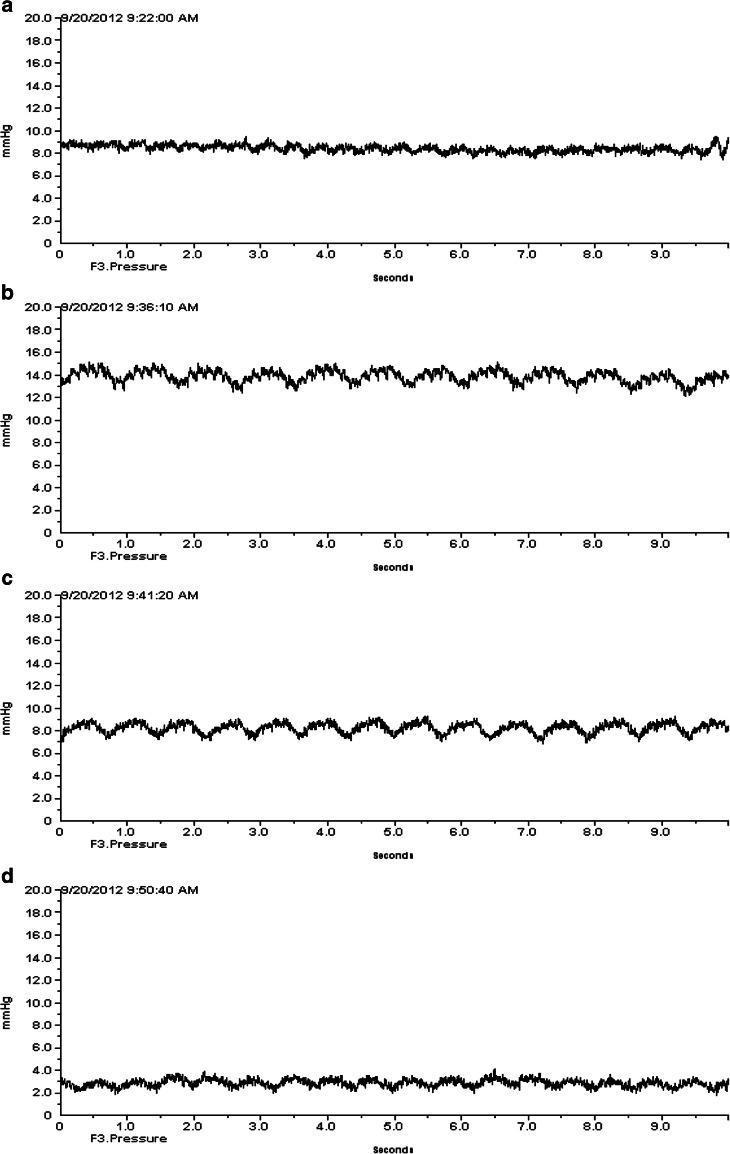
A sequence of four clinical intracranial pressure (ICP) waveforms (labeled a-d) recorded over 10-second intervals following a cryogenic brain injury model. The x-axis represents time in seconds, and the y-axis represents pressure in mmHg (0.0 to 20.0). Panel (a) shows a baseline ICP of approximately 8 mmHg with low-amplitude pulsatility before anesthesia. Panel (b) illustrates a transient spike in ICP to roughly 14 mmHg during anesthesia induction, characterized by increased waveform amplitude and distinct cardiac/respiratory rhythmic pulsations. Panel (c) shows the ICP returning toward the pre-anesthetic baseline of 8 mmHg as effects stabilize. Panel (d) demonstrates the pharmacological effect of AF-16 administration, showing a significant reduction in ICP to approximately 3 mmHg with dampened pulsatile variations. These recordings highlight the dynamic monitoring of intracranial hypertension and the subsequent therapeutic response to a neuroprotective peptide, illustrating changes in both absolute pressure levels and the morphology of pulsatile wave components.
HARRISON'S 22E - PART 8: CRITICAL CARE MEDICINE
Complete Study Guide
SECTION 1: RESPIRATORY CRITICAL CARE
CHAPTER 311 - APPROACH TO THE PATIENT WITH CRITICAL ILLNESS
The Core Philosophy of ICU Care
SEVERITY-OF-ILLNESS SCORING SYSTEMS
- Define patient populations for clinical trials
- Guide resource allocation (nursing ratios, beds)
- Assess quality of ICU care over time
- Newer use: sepsis prognostication (qSOFA)
SOFA Score (Sequential Organ Failure Assessment)
| Organ System | Parameter Measured |
|---|---|
| Respiratory | PaO2/FiO2 ratio |
| Coagulation | Platelet count |
| Liver | Bilirubin |
| Cardiovascular | MAP or vasopressor dose |
| CNS | Glasgow Coma Scale |
| Renal | Creatinine or urine output |
- Rising SOFA score = rising mortality
- A rise of ≥2 points from baseline in the setting of suspected infection = SEPSIS (Sepsis-3 definition)
qSOFA (Quick SOFA)
- Respiratory rate ≥ 22 breaths/min
- Altered mental status
- Systolic BP ≤ 100 mmHg
APACHE (Acute Physiology and Chronic Health Evaluation)
- Based on: age + chronic medical illness + physiologic derangements from normal
- Used predominantly for research and epidemiology
ICU MONITORING AND MANAGEMENT TOOLS
Hemodynamic Monitoring
- Measures: CVP, PA pressure, PCWP (wedge), cardiac output, SvO2
- Allows calculation of systemic and pulmonary vascular resistance
- Use has declined due to lack of mortality benefit in most trials, but remains useful for:
- Differentiating cardiogenic vs. non-cardiogenic pulmonary edema
- Managing refractory shock
- Evaluating pulmonary hypertension
Respiratory Monitoring
- Pulse oximetry: Non-invasive SpO2 monitoring (limitations in poor perfusion, dark skin pigmentation)
- End-tidal CO2 (ETCO2): Confirms ETT placement, trends in ventilation
- Arterial Blood Gas (ABG): Gold standard for oxygenation, ventilation, acid-base
Neurological Monitoring
- GCS, pupillary responses
- Continuous EEG in comatose patients (detect non-convulsive seizures)
- ICP monitoring in TBI, hepatic failure
COMMON ICU INTERVENTIONS
Renal Replacement Therapy (RRT)
- Acidosis (refractory metabolic acidosis)
- Electrolytes (life-threatening hyperkalemia)
- Ingestion (dialyzable toxins)
- Overload (refractory fluid overload)
- Uremia (uremic pericarditis, encephalopathy, platelets dysfunction)
Nutrition in the ICU
- Early enteral nutrition preferred (within 24-48h) - preserves gut mucosal integrity
- Parenteral nutrition if enteral is contraindicated (>5-7 days)
- Target: ~25 kcal/kg/day; protein 1.2-2.0 g/kg/day
- Avoid overfeeding - causes hyperglycemia and immunosuppression
Glycemic Control
- Hyperglycemia worsens outcomes in ICU
- Target glucose: 140-180 mg/dL (NICE-SUGAR trial showed harm from tight control <110 mg/dL)
- Use insulin infusions
Stress Ulcer Prophylaxis
- Indications: mechanical ventilation >48h, coagulopathy, head injury, burns
- Agents: PPIs or H2 blockers
DVT/PE Prophylaxis
- All ICU patients unless contraindicated
- LMWH preferred; UFH acceptable; SCDs if anticoagulation contraindicated
END-OF-LIFE ISSUES IN THE ICU
- Intensivists must counsel patients and families on prognosis honestly
- Withdrawing support (e.g., ventilator) is ethically equivalent to withholding it
- Palliative care should be integrated early, not just at "end"
- Document advance directives, goals-of-care discussions
- Address pain, dyspnea, and existential distress even during active treatment
CHAPTER 312 - ACUTE RESPIRATORY DISTRESS SYNDROME (ARDS)
Definition - The Berlin Definition (2012)
- Timing: Onset within 1 week of known clinical insult or new/worsening respiratory symptoms
- Imaging: Bilateral opacities on CXR or CT not fully explained by effusions, collapse, or nodules
- Origin: Not fully explained by cardiac failure or fluid overload (if no risk factor, need echo to rule out cardiogenic)
- Oxygenation (on PEEP ≥5 cmH2O):
- Mild: PaO2/FiO2 201-300 mmHg
- Moderate: PaO2/FiO2 101-200 mmHg
- Severe: PaO2/FiO2 ≤100 mmHg
ARDS Imaging - Classic Features
CAUSES OF ARDS
- Pneumonia (most common) - bacterial, viral, fungal
- Aspiration of gastric contents
- Pulmonary contusion
- Near-drowning
- Inhalation injury
- Sepsis (most common overall cause)
- Pancreatitis
- Non-pulmonary trauma with shock
- Massive transfusion / transfusion-related acute lung injury (TRALI)
- Burns
- Drug overdose (heroin, aspirin, cocaine)
PATHOPHYSIOLOGY OF ARDS
Phase 1: Exudative Phase (0-7 days)
- Alveolar epithelial and endothelial injury
- Neutrophil activation and recruitment
- Disruption of the alveolar-capillary barrier
- Diffuse alveolar damage (DAD) - protein-rich fluid floods alveoli
- Hyaline membrane formation
- Surfactant dysfunction → alveolar collapse
- Result: severe hypoxemia (shunt physiology)
Phase 2: Proliferative Phase (7-21 days)
- Type II pneumocyte proliferation to repair alveolar epithelium
- Alveolar macrophage activation
- Fibroproliferation begins
- Some patients improve; others progress to fibrosis
Phase 3: Fibrotic Phase (>21 days)
- Architectural remodeling
- Dense fibrosis
- Bullae formation
- Loss of gas exchange surface area
- Associated with poor prognosis, prolonged ventilation
MANAGEMENT OF ARDS
Lung-Protective Ventilation (ARDSNet Protocol) - THE MOST IMPORTANT TREATMENT
| Parameter | Target |
|---|---|
| Tidal volume | 6 mL/kg IBW (reduce to 4 mL/kg if needed) |
| Plateau pressure | ≤30 cmH2O |
| Driving pressure | ≤15 cmH2O (plateau - PEEP) |
| PEEP | Titrated to FiO2 (use PEEP-FiO2 table) |
| FiO2 | Titrate to SpO2 88-95% or PaO2 55-80 mmHg |
| Rate | 6-35 breaths/min (to manage pH) |
Additional Supportive Strategies
- Indicated in severe ARDS (PaO2/FiO2 <150 despite FiO2 ≥0.6 and PEEP ≥5)
- 16+ hours/day in prone position
- The PROSEVA trial showed 28-day mortality reduced from 32.8% to 16% with proning
- Mechanism: recruits dependent (posterior) atelectatic lung, improves V/Q matching, reduces VILI
- Cisatracurium infusion for 48h in moderate-severe ARDS
- ACURASYS trial showed benefit; ROSE trial questioned it
- Reduces patient-ventilator dyssynchrony and oxygen consumption
- Use only with adequate sedation
- After initial resuscitation, target neutral to negative fluid balance
- FACTT trial: conservative strategy improved oxygenation and shortened ventilator days without increasing renal failure
- Low-dose methylprednisolone (1 mg/kg/day) may be beneficial in early ARDS (<14 days)
- Reduces fibroproliferation
- Not beneficial if started >14 days
- VV-ECMO for severe refractory ARDS (PaO2/FiO2 <80 despite optimal management)
- CESAR trial and EOLIA trial data support use in specialized centers
- Provides "lung rest" while native lung recovers
- Inhaled NO (improves oxygenation but no mortality benefit)
- Surfactant (benefit only in neonates, not adults)
- High-frequency oscillatory ventilation (HFOV) - OSCILLATE trial showed harm
- Ketoconazole, lisofylline, salbutamol
OUTCOMES OF ARDS
- Overall mortality: ~40% (severe ARDS up to 45%)
- Most deaths from underlying cause/MOF, not pure respiratory failure
- Survivors have:
- Muscle weakness and wasting (ICU-acquired weakness)
- Cognitive impairment and PTSD
- Quality of life impairment for months-years
- Pulmonary function usually recovers within 6-12 months
CHAPTER 313 - MECHANICAL VENTILATOR SUPPORT
INDICATIONS FOR MECHANICAL VENTILATION
- Respiratory failure - inability to maintain adequate oxygenation or ventilation
- Airway protection - altered consciousness, inability to protect airway
- Excessive work of breathing - impending respiratory fatigue
- Hemodynamic support - reduces O2 consumption by respiratory muscles
- PaO2 <60 mmHg despite supplemental O2
- PaCO2 >50 mmHg with acidosis (pH <7.35) and rising
- RR >30-35 breaths/min with fatigue
- GCS ≤8
TYPES OF MECHANICAL VENTILATION
Invasive Mechanical Ventilation (IMV)
- Set: tidal volume + flow rate
- Variable: peak pressure (depends on compliance/resistance)
- Guarantees minute ventilation regardless of lung mechanics
- Use: standard first-line in most ICU patients
- Set: inspiratory pressure above PEEP
- Variable: tidal volume (depends on lung compliance)
- Produces decelerating flow waveform (better gas distribution)
- Use: ARDS, when pressure control desired
- Patient-triggered; each breath augmented to set pressure
- Fully spontaneous - patient controls rate and timing
- Use: Weaning; assesses readiness for extubation
- Delivers mandatory breaths plus allows spontaneous breathing
- Largely fallen out of favor - may prolong weaning
VENTILATOR SETTINGS
| Parameter | Function | Typical Range |
|---|---|---|
| Tidal Volume (VT) | Volume per breath | 6-8 mL/kg IBW |
| Rate (RR) | Breaths/min | 12-20 |
| FiO2 | Fraction inspired O2 | 0.21-1.0 |
| PEEP | End-expiratory pressure | 5-20 cmH2O |
| I:E ratio | Inspiration:Expiration | 1:2 (normal) |
| Flow rate | How fast air delivered | 40-80 L/min |
PEEP (Positive End-Expiratory Pressure)
- Purpose: Prevents alveolar collapse at end-expiration; recruits alveoli; improves oxygenation
- Intrinsic PEEP (auto-PEEP): Dangerous - air trapping in obstructive disease (asthma, COPD)
- Detect by expiratory hold maneuver
- Treat: reduce RR, reduce I:E ratio (longer expiration), bronchodilators
- Optimal PEEP: Balances recruitment vs. overdistension
Key Lung Mechanics Measurements
- Measured during inspiratory hold
- Reflects alveolar pressure (static compliance)
- Target: ≤30 cmH2O
- Reflects stress on lung parenchyma
- Target: ≤15 cmH2O
- Best predictor of ARDS outcomes
- Normal: 60-100 mL/cmH2O
- Low in ARDS, fibrosis (stiff lungs)
- Normal in airway obstruction
NON-INVASIVE VENTILATION (NIV)
CPAP (Continuous Positive Airway Pressure)
- Single level of pressure throughout respiratory cycle
- Patient breathes spontaneously
- Use: OSA, cardiogenic pulmonary edema, hypoxemia
BiPAP/NPPV (Bilevel Positive Airway Pressure)
- IPAP (inspiratory) + EPAP (expiratory)
- Reduces work of breathing, improves gas exchange
- Best evidence in:
- COPD exacerbation with hypercapnia (reduces intubation, mortality)
- Cardiogenic pulmonary edema
- Immunocompromised patients (avoids infectious complications of intubation)
- Inability to protect airway
- Hemodynamic instability
- Copious secretions
- Recent upper GI/esophageal surgery
- Uncooperative patient
- Facial trauma
High-Flow Nasal Cannula (HFNC)
- Delivers up to 60 L/min of humidified, heated O2
- Provides modest PEEP (~2-5 cmH2O)
- Reduces work of breathing
- FLORALI trial: noninferior to NIV for hypoxemic respiratory failure
- Does not delay intubation if patient failing
WEANING FROM MECHANICAL VENTILATION
- Underlying cause resolving
- Adequate oxygenation: SpO2 ≥90% on FiO2 ≤0.4-0.5 and PEEP ≤5-8
- Hemodynamically stable (no/minimal vasopressors)
- Able to initiate breaths
- Alert enough to follow commands
- Trial of T-piece, CPAP 5 cmH2O, or PSV 5-8 cmH2O
- Duration: 30-120 minutes
- Failure criteria: SpO2 <90%, RR >35, HR >140 or change >20%, agitation, diaphoresis, accessory muscle use
- <105 = likely to wean successfully
-
105 = likely to fail
- Assess: cough strength, secretion load, gag reflex
- Cuff leak test: predicts stridor post-extubation
- After extubation: HFNC reduces reintubation risk (OPTIVENT trial data)
- Consider if ventilation expected >14-21 days
- Benefits: patient comfort, oral care, secretion management, may facilitate weaning
- Timing: early (7-10 days) vs. late (>10 days) - no clear mortality difference
SECTION 2: SHOCK AND CARDIAC ARREST
CHAPTER 314 - APPROACH TO THE PATIENT WITH SHOCK
DEFINITION
- Without O2, cells switch from aerobic → anaerobic metabolism
- Pyruvate → lactate instead of entering mitochondria
- Far less ATP generated per glucose
- ATP failure → disrupts Na+/K+ ATPase → osmotic, ionic, pH disruption
- Calcium influx → activates phospholipases and proteases → cell death
- Intracellular contents leak → activate systemic inflammation → microvascular injury
OXYGEN DELIVERY (DO2) - THE KEY EQUATION
- CO = cardiac output (HR × SV)
- CaO2 = arterial oxygen content = (Hgb × 1.34 × SaO2) + (0.003 × PaO2)
- Heart rate
- Stroke volume (preload, contractility, afterload)
- Hemoglobin concentration
- Oxygen saturation
CLASSIFICATION OF SHOCK - THE FOUR TYPES
1. Distributive Shock
- Problem: Maldistribution of blood flow - vasodilation
- CO is normal or HIGH (hyperdynamic), SVR is LOW
- Despite adequate/increased cardiac output, cells are hypoperfused due to abnormal microvascular distribution
- Causes: Septic shock (most common), anaphylaxis, neurogenic shock (spinal injury), adrenal crisis
2. Cardiogenic Shock
- Problem: Pump failure - heart cannot generate adequate CO
- CO is LOW, SVR is HIGH (compensatory)
- PCWP (wedge) is HIGH
- Causes: MI, decompensated heart failure, myocarditis, arrhythmia, mechanical complications
3. Hypovolemic Shock
- Problem: Inadequate circulating volume
- CO is LOW (low preload), SVR is HIGH
- PCWP is LOW
- Causes:
- Hemorrhagic: trauma, GI bleed, ruptured aneurysm
- Non-hemorrhagic: severe dehydration, burns, third-spacing
4. Obstructive Shock
- Problem: Obstruction to blood flow
- CO is LOW despite normal/increased pump function
- Causes: Massive PE, tension pneumothorax, cardiac tamponade, severe aortic stenosis
HEMODYNAMIC PROFILES OF SHOCK
| Type | CO/CI | CVP/PCWP | SVR | SvO2 |
|---|---|---|---|---|
| Distributive | ↑ | ↓ or N | ↓↓ | ↑ |
| Cardiogenic | ↓ | ↑ | ↑ | ↓ |
| Hypovolemic | ↓ | ↓ | ↑ | ↓ |
| Obstructive | ↓ | ↑ (variable) | ↑ | ↓ |
CLINICAL ASSESSMENT OF SHOCK
History and Physical
- Skin: Cold/clammy (cardiogenic/hypovolemic) vs. warm/flushed (distributive early)
- BP: SBP <90 or MAP <65 mmHg (but shock can exist with normal BP)
- HR: Tachycardia (may be absent with beta-blockers or in neurogenic shock)
- Urine output: <0.5 mL/kg/h = oliguria = end-organ hypoperfusion
- Mentation: Altered consciousness from cerebral hypoperfusion
- JVP: Elevated in cardiogenic/obstructive; flat in hypovolemic/distributive
Diagnostic Tests
- Lactate: Best marker of tissue hypoperfusion; >2 mmol/L elevated; >4 = severe; correlates with mortality
- ABG: Metabolic acidosis with elevated anion gap, low bicarb
- CBC, BMP, LFTs, coags: Multi-organ dysfunction assessment
- Troponin: Cardiogenic shock, but also elevated in septic shock
- Echo (bedside point-of-care):
- Assesses LV/RV function
- Pericardial effusion (tamponade)
- IVC collapsibility (volume responsiveness)
- Wall motion abnormalities
- CXR: Pulmonary edema (cardiogenic), air (pneumothorax), wide mediastinum
TREATMENT PRINCIPLES
1. Airway and Breathing
- Supplemental O2 - target SpO2 ≥92%
- Early intubation if unable to maintain airway/oxygenation
- Note: intubation itself can worsen shock (vasodilation from sedatives, loss of sympathetic drive)
2. Fluid Resuscitation
- Crystalloids first: Balanced crystalloids (LR or PlasmaLyte) preferred over NS (reduces hyperchloremic acidosis)
- 30 mL/kg IV bolus initial resuscitation in sepsis
- Assess fluid responsiveness:
- Passive leg raise (PLR): raises CO by ~10% = fluid responsive
- Pulse pressure variation (PPV): >13% with mechanical ventilation = fluid responsive
- IVC collapsibility on ultrasound
3. Vasopressors
- Alpha-1 agonist (vasoconstriction) + beta-1 (mild inotropy)
- Target MAP ≥65 mmHg
- Non-adrenergic vasoconstriction
- 0.03-0.04 units/min (avoid higher doses - mesenteric/cardiac ischemia)
- VASST trial: may reduce NE requirements; benefit in less severe sepsis
CHAPTER 315 - SEPSIS AND SEPTIC SHOCK
DEFINITIONS - EVOLUTION OVER TIME
| Term | Definition |
|---|---|
| Sepsis-1 (1992) | Infection + ≥2 SIRS criteria |
| Severe Sepsis | Sepsis + organ dysfunction (abandoned) |
| Septic Shock (old) | Sepsis + SBP <90 despite fluids |
| Sepsis-3 (2016 - CURRENT) | Life-threatening organ dysfunction caused by dysregulated host response to infection |
| Septic Shock (Sepsis-3) | Sepsis + vasopressors needed to maintain MAP ≥65 + lactate >2 mmol/L despite adequate resuscitation |
- Low specificity (any physiologic stress can cause SIRS)
- Does not capture the unique biology of organ dysfunction
EPIDEMIOLOGY
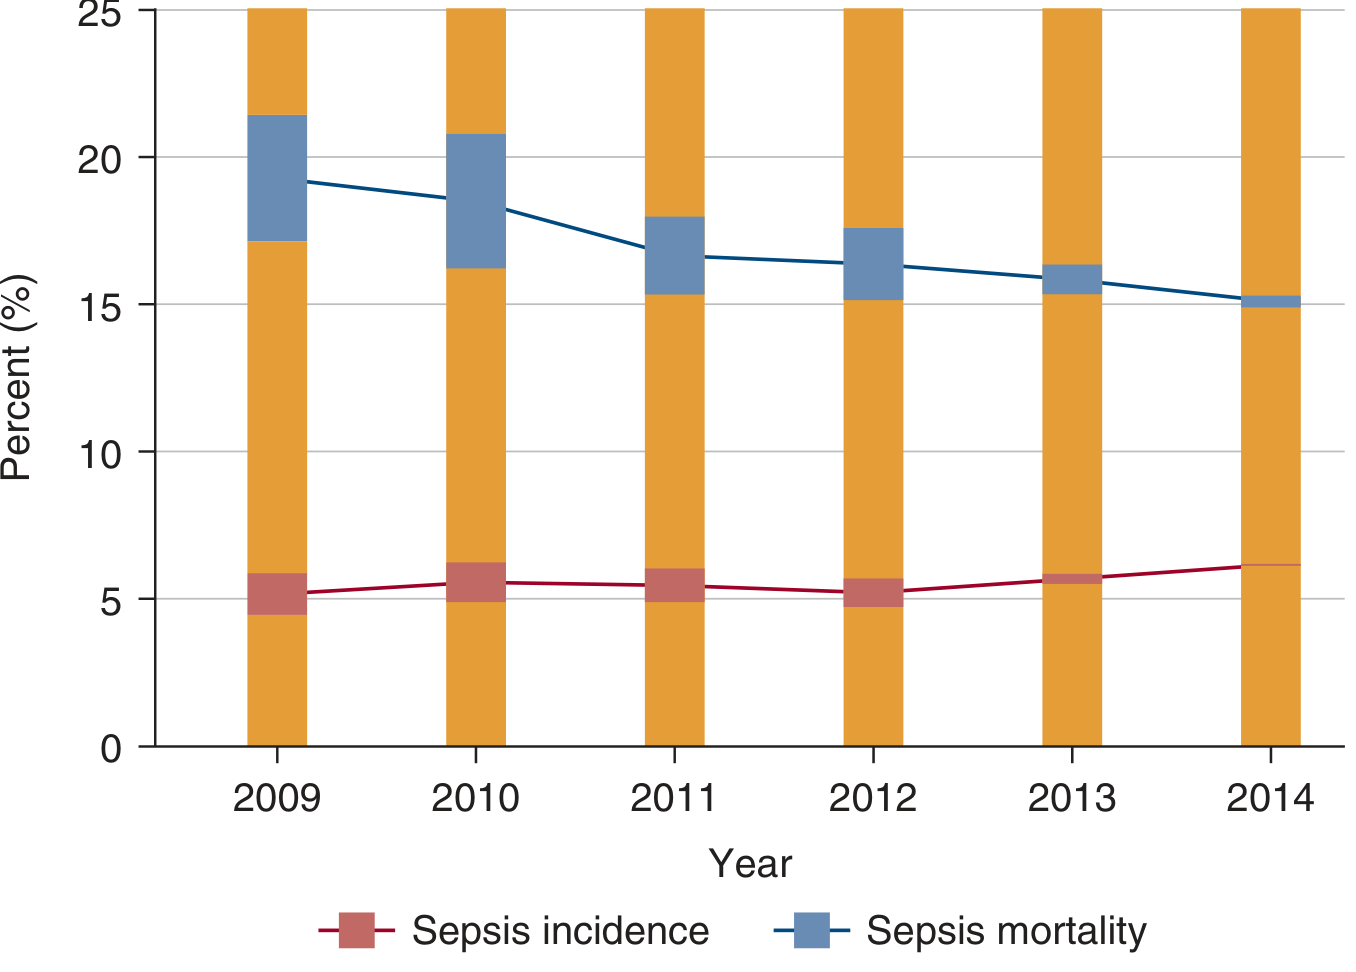
- ~88% community-onset (within 48h of admission); ~12% hospital-onset
- Most common organisms: S. aureus, Streptococcus, E. coli, Klebsiella, Pseudomonas
- Most common sites: Urinary tract (49%) > Respiratory (33%) > Intraabdominal (14%) > Skin/soft tissue (10%)
PATHOPHYSIOLOGY OF SEPSIS
Innate Immune Activation
- PAMPs (Pathogen-Associated Molecular Patterns): LPS from gram-negative bacteria, peptidoglycan, flagellin
- DAMPs (Damage-Associated Molecular Patterns): HMGB1, mitochondrial DNA from injured host cells
- Recognized by TLRs (Toll-Like Receptors) on macrophages, monocytes, neutrophils
Pro-Inflammatory Response
- TNF-α, IL-1β, IL-6, IL-8 release
- Neutrophil activation and endothelial adhesion
- Complement activation
- Coagulation cascade activation → DIC
- Endothelial dysfunction → capillary leak → edema
Anti-Inflammatory / Immunosuppressive Response (CARS)
- Concurrent with pro-inflammation
- Treg expansion, T-cell exhaustion/apoptosis
- Anti-inflammatory cytokines (IL-10, IL-4)
- Immunosuppression → susceptibility to secondary infections (especially nosocomial)
- Late-phase sepsis deaths from immunosuppression, not hyperinflammation
Microvascular Dysfunction
- Capillary leak → interstitial edema
- Maldistribution of blood flow (some beds vasoconstricted, others vasodilated)
- Endothelial activation → expression of adhesion molecules
- Mitochondrial dysfunction → impaired oxygen utilization
Coagulopathy in Sepsis
- Activation of extrinsic coagulation pathway
- Widespread fibrin deposition → microvascular thrombosis
- Consumption of clotting factors and platelets → DIC
- Ischemic injury to kidneys, liver, adrenals, brain
CLINICAL FEATURES
- Fever, tachycardia, tachypnea
- Warm, flushed skin (vasodilation)
- Widened pulse pressure
- Bounding pulses
- CO elevated
- Hypotension, cool extremities
- Mottling, cyanosis
- Altered consciousness
- Oliguria
- Evidence of organ failure
- Lungs: ARDS, hypoxemia
- Kidneys: AKI (creatinine, oliguria)
- Liver: Elevated bilirubin, transaminases
- Coagulation: Thrombocytopenia, elevated PT/INR - DIC
- CNS: Encephalopathy (delirium, altered consciousness)
- Adrenals: Relative adrenal insufficiency
MANAGEMENT - THE SEPSIS BUNDLE (Surviving Sepsis Campaign)
Hour-1 Bundle (Immediate Actions):
- Measure lactate - repeat if initial >2 mmol/L
- Blood cultures x2 sets before antibiotics (but do not delay antibiotics >45 min)
- Broad-spectrum antibiotics - within 1 hour of recognition
- IV crystalloid 30 mL/kg if MAP <65 or lactate ≥4 mmol/L
- Vasopressors (norepinephrine) if MAP <65 despite fluids
Antibiotic Principles:
- Start broad, then de-escalate based on cultures
- Common choices: Pip-tazo ± vancomycin; carbapenems for resistant organisms
- Duration: typically 5-7 days; 7-10 for bacteremia
- Procalcitonin-guided de-escalation reduces antibiotic duration
Vasopressors:
- Norepinephrine: first-line
- Vasopressin 0.03 units/min: add when NE >0.25 mcg/kg/min
- Angiotensin II (Giapreza): FDA-approved add-on for refractory vasodilatory shock
- Hydrocortisone 200 mg/day: use if refractory to NE + vasopressin
Source Control:
- Remove infected foreign bodies (lines, catheters, implants)
- Drain abscesses (percutaneous or surgical)
- Resect infected/necrotic tissue (e.g., cholecystectomy, Fournier's)
Corticosteroids in Septic Shock:
- ADRENAL trial: Hydrocortisone accelerated resolution of shock, reduced vasopressor days, but no 90-day mortality benefit
- APROCCHSS trial: Hydrocortisone + fludrocortisone reduced 90-day mortality
- Current recommendation: use hydrocortisone 200 mg/day (continuous or divided) if septic shock refractory to vasopressors
SURVIVING SEPSIS LONG-TERM
- Post-sepsis syndrome: cognitive impairment, PTSD, weakness, recurrent infections
- 1-year mortality after sepsis hospitalization remains ~50% (from comorbidities)
- Increased risk of subsequent infection and cardiovascular events
CHAPTER 316 - CARDIOGENIC SHOCK AND PULMONARY ARTERY RUPTURE (PARMAR)
CARDIOGENIC SHOCK
- SBP <90 mmHg for ≥30 minutes (or requires vasopressors)
- CI (cardiac index) <2.2 L/min/m²
- PCWP (wedge pressure) >18 mmHg (congested)
CLASSIFICATION - SCAI SHOCK STAGES
| Stage | Description | Mortality |
|---|---|---|
| A | At risk (AMI, CHF - no shock yet) | Low |
| B | Beginning - relative hypotension/tachycardia | ~20% |
| C | Classic cardiogenic shock (requires intervention) | ~35-45% |
| D | Deteriorating/Doom (failing interventions) | ~50-60% |
| E | Extremis (cardiac arrest, CPR ongoing) | >60% |
CAUSES OF CARDIOGENIC SHOCK
- Acute MI - most common (40% of cardiogenic shock)
- LV failure from large infarct (usually anterior MI, >40% LV mass lost)
- Mechanical complications:
- Acute MR: papillary muscle rupture (postero-medial > anterolateral, 2-7 days post-MI)
- VSD: septal rupture (anterior MI - apical; inferior MI - posterior, 2-7 days post-MI)
- Free wall rupture: 1-5 days post-MI; typically fatal from tamponade
- RV infarction: inferior MI with RV involvement
- Decompensated chronic heart failure (HFrEF)
- Myocarditis (fulminant)
- Takotsubo (stress) cardiomyopathy
- Arrhythmias (VT/VF, complete heart block, rapid AF)
- End-stage valvular disease
- Massive pulmonary embolism (right heart failure)
PATHOPHYSIOLOGY - THE CARDIOGENIC SHOCK SPIRAL
- ↑ PCWP → pulmonary congestion → hypoxemia → ↓ O2 supply → more ischemia
DIAGNOSIS
- ECG: ST elevation/depression, new LBBB, arrhythmias
- Echocardiography (KEY):
- Wall motion abnormalities
- LV/RV systolic function
- Valvular pathology (MR, VSD)
- Pericardial effusion
- Coronary angiography: essential if ischemic etiology suspected
- PA Catheter (Swan-Ganz): confirm low CO, high PCWP, high SVR
- Labs: Troponin, BNP/proBNP, lactate, LFTs
MANAGEMENT
Revascularization (for AMI-CS)
- Emergent PCI: First-line for AMI-cardiogenic shock - SHOCK trial showed survival benefit
- Do NOT perform PCI of all non-culprit vessels acutely (CULPRIT-SHOCK trial)
- CABG for multi-vessel disease after stabilization (or if PCI not feasible)
Pharmacologic Support
- Dobutamine: Inotrope of choice (β1 agonist) - increases CO; may worsen hypotension
- Norepinephrine: Vasopressor to maintain MAP (preferred over dopamine per SOAP-II trial)
- Epinephrine: Combined inotrope/vasopressor
- Milrinone: PDE inhibitor; inotrope + vasodilator (use carefully; may worsen hypotension)
- Avoid: Negative inotropes, diuretics in underfilled patients, aggressive diuresis initially
Mechanical Circulatory Support (MCS)
| Device | Mechanism | Support Level |
|---|---|---|
| IABP (Intra-aortic balloon pump) | Counterpulsation; ↑ coronary perfusion, ↓ afterload | Modest (~0.5 L/min) |
| Impella (2.5, CP, 5.0) | Axial-flow pump; LV unloading, forward flow | 2.5-5.0 L/min |
| TandemHeart | Centrifugal pump; LA→femoral artery | 3-4 L/min |
| VA-ECMO | Full cardiopulmonary bypass | 4-6 L/min (full support) |
- IABP-SHOCK II trial: IABP did NOT reduce 30-day mortality in AMI-CS - not routinely recommended anymore
- Impella increasingly used; RECOVER IV trial ongoing
- VA-ECMO: Reserved for most severe cases; concern for LV distension (may need concurrent Impella = "ECPella")
Surgical Options
- For mechanical complications: emergency surgery (MV repair, VSD repair, LV assist device)
- Cardiac transplantation: definitive therapy for refractory cardiogenic shock as bridge-to-transplant
CHAPTER 317 - CARDIOVASCULAR COLLAPSE, CARDIAC ARREST, AND SUDDEN CARDIAC DEATH
DEFINITIONS
| Term | Definition |
|---|---|
| Sudden Cardiac Death (SCD) | Unexpected death from cardiac cause within 1 hour of symptom onset |
| Cardiac Arrest | Cessation of effective cardiac output requiring CPR |
| Cardiovascular Collapse | Sudden loss of effective blood pressure/perfusion |
- ~450,000-500,000 deaths/year in the USA
- 80-85% caused by coronary artery disease
- Most frequently due to ventricular fibrillation (VF) or pulseless VT
CAUSES OF CARDIAC ARREST - THE H's AND T's
- Hypoxia
- Hypovolemia
- Hydrogen ion (acidosis)
- Hypo/Hyperkalemia
- Hypothermia
- Tension pneumothorax
- Tamponade (cardiac)
- Toxins (drugs, poisons)
- Thrombosis - pulmonary (PE)
- Thrombosis - coronary (MI)
CARDIAC ARREST RHYTHMS
- Ventricular Fibrillation (VF): Chaotic electrical activity - no coordinated contraction; shockable; most common in out-of-hospital arrest; most favorable prognosis if defibrillated rapidly
- Pulseless Ventricular Tachycardia (VT): Organized rapid ventricular activity but no effective output; shockable
- Pulseless Electrical Activity (PEA): Organized electrical activity but no mechanical contraction; non-shockable; causes = H's and T's
- Asystole: No electrical activity; non-shockable; worst prognosis
BASIC LIFE SUPPORT (BLS) AND ADVANCED CARDIAC LIFE SUPPORT (ACLS)
High-Quality CPR - The Foundation
- Compression rate: 100-120/min
- Compression depth: ≥5 cm (2 inches) in adults, <6 cm
- Full chest recoil: Allow complete chest recoil between compressions
- Minimize interruptions: <10 seconds for any interruption
- Avoid excessive ventilation: 30:2 ratio until advanced airway; then continuous compressions with 1 breath/6 seconds
- Dispatcher-assisted CPR: Improves bystander CPR rates
ACLS - Shockable Rhythms (VF/Pulseless VT)
- Recognition + Activation of EMS
- Immediate high-quality CPR
- Rapid defibrillation
- Advanced resuscitation (ACLS)
- Post-cardiac arrest care
- Recovery
- Defibrillation: Biphasic 120-200J; monophasic 360J. Shock FIRST in witnessed arrest.
- CPR 2 minutes → rhythm check → shock if still shockable → CPR 2 minutes
- Epinephrine 1 mg IV/IO q3-5 min (given as soon as IV access obtained)
- Amiodarone 300 mg IV bolus after 3rd shock (can repeat 150 mg); or Lidocaine 1-1.5 mg/kg
- After every 2-min CPR cycle: check rhythm and pulse
ACLS - Non-Shockable Rhythms (PEA/Asystole)
- CPR 2 minutes → check rhythm
- Epinephrine 1 mg IV q3-5 min
- Treat reversible causes (H's and T's)
- No role for atropine, sodium bicarbonate routinely
- Vasopressin was removed from guidelines (not superior to epinephrine)
POST-CARDIAC ARREST CARE
Targeted Temperature Management (TTM) / Therapeutic Hypothermia
- Indication: Comatose survivors of cardiac arrest (any rhythm)
- Target temperature: 32-36°C for 24 hours
- Mechanism: reduces cerebral metabolic demand, decreases excitotoxicity, free radical damage
- TTM2 trial (2021): 33°C vs. 37.5°C showed NO difference in mortality or neurological outcomes
- Current recommendation: prevent fever (>37.5°C) actively; mild hypothermia (33°C) still used at many centers
- Duration: 24h TTM → 24-48h gradual rewarming (avoid rapid rewarming)
Hemodynamic Optimization Post-Arrest
- Target MAP ≥65-70 mmHg
- Avoid hypotension: worsens neurological outcomes
- CULPRIT: Perform emergent coronary angiography if ST elevation or suspected ischemia
- Even without ST elevation: consider angiography within 24h if suspected cardiac etiology
Neuroprognostication
- Wait 72h after arrest (or after rewarming to normothermia) before prognostication
- Predictors of poor outcome (multimodal):
- Absent pupillary light reflexes at 72h
- Absent N20 peak on somatosensory evoked potentials (SSEP)
- EEG: burst suppression or isoelectric
- CT: diffuse cerebral edema (sulcal effacement, loss of gray-white differentiation)
- NSE (neuron-specific enolase) >60 µg/L at 48-72h
- No motor response (extension or absent) at 72h
Other Post-Arrest Management
- Treat underlying cause (PCI, PE thrombolysis, etc.)
- Avoid hypoxia (SpO2 94-98%) AND hyperoxia
- Avoid hypercapnia (target normocarbia)
- Glycemic control (140-180 mg/dL)
- Seizure treatment (can be subclinical post-arrest)
- ICD before discharge (survivors of VF/VT arrest without reversible cause)
PREVENTION OF SUDDEN CARDIAC DEATH
- EF ≤35% with HF (NYHA II-III) despite optimal medical therapy ≥3 months
- Certain genetic arrhythmia syndromes: Long QT, Brugada, ARVD, HCM
- All survivors of VF/VT cardiac arrest without reversible cause
- Sustained VT with structural heart disease
SECTION 3: NEUROLOGICAL CRITICAL CARE
CHAPTER 318 - NERVOUS SYSTEM DISORDERS IN CRITICAL CARE
INTRODUCTION
- Primary neurologic illness - stroke, TBI, SAH, encephalitis, status epilepticus
- Secondary neurologic complications of systemic illness - septic encephalopathy, anoxic brain injury post-arrest, metabolic encephalopathy
- Ischemia (hypotension, vasospasm)
- Hemorrhage extension
- Cerebral edema and herniation
- Elevated ICP
- Seizures
- Fever/hyperglycemia (increase metabolic demand)
- Hypoxia
PATHOPHYSIOLOGY
Brain Edema - Two Types
- Disruption of blood-brain barrier (BBB)
- Protein-rich fluid enters brain interstitium
- Seen in: tumors, abscesses, meningitis, severe hypertension, trauma
- Responds to corticosteroids (dexamethasone - reduces BBB permeability)
- Cellular swelling from ATP failure and membrane dysfunction
- Na+/K+ ATPase fails → Na and water enter cells
- Seen in: ischemic stroke, global hypoxia/ischemia
- Does NOT respond to corticosteroids
- Apparent diffusion coefficient (ADC) reduced on DWI-MRI
- Either type → ↑ ICP
- Focal processes → brain shifts, herniation
- Herniation = mechanical distortion and ischemia from impaired perfusion
Ischemic Cascade
- Excitatory amino acid (glutamate) release
- Ca²⁺ and Na⁺ influx (NMDA receptor activation)
- Protease and lipase activation
- Lipid peroxidation and free radical damage
- Cell membrane rupture → necrotic death
- Target of stroke reperfusion therapy (thrombolysis, thrombectomy)
- Worsened by: hypotension, hypoxia, fever, hyperglycemia, seizures
ELEVATED INTRACRANIAL PRESSURE (ICP)
- Target CPP: 50-70 mmHg in TBI
- If ICP ↑ → CPP ↓ → cerebral ischemia
- Compensated initially by cerebral autoregulation; fails at high ICP
HERNIATION SYNDROMES
| Syndrome | Structure Herniating | Signs |
|---|---|---|
| Uncal herniation | Temporal uncus through tentorial notch | Ipsilateral CN III palsy (dilated pupil) + contralateral hemiparesis |
| Central herniation | Diencephalon downward | Bilateral miosis → mydriasis, Cheyne-Stokes breathing |
| Tonsillar herniation | Cerebellar tonsils through foramen magnum | Respiratory arrest, death |
| Subfalcine | Cingulate gyrus under falx | ACA territory ischemia, leg weakness |
| Upward transtentorial | Cerebellum upward | Midbrain compression |
APPROACH TO ELEVATED ICP
- Head of bed at 30°
- Avoid neck flexion (impairs venous drainage)
- Adequate sedation/analgesia (cough/pain elevate ICP)
- Treat fever (antipyretics, cooling)
- Avoid hypercapnia (causes cerebrovascular dilation)
- Maintain normoglycemia
- Seizure prophylaxis (in appropriate patients)
- Hyperosmolar therapy:
- Mannitol 0.25-1.0 g/kg IV bolus (acts within 20 min; lasts 2-6h)
- Hypertonic saline (3% or 23.4%) - preferred by many (maintains euvolemia; avoids Mannitol's diuresis)
- Create osmotic gradient to draw water out of brain
- Target serum Na 145-155 mEq/L with HTS; serum osmolality 310-320 with Mannitol
- Hyperventilation (temporary): Reduce PaCO2 to 30-35 mmHg → vasoconstriction → ↓CBV → ↓ICP
- Effect within minutes; NOT sustained (cerebrovascular adaptation within 6-12h)
- Use only as bridge while definitive treatment arranged
- CSF drainage via EVD (extraventricular drain)
- Neuromuscular blockade (reduces patient effort/Valsalva)
- Decompressive craniectomy: Remove bone flap to allow brain expansion
- DECIMAL, HAMLET, DESTINY trials: reduces mortality in malignant MCA infarction
- Trade-off: may survive with severe disability
- Barbiturate coma (pentobarbital): Reduces CMR-O2; reduces ICP; monitor with EEG (burst-suppression target)
- Therapeutic hypothermia: Reduces cerebral metabolic rate
CRITICAL CARE DISORDERS OF THE CNS
Hypoxic-Ischemic Encephalopathy (HIE)
- Follows cardiac arrest, severe hypotension, respiratory failure
- Global cerebral ischemia → watershed and cortical necrosis
- Clinical spectrum: coma → seizures → vegetative state → brain death
- TTM used post-arrest (see Chapter 317)
- Neuroprognostication at 72h (multimodal)
Septic Encephalopathy
- Most common cause of altered consciousness in ICU
- Diffuse cerebral dysfunction from systemic sepsis (no direct CNS infection)
- Mechanisms: endotoxin crossing BBB, microabscesses, cerebral ischemia, toxic metabolites
- Usually reversible with treatment of underlying sepsis
- MRI: diffuse white matter changes, restricted diffusion in severe cases
- Treatment: treat sepsis; avoid benzodiazepines (worsen encephalopathy)
Metabolic Encephalopathies
- Hepatic encephalopathy: ammonia accumulation; asterixis; treat with lactulose, rifaximin; avoid sedatives
- Uremic encephalopathy: AKI/CKD; myoclonus; reverse with dialysis
- Hyponatremic encephalopathy: acute Na <120 mEq/L; cerebral edema; seizures; treat with HTS
- Hyperammonemia: ornithine transcarbamylase deficiency; dialysis + nitrogen scavengers
- Wernicke's encephalopathy: thiamine deficiency (alcoholics, malnutrition); THIAMINE BEFORE GLUCOSE; ataxia + confusion + ophthalmoplegia
Status Epilepticus (SE)
- Benzodiazepines (lorazepam 0.1 mg/kg IV or diazepam 5-10 mg IV) - first-line; within 5 min
- Fosphenytoin 20 mg PE/kg IV, or Levetiracetam 60 mg/kg IV, or Valproate 40 mg/kg IV - second-line; 20-40 min
- Anesthetic agents: Midazolam, propofol, pentobarbital infusion - refractory SE; continuous EEG monitoring required
- Non-convulsive SE (NCSE): EEG required to diagnose in comatose patients (no visible convulsions but ongoing ictal activity)
CRITICAL CARE DISORDERS OF THE PERIPHERAL NERVOUS SYSTEM
ICU-Acquired Weakness (ICU-AW)
- Develops in >25-50% of mechanically ventilated patients
- Two main subtypes:
- Critical Illness Polyneuropathy (CIP): axonal degeneration (sensorimotor neuropathy); failed weaning from vent
- Critical Illness Myopathy (CIM): muscle atrophy and necrosis; thick filament loss (myosin)
- Risk factors: sepsis, MODS, prolonged bed rest, corticosteroids, NMBAs, glucose dysregulation
- Diagnosis: EMG/NCS, CK (elevated in myopathy), muscle biopsy
- Treatment: early mobilization and physical therapy (most important); treat underlying illness
- Prognosis: full recovery in months in many; some have permanent deficits
Neuromuscular Transmission Disorders in ICU
- Prolonged NMB effect: after cisatracurium/vecuronium; especially with renal/hepatic failure
- Myasthenia crisis: acute respiratory failure from myasthenia; treat with plasmapheresis or IVIG + immunosuppression + avoid precipitating drugs
- Lambert-Eaton: paraneoplastic; presynaptic ACh release failure
Guillain-Barré Syndrome (GBS) in ICU
- Ascending demyelinating polyneuropathy
- Respiratory failure requiring ventilation in ~30%
- Treatment: IVIG 2g/kg over 5 days or plasmapheresis (equal efficacy); NOT steroids
- Monitor FVC and NIF (negative inspiratory force):
- Rule of 20-30: Intubate if FVC <20 mL/kg, NIF <-30 cmH2O, SpO2 <92%
- Autonomic instability: BP swings, arrhythmias - avoid anticholinergics
BRAIN DEATH
- Hypothermia (temp <36°C)
- Drug intoxication/overdose
- Severe metabolic derangements
- Hypotension
- Coma - no response to pain
- Absent brainstem reflexes:
- No pupillary light reflex (fixed, dilated)
- No corneal reflex
- No oculocephalic reflex (doll's eyes)
- No oculovestibular reflex (caloric testing)
- No gag/cough reflex
- No facial motor response to painful stimuli
- Apnea test: No breathing drive with PaCO2 >60 mmHg (rise ≥20 mmHg from baseline)
- EEG: isoelectric (electrocerebral silence)
- Cerebral blood flow study (radionuclide scan, CT angiography, TCD)
- SSEP: absent N20 bilaterally
DELIRIUM IN THE ICU
- Prevalence: 60-80% of mechanically ventilated ICU patients
- Strong predictor of prolonged LOS, increased mortality, long-term cognitive impairment
- Risk factors: ABCDEF bundle violations, benzodiazepines, immobility, sleep deprivation, sensory deprivation
Types of Delirium:
- Hyperactive: Agitated, pulling at lines (15%)
- Hypoactive: Quiet, withdrawn (50%) - most missed
- Mixed: Both features (35%)
Assessment Tool - CAM-ICU (Confusion Assessment Method for ICU):
- Acute change in mental status or fluctuating course
- Inattention (attention screening test)
- Altered level of consciousness (RASS not 0)
- Disorganized thinking
The ABCDEF Bundle (Prevention and Management):
- Awaken (daily SAT - Spontaneous Awakening Trials)
- Breathing (daily SBT)
- Choice of analgesia/sedation (minimize benzos; prefer propofol or dexmedetomidine)
- Delirium assess and manage
- Early mobility and exercise
- Family engagement
- Haloperidol: Still commonly used but HOPE-ICU trial showed no mortality benefit; use for patient safety
- Quetiapine or olanzapine: alternatives
- Dexmedetomidine: Reduces delirium duration (alpha-2 agonist; allows rousable sedation)
- Avoid benzodiazepines (worsens delirium - use only for alcohol withdrawal/seizures)
QUICK-REFERENCE SUMMARY TABLE
| Chapter | Core Concept | Key Numbers to Know |
|---|---|---|
| 311 | ICU Scoring & Monitoring | SOFA ≥2 = sepsis; qSOFA ≥2 = high risk; glucose 140-180 |
| 312 - ARDS | Berlin criteria, lung protection | TV 6 mL/kg IBW; Pplat ≤30; PaO2/FiO2 <200 = mod; <100 = severe |
| 313 - Ventilation | Modes, weaning, NIV | RSBI <105 = wean; SBT 30-120 min; PEEP titrated to FiO2 |
| 314 - Shock | 4 types + hemodynamic profiles | DO2=CO×CaO2; Lactate >4 = severe; MAP target ≥65 |
| 315 - Sepsis | Sepsis-3 definitions, 1-hr bundle | Lactate; cultures; abx; 30mL/kg fluids; vasopressors if MAP <65 |
| 316 - CS | SCAI stages, MCS devices | SCAI A→E; IABP not effective; Impella for severe CS |
| 317 - Arrest | BLS/ACLS, TTM, neuroprognostication | CPR 100-120/min; Epi 1mg q3-5min; TTM 32-36°C × 24h |
| 318 - Neuro ICU | ICP, herniation, ICU-AW, delirium | CPP = MAP-ICP; target CPP 50-70; CAM-ICU for delirium; ABCDEF bundle |