
Tympanometry compliance values
tympanometry compliance curve types A B C
This figure presents Atomic Force Microscopy (AFM) analysis of Streptomyces coelicolor hyphae, comparing mechanical properties between wild-type (M145) and filP deletion (ΔfilP) strains. Panels A and B display AFM topological images of live hyphae. In the ΔfilP strain (A), hyphae show significant structural deformation and height profile irregularities, whereas wild-type hyphae (B) maintain a uniform, symmetrical cylindrical shape. Panel C provides a stiffness map of a wild-type hyphal tip, reconstructed from an 80 x 80 array of force curves, where greyscale pixels indicate compliance (m/N). Panel D contains representative force-separation curves (Force in nN vs. Separation in µm). The wild-type curve shows a steep slope with overlapping approach and retract lines, indicating high stiffness and purely elastic deformation. Conversely, the ΔfilP strain displays a shallower slope (higher compliance) and a distinct hysteresis loop between the load and unload curves, signifying viscoelastic behavior and delayed elastic recovery. This research demonstrates the role of the intermediate filament-like protein FilP in maintaining the structural rigidity and mechanical integrity of bacterial cell walls.
This composite educational graphic illustrates the biomechanical characteristics of the internal jugular vein (IJV) under varying physiological conditions. Panels A and C display B-mode ultrasound images in short-axis cross-sections. In Panel A, IJV compliance is demonstrated by comparing the supine position to 16-degree head elevation at a constant force of 3.00 N; blue outlines indicate a patent vessel, while a magenta dot signifies near-collapse due to decreased hydrostatic pressure. Panel C shows the effect of the Valsalva maneuver; as airway pressure increases from normal breathing to 20 mmHg, the IJV cross-sectional area expands significantly despite high probe forces (~6.7 N), highlighting increased venous pressure. Panels B and D provide scatter plots correlating 'Supine Collapse Force' (CF) with the change in force required for collapse during elevation and Valsalva, respectively. Panel E is a multi-subject bar graph summarizing individual variations in collapse force across three states: Valsalva (highest force required), supine (intermediate), and 16-degree elevation (lowest), serving as a diagnostic tool for evaluating central venous pressure non-invasively.
This diagnostic image consists of four standing lateral full-spine radiographs (A-D) illustrating the Roussouly classification of sagittal spinal alignment. Each panel demonstrates varying degrees of thoracic kyphosis, lumbar lordosis (LL), and sacral slope (SS). Panel A (Type I) shows a low sacral slope (<35°), a long thoracic kyphosis, and a short, minimal lumbar lordosis arc. Panel B (Type II) displays a low sacral slope and a relatively flat, elongated lumbar profile. Panel C (Type III) represents a 'harmonious' spine with a moderate sacral slope (35°-45°) and well-balanced curves. Panel D (Type IV) features a high sacral slope (>45°) associated with a pronounced, hyperlordotic lumbar curve and a shorter thoracic kyphosis. These radiographic types are used in orthopedic surgery and physiatry to evaluate spino-pelvic parameters, postural variations, and degenerative patterns in the sagittal plane. Key visible landmarks include the cervical, thoracic, and lumbar vertebrae, as well as the sacrum and pelvis, used to measure pelvic incidence, pelvic tilt, and the sagittal vertical axis.
This composite educational graphic illustrates microbiological complementation experiments investigating peptidoglycan (PG) biogenesis in Escherichia coli. Panel A displays a summary table showing that only wild-type Wzk, an ABC transporter flippase, successfully complements the loss of the essential flippase MurJ, while the ATPase-deficient Walker B mutant (E525A) fails. Panel B shows a bacterial growth curve (OD600 versus time) for E. coli ΔmurJ cells complemented with Wzk, reaching a maximum density of approximately 1.5 over 25 hours, indicating partial functional recovery. Panel C contains 100X phase-contrast microscopy images comparing cellular morphology. Cells expressing both MurJ and Wzk (MurJ+ Wzk+) show typical uniform rod shapes. In contrast, ΔmurJ cells complemented only by Wzk (Wzk+ panels) demonstrate significant morphological aberrations characteristic of PG biosynthetic defects, including increased cell size, irregular filamentation, and cellular lysis marked by white arrowheads. These visuals demonstrate the functional role and limitations of Wzk as a surrogate lipid II flippase in maintaining bacterial cell wall integrity.
Tympanometry: Compliance Values
Normative Compliance Values
| Age Group | Static Admittance (mL) | Tympanometric Width (daPa) | EAC Volume (mL) |
|---|---|---|---|
| Children (3-10 yr) | 0.25 - 1.05 | 80 - 160 | 0.3 - 0.9 |
| Adults (>18 yr) | 0.3 - 1.7 | 50 - 114 | 0.9 - 2.0 |
Note: For infants under 6 months, a 1000 Hz probe tone (rather than the standard 226 Hz) is used because the external ear canal compliance is higher and standard tympanometry is unreliable. - Cummings Otolaryngology, p. 3766
Jerger Classification of Tympanogram Types
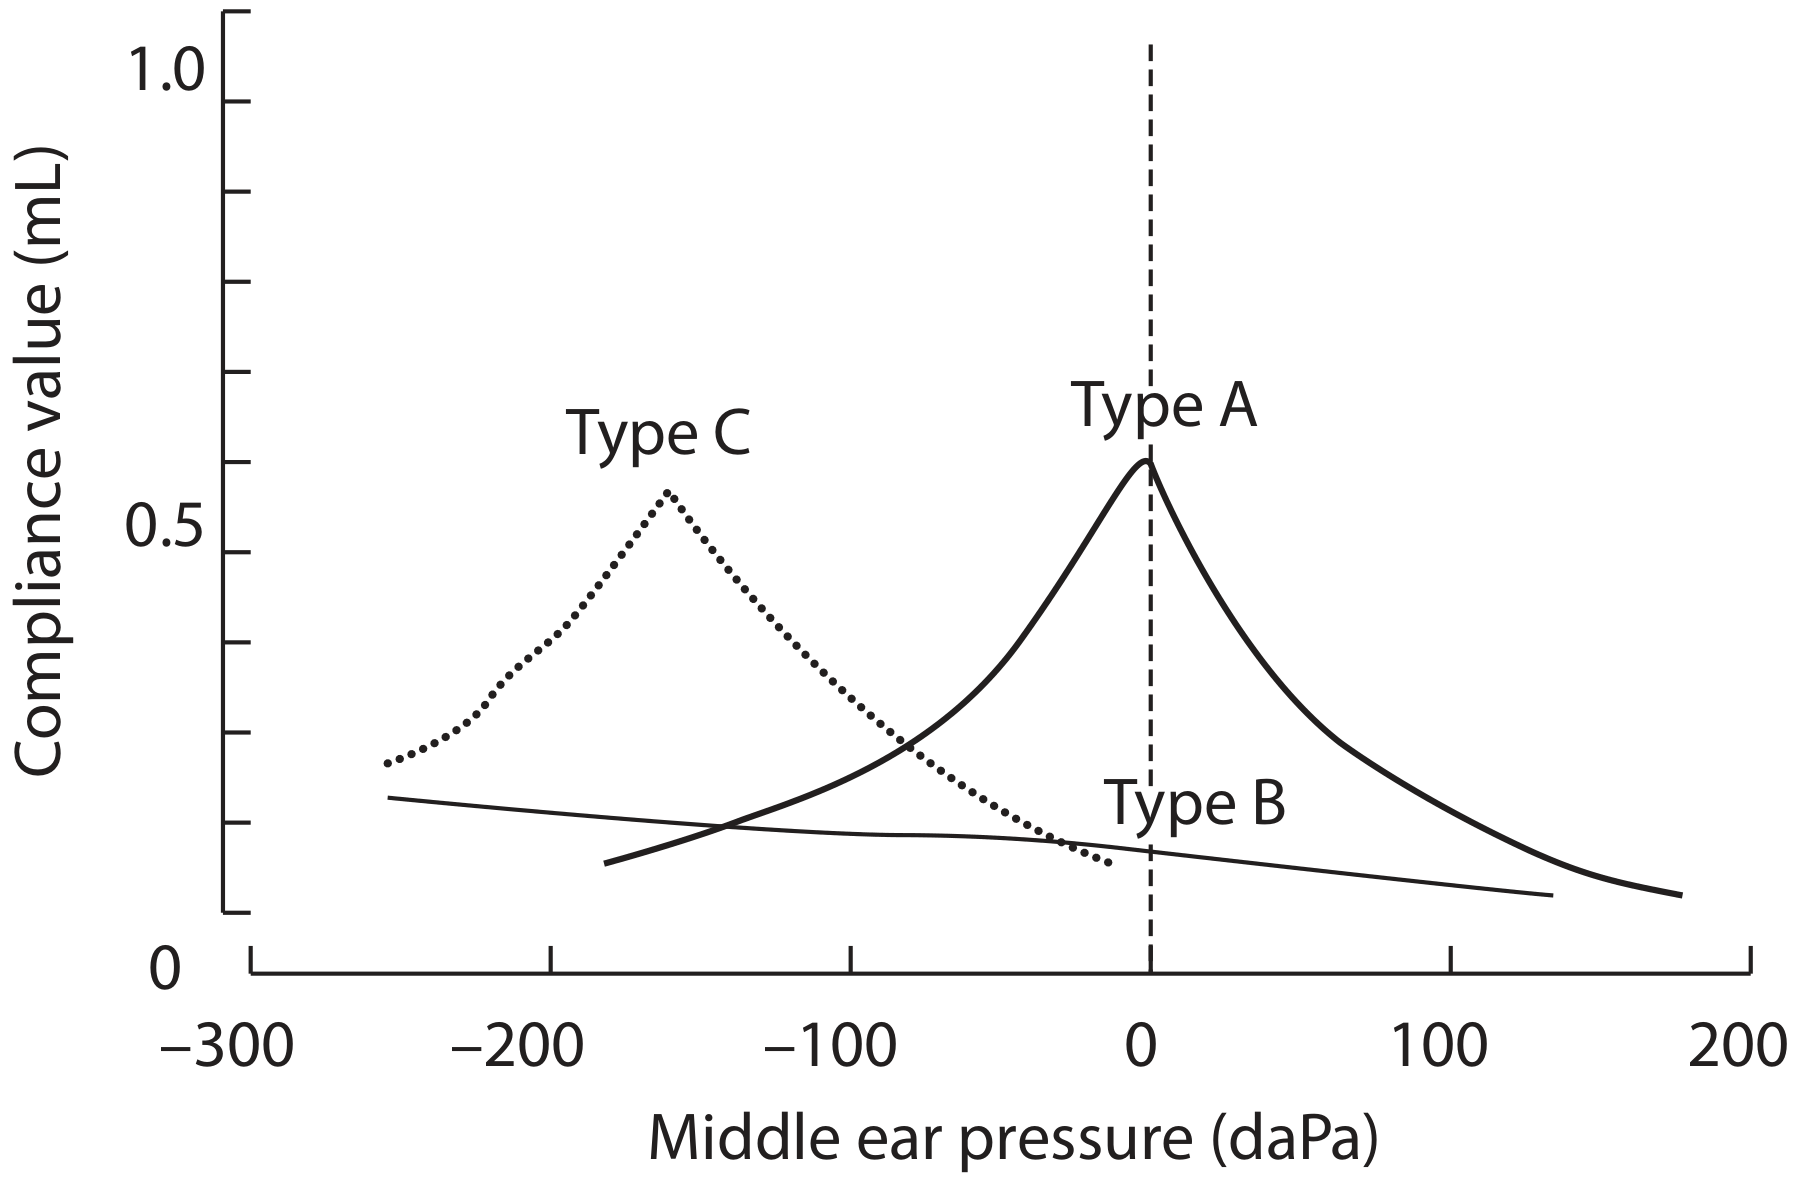
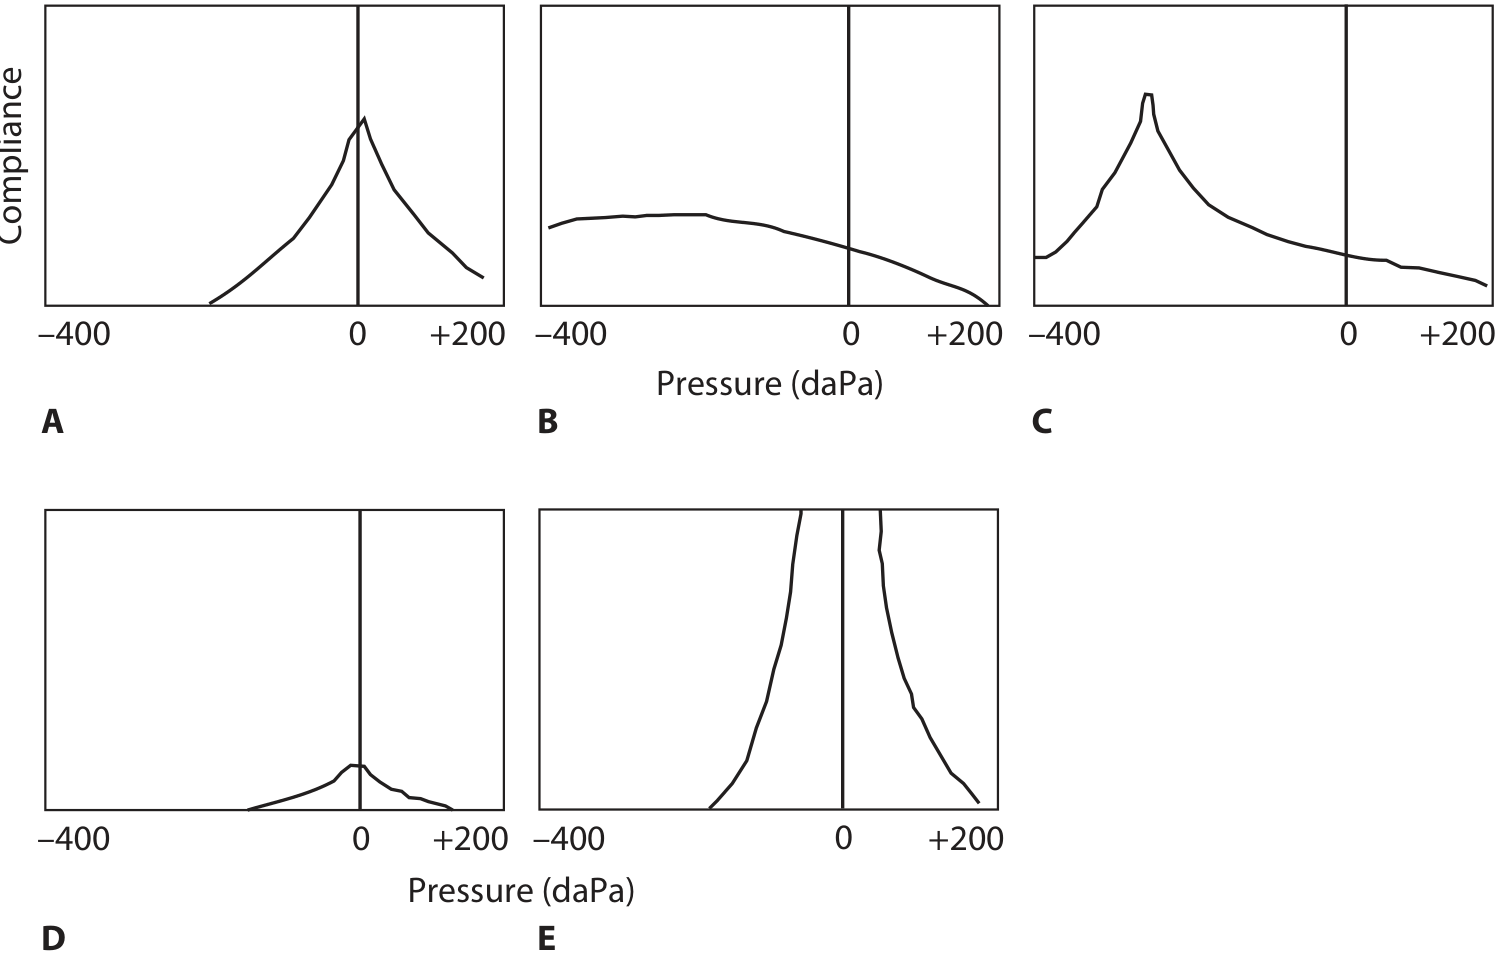
Type A - Normal
- Compliance: Normal range (0.3-1.7 mL in adults)
- Peak pressure: -100 to +100 daPa (adults); -150 to +100 daPa (children)
- Interpretation: Normal middle ear function, normal TM mobility
Type As (A-shallow) - Low Compliance
- Compliance: Abnormally low / shallow peak (below 0.3 mL)
- Interpretation: Restricted mobility - seen in otosclerosis, tympanosclerosis, fixation of the malleus, scarred TM
- Note: Compliance in otosclerosis is less than normal but the range overlaps significantly, limiting diagnostic use - Scott-Brown's, Vol 2
Type Ad (A-deep) - High Compliance
- Compliance: Abnormally high / deep peak (above 1.7 mL)
- Interpretation: Hypercompliant / "loose" system - seen in ossicular chain discontinuity, flaccid TM
- Clinical note: In ossicular disarticulation, there is often a significant conductive hearing loss that is worse at high frequencies (unlike most conductive losses). With a flaccid TM only, hearing may be near normal.
Type B - Flat (No Peak)
- Compliance: No discernible peak across the full pressure sweep (-400 to +200 daPa)
- EAC volume interpretation:
- Normal volume (0.3-0.9 mL in children) → Otitis media with effusion (OME)
- High volume (1-5.5 mL) → TM perforation or patent tympanostomy tube
- Very low volume → probe occluded or against canal wall
- Sensitivity for OME at myringotomy: 56-73%; specificity 50-98% - Scott-Brown's Otorhinolaryngology, Vol 2
Type C - Negative Pressure
- Peak pressure: More negative than -100 daPa (adults) or -150 daPa (children)
- Compliance: Normal height but shifted into negative pressure zone
- Subdivided as:
- C1: Peak between -100 and -199 daPa
- C2: Peak between -200 and -399 daPa
- Interpretation: Eustachian tube dysfunction, retracted TM. Type C2 has higher association with OME than C1.
Tympanometric Width (TW) / Gradient
- Narrower = sharper peak = better compliance (normal)
- Wider = flatter curve = poorer compliance (abnormal)
- Normal adults: 50-114 daPa; Children 3-10 yr: 80-160 daPa
EAC Volume Reference
| Situation | EAC Volume |
|---|---|
| Normal children | 0.3-0.9 mL |
| Normal adults | 0.9-2.0 mL |
| Perforation / patent grommet | Elevated (1-5.5 mL) |
| Probe occluded / against wall | Very low (<0.3 mL) |
- Cummings Otolaryngology, p. 3766; K.J. Lee's Essential Otolaryngology, p. 305