
Child sepsis
"pediatric sepsis"[MeSH Terms] AND management
pediatric sepsis management algorithm flowchart
Summary : This flowchart presents an algorithm for the management of children with membranous nephropathy (MN), outlining diagnostic steps, treatment peculiarities, exclusion of secondary causes, and recommendations for expert center referral. flowchart: # Nodes : • Start (rectangle): "No evidence to guide management in children with MN" • Step 1 (rounded rectangle): "Perform a kidney biopsy" • Step 2 (rounded rectangle): "Treatment peculiarities in children vs adults" – Bullets within node: • Wait-and-see strategy with supportive therapy alone is usually not adopted in children • Children with MN are usually treated with prednisone for at least 8–12 weeks at doses used for idiopathic nephrotic syndrome • Rituximab or calcineurin inhibitors are also employed at standard doses • Step 3 (rounded rectangle): "Exclude secondary forms (most frequently systemic lupus erythematosus or chronic HBV, rarely neoplasia)" – Bullets within node: • If possible, measure PLA2Rab and THSD7Aab titers • If positive, their titers can be used to confirm remission and predict relapse • If negative, especially in children aged <6 years, consider role of immune response to cationic bovine serum albumin • End (rounded rectangle): "Children with MN should be treated in an expert center" # Connectors : • Downward arrows connect each node sequentially from "No evidence..." to "Perform a kidney biopsy", then to "Treatment peculiarities...", then to "Exclude secondary forms...", and finally to "Children with MN should be treated in an expert center". • No branching or decision diamonds; all steps are linear. # Layout : • Vertically stacked nodes, each in a rounded rectangle except the initial node ("No evidence...") which is a standard rectangle. • Bulleted lists within two nodes provide detailed guidance. • Flow proceeds top-to-bottom without branches. # Analysis : • The algorithm is linear, emphasizing a stepwise approach: begin with biopsy, tailor treatment for children, exclude secondary causes, and refer to expert centers. • The chart highlights differences in pediatric management (no wait-and-see, use of prednisone, consideration of immune response in young children). • Measurement of PLA2Rab and THSD7Aab titers is suggested for diagnosis and monitoring. • The absence of evidence for management is explicitly noted, underscoring the need for expert involvement.
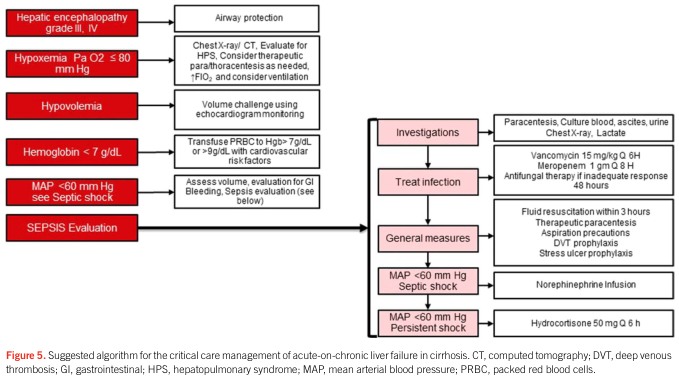
Summary : This figure presents a suggested algorithm for the critical care management of acute-on-chronic liver failure in cirrhosis, outlining stepwise assessment and interventions for various clinical scenarios including hepatic encephalopathy, hypoxemia, hypovolemia, anemia, and septic shock, with specific recommendations for investigations, infection treatment, and general supportive measures. flowchart: # Nodes : • Hepatic encephalopathy grade III, IV (rectangle, red) • Hypoxemia Pa O2 ≤ 80 mm Hg (rectangle, red) • Hypovolemia (rectangle, red) • Hemoglobin < 7 g/dL (rectangle, red) • MAP < 60 mm Hg see Septic shock (rectangle, red) • SEPSIS Evaluation (rectangle, red) • Airway protection (rectangle, white) • Chest X-ray/CT. Evaluate for HPS, Consider therapeutic para/thoracentesis as needed, ↑FiO2, and consider ventilation (rectangle, white) • Volume challenge using echocardiogram monitoring (rectangle, white) • Transfuse PRBC to Hgb > 7g/dL or > 9g/dL with cardiovascular risk factors (rectangle, white) • Assess volume, evaluation for GI Bleeding, Sepsis evaluation (rectangle, white) • Investigations (rectangle, pink) • Paracentesis, Culture blood, ascites, urine, Chest X-ray, Lactate (rectangle, white) • Treat infection (rectangle, pink) • Vancomycin 15 mg/kg Q 6H, Meropenem 1 gm Q 8H, Antifungal therapy if inadequate response 48 hours (rectangle, white) • General measures (rectangle, pink) • Fluid resuscitation within 3 hours, Therapeutic paracentesis, Aspiration precautions, DVT prophylaxis, Stress ulcer prophylaxis (rectangle, white) • MAP < 60 mm Hg Septic shock (rectangle, pink) • Norepinephrine Infusion (rectangle, white) • MAP < 60 mm Hg Persistent shock (rectangle, pink) • Hydrocortisone 50 mg Q 6 h (rectangle, white) # Connectors : • Each red rectangle (clinical scenario) connects rightward to a specific white rectangle (intervention or assessment). • SEPSIS Evaluation leads to a vertical sequence of pink rectangles: Investigations → Treat infection → General measures → MAP < 60 mm Hg Septic shock → MAP < 60 mm Hg Persistent shock. • Each pink rectangle is followed by a white rectangle detailing specific actions. • The flow is primarily left-to-right for initial assessment, then top-to-bottom for sepsis management. # Layout : • The diagram is organized in three main vertical columns: – Left: Red rectangles for initial clinical findings. – Middle: White rectangles for immediate interventions. – Right: Pink rectangles for sepsis evaluation and management, with white rectangles for detailed steps. • The sepsis management column is a vertical sequence, with each step leading to the next. # Analysis : • The algorithm provides a structured, stepwise approach for managing acute-on-chronic liver failure in cirrhosis, prioritizing airway protection, oxygenation, volume status, anemia correction, and sepsis evaluation. • Sepsis management is detailed, with specific recommendations for investigations, antimicrobial therapy, supportive measures, and escalation to vasopressors and steroids for persistent shock. • The flowchart emphasizes early identification and targeted intervention for each critical issue, integrating both general and specific measures for optimal patient care.
Summary : This flowchart provides a comprehensive management algorithm for adults with atopic dermatitis, detailing baseline management, topical therapies, phototherapy, and systemic therapies, including FDA-approved and recommended treatments, maintenance strategies, and escalation steps for inadequate control. flowchart: # Baseline Management : • Severity Assessment: Assessment of signs of disease, severity of symptoms, comorbidities, and impact on quality of life (QOL). • Exacerbating Factor Avoidance: Identify trigger factors (allergens, irritants, etc.) and counsel patients on avoidance. • Baseline Therapy: Moisturizers/Emollients (strong recommendation), Bathing Practices (conditional recommendation). # Initial Pathways : • Mild to Severe: Proceed to Topical Therapies. • Moderate to Severe: Proceed to Phototherapy & Systemic Therapy. # Topical Therapies : ## Optimized Topical Therapy for Inflamed Areas : • TCS (Topical corticosteroids) (FDA, strong recommendation) • TCIs (Topical calcineurin inhibitors) (FDA, strong recommendation) • Crisaborole ointment (FDA, strong recommendation) • Ruxolitinib cream (FDA, strong recommendation) • Wet Dressings (strong recommendation) ## Ongoing Maintenance with Topical Therapies : • Reactive or proactive application for maintenance. • Shared decision-making for long-term treatment. • Consider patient satisfaction and adherence. ## Inadequate Control : • If topical therapy and basic management optimized, consider alternative diagnoses. • Consider additional treatment with phototherapy and/or systemic agents. # Phototherapy & Systemic Therapy : • Topical agents can be used concurrently with phototherapy or systemic agents for maintenance, rescue, or flares. # Phototherapy : • No specific agents listed; included as a treatment option for moderate to severe cases. # Systemic Therapies : ## Biologics : • Dupilumab (FDA, strong recommendation) • Tralokinumab (FDA, strong recommendation) ## JAK Inhibitors : • Upadacitinib (FDA, strong recommendation) • Abrocitinib (FDA, strong recommendation) • Baricitinib (strong recommendation) ## Immunosuppressants : • Methotrexate (strong recommendation) • Azathioprine (strong recommendation) • Cyclosporine (strong recommendation) • Mycophenolate mofetil (strong recommendation) • Systemic corticosteroids (FDA, strong recommendation against use) # Key : • Green circle: Strong recommendation in favor. • Yellow circle: Conditional recommendation in favor. • Red circle: Strong recommendation against. • Orange circle: Conditional recommendation against. • FDA: Indicated for atopic dermatitis. # Abbreviations : • QOL: Quality of Life • FDA: Food and Drug Administration • TCS: Topical corticosteroids • TCI: Topical calcineurin inhibitor # Layout : • The flowchart is organized from baseline management at the top, splitting into two main pathways (mild to severe and moderate to severe), with further branches into topical, phototherapy, and systemic therapies. • Maintenance and escalation steps are included for ongoing management and inadequate control. # Analysis : • The algorithm emphasizes starting with baseline management and topical therapies, escalating to phototherapy and systemic therapies for more severe or refractory cases. • Strong recommendations are visually highlighted for first-line agents, with systemic corticosteroids strongly discouraged. • FDA-approved options are clearly marked, supporting evidence-based decision-making. • The flowchart supports a stepwise, patient-centered approach, integrating maintenance and escalation strategies.
Summary : This flowchart presents a sample management algorithm for patients who are medically inoperable, specifically addressing those with Stage I disease and the use of stereotactic body radiotherapy (SBRT). flowchart: # Nodes : • Medically Inoperable Patients (rounded rectangle, green) • Stage I (rectangle, yellow) • SBRT (rectangle, blue) # Connectors : • Downward arrow from "Medically Inoperable Patients" to "Stage I" • Downward arrow from "Stage I" to "SBRT" # Layout : • Single vertical sequence: three nodes stacked from top to bottom, each connected by a single downward arrow. # Analysis : • The flowchart outlines a straightforward clinical pathway: Medically inoperable patients with Stage I disease are directed to receive SBRT as the management strategy. There are no branches or alternative pathways depicted.
"sepsis" AND "children" AND "guidelines"
PMID: 41869844
sepsis pathophysiology SIRS organ failure diagram
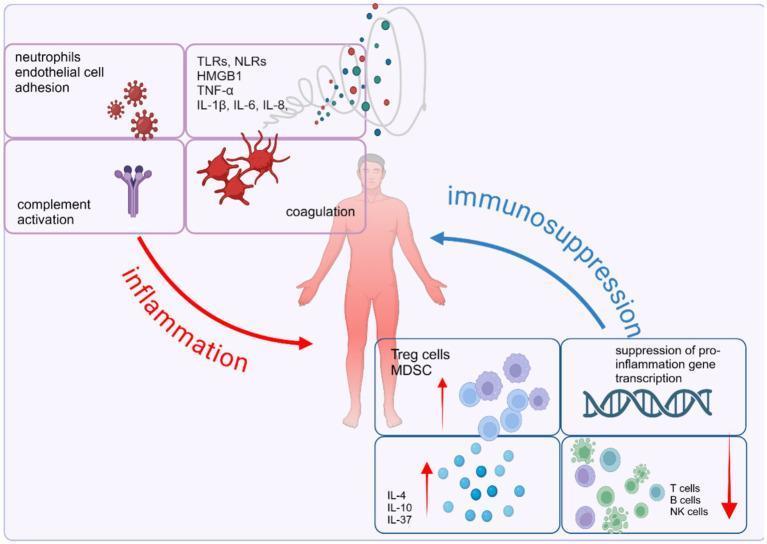
This pathophysiology diagram illustrates the dysregulated host immune response in sepsis, characterized by an imbalance between concurrent pro-inflammatory and anti-inflammatory pathways. Centered on a human figure, the left side (red 'inflammation' arrow) details the acute systemic inflammatory response syndrome (SIRS), featuring neutrophil-endothelial cell adhesion, complement activation, and coagulation cascades. A molecular cloud identifies key mediators including DAMPs/PAMPs (HMGB1, TLRs, NLRs) and pro-inflammatory cytokines (TNF-α, IL-1β, IL-6, IL-8). Conversely, the right side (blue 'immunosuppression' arrow) represents the compensatory anti-inflammatory response syndrome (CARS). This includes the expansion of suppressor cells (Treg cells, MDSCs) and anti-inflammatory cytokines (IL-4, IL-10, IL-37), the suppression of pro-inflammatory gene transcription, and the depletion or exhaustion of effector cells (T cells, B cells, and NK cells). The diagram serves as an educational tool for understanding the complex signaling pathways and cellular interactions that drive multi-organ dysfunction and immune homeostasis failure during septic shock.
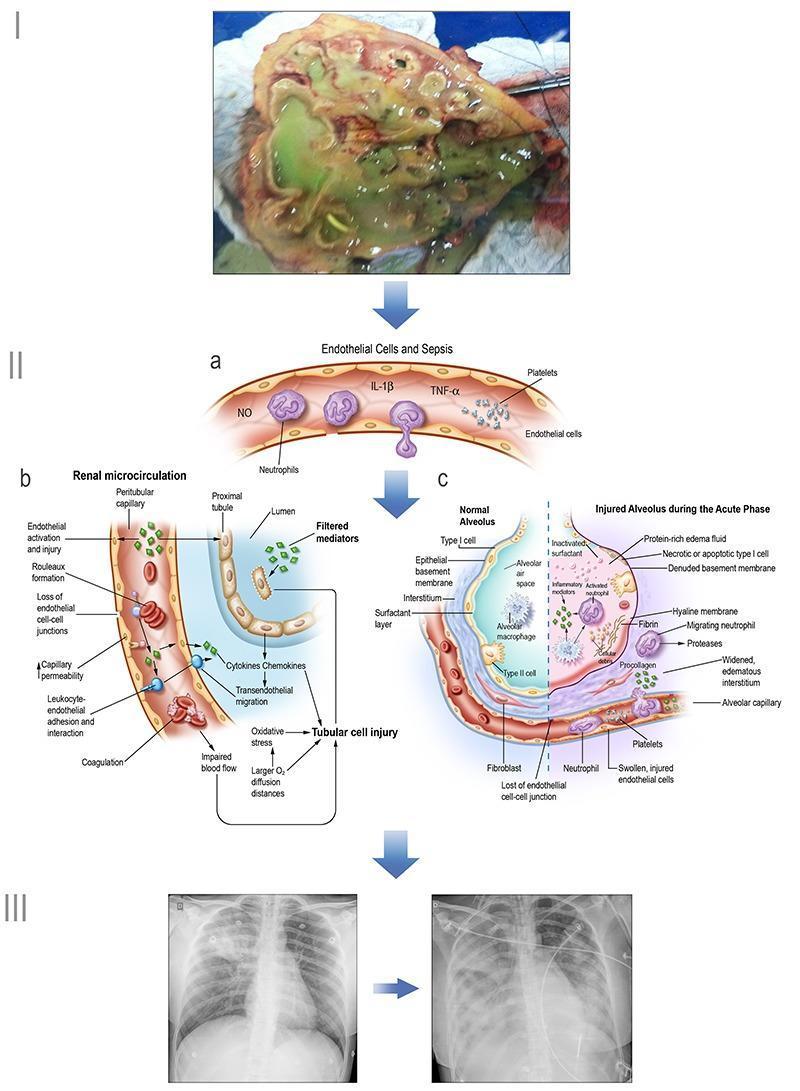
Educational infographic illustrating the pathogenesis of sepsis and multi-organ dysfunction. Section I shows a clinical photograph of a necrotic kidney (pyelonephritis). Section II contains three pathophysiology diagrams: (a) General endothelial changes in sepsis, depicting neutrophil extravasation, platelet activation, and release of inflammatory mediators like TNF-α, IL-1β, and NO; (b) Renal microcirculation injury, highlighting peritubular capillary changes (rouleaux formation, leukocyte adhesion, increased permeability) and subsequent tubular cell injury via oxidative stress and impaired blood flow; (c) Alveolar-capillary comparative diagram, contrasting a normal alveolus with one in the acute phase of ARDS, showing hyaline membrane formation, protein-rich edema, and Type I cell necrosis. Section III features diagnostic chest X-rays demonstrating progressive bilateral opacities consistent with acute respiratory distress syndrome. This visual summary correlates clinical findings, diagnostic imaging (radiography), and microscopic pathophysiology to explain systemic sepsis-induced organ failure.
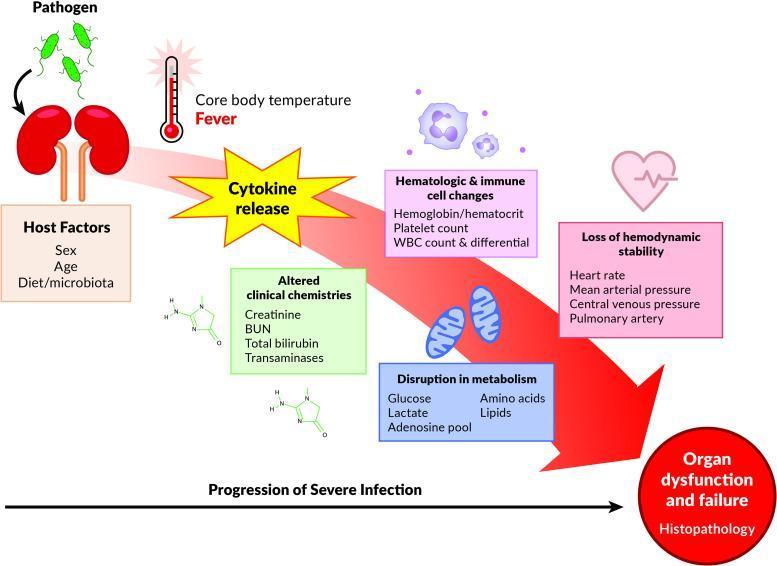
A pathophysiology diagram illustrating the temporal progression of a systemic response to severe infection (sepsis). The flow begins at the top left with a pathogen infecting a host organ (kidney illustration), influenced by host factors like sex, age, and microbiota. A large red diagonal arrow signifies the 'Progression of Severe Infection,' moving through several physiological and biochemical stages. Key milestones include: 1) Systemic inflammation (cytokine release and fever), 2) Altered clinical chemistries (elevated creatinine, BUN, bilirubin, and transaminases), 3) Hematologic and immune shifts (changes in Hgb/Hct, platelets, and WBC differential), 4) Metabolic disruption (glucose, lactate, adenosine pool, amino acids, and lipids), and 5) Loss of hemodynamic stability (abnormalities in heart rate, MAP, CVP, and pulmonary artery pressures). Icons such as a thermometer, mitochondria, and a heart with an irregular EKG waveform represent these changes. The process culminates in a final red node labeled 'Organ dysfunction and failure/Histopathology,' summarizing the natural history of sepsis from inoculation to end-organ injury.
Pediatric Sepsis
Definition
| SIRS Criterion | Threshold |
|---|---|
| Temperature | >38.5°C or <36°C |
| Heart rate | Tachycardia or bradycardia (age-adjusted) |
| Respiratory rate | Tachypnea (age-adjusted) |
| WBC | Elevated or depressed (age-adjusted) |
- Severe sepsis: Sepsis + organ dysfunction
- Septic shock: Sepsis + cardiovascular dysfunction (hypotension refractory to ≥40 mL/kg IV fluid in 1 hour)
Note: The adult Sepsis-3 definition has not been significantly adapted for pediatrics. Age-adjusted qSOFA (altered mental status + hypotension + tachypnea) has better specificity but lower sensitivity than SIRS for pediatric mortality prediction.
Epidemiology
- Sepsis accounts for significant pediatric ICU admissions worldwide
- Most common sources: lungs, blood (bacteremia), urine, skin/soft tissue
- Common pathogens vary by age:
- Neonates: Group B Streptococcus, E. coli, Listeria, HSV
- Infants/toddlers: S. pneumoniae, N. meningitidis, H. influenzae, RSV
- Older children: S. aureus (including MRSA), S. pneumoniae, gram-negatives
- Immunocompromised: fungi, atypical bacteria, resistant organisms
- Mortality is highest when shock is not reversed within the first hour
Pathophysiology
- Vasodilation via excess nitric oxide production
- Myocardial depression - reduced contractility and stroke volume
- Complement activation - amplifies inflammation
- Coagulation activation - can progress to DIC (disseminated intravascular coagulation)
- Microvascular failure - endothelial injury, capillary leak, tissue hypoperfusion
Clinical Features
Key Presentations
| Finding | Notes |
|---|---|
| Fever (>38.5°C) or hypothermia (<36°C) | Common but non-specific |
| Tachycardia | Sensitive but non-specific |
| Tachypnea | Early sign of metabolic acidosis |
| Altered mental status | High-specificity indicator |
| Prolonged capillary refill (>2 sec) | Important perfusion marker |
| Hypotension | Late sign in children - compensated shock precedes it |
| Mottled/pale skin | Suggests vasomotor instability |
| Decreased urine output | Sign of renal hypoperfusion |
Important: Unlike adults, children can maintain BP through tachycardia and vasoconstriction - hypotension is a LATE and ominous sign. The combination of hypotension + delayed capillary refill carries the highest mortality risk.
Warm vs. Cold Shock
| Type | Clinical Features | Common Vasopressor |
|---|---|---|
| Warm shock | Bounding pulses, wide pulse pressure, warm extremities | Norepinephrine |
| Cold shock | Weak pulses, narrow pulse pressure, cool extremities, prolonged CRT | Epinephrine |
Investigations
| Test | Purpose |
|---|---|
| Blood cultures (×2) | Source identification; do NOT delay antibiotics |
| Urine culture | UTI is a common source |
| CBC with differential | WBC count, neutropenia, thrombocytopenia (DIC) |
| CRP, Procalcitonin | Markers of bacterial infection; procalcitonin useful for serial monitoring |
| Lactate | >4 mmol/L in ED associated with 30-day mortality (OR 3.3) |
| Venous blood gas | Metabolic acidosis, base deficit |
| BMP/CMP | Renal/hepatic organ dysfunction |
| Coagulation (PT, PTT, fibrinogen, D-dimer) | Screen for DIC |
| Chest X-ray | Pulmonary source, ARDS |
| Lumbar puncture | If meningitis suspected and patient stable enough |
Management - The First Hour Bundle
- Timely intravascular access
- Rapid fluid resuscitation titrated to condition
- Appropriate broad-spectrum antibiotics
- Individualized vasoactive agents
First-Hour Bundle Table
| Intervention | Key Points | Sample Regimen |
|---|---|---|
| Antibiotics | Broad spectrum; MRSA coverage if indwelling catheter; Pseudomonas coverage if nosocomial | Cefepime 50 mg/kg ± Vancomycin 20 mg/kg |
| Fluids | Large-bore IV or IO access; bolus isotonic fluid; monitor fluid responsiveness | 20 mL/kg lactated Ringer's over 10 min (repeat PRN up to 40-60 mL/kg) |
| Vasopressors | If hypotension refractory to fluids | Epinephrine 0.05 mcg/kg/min (first-line) |
| Cultures | Blood + urine; should NOT delay antibiotics | Two blood cultures if indwelling line |
| Monitoring | Cardiorespiratory monitoring; watch for fluid overload (new hepatomegaly, tachypnea) | Arterial line for refractory hypotension |
Antibiotics
- Septic shock: Within 1 hour of recognition
- Sepsis with organ dysfunction (no shock): Within 3 hours
- Community-acquired, healthy child: Ceftriaxone (3rd-gen cephalosporin)
- Nosocomial / chronically ill / immunocompromised: Cefepime, meropenem, or piperacillin-tazobactam ± vancomycin
- Tailor to culture results once available
Fluid Resuscitation
- Administer 20 mL/kg boluses of isotonic crystalloid (balanced fluid preferred - lactated Ringer's)
- Reassess after each bolus; total up to 40-60 mL/kg in the first hour
- Stop/reduce for signs of fluid overload: new tachypnea, hepatomegaly, pulmonary edema
- Albumin is NOT routinely recommended in the ED resuscitation
Vasopressors
- Initiate if shock does not improve after 60 mL/kg fluid or if fluid overload develops
- First-line: Epinephrine 0.05 mcg/kg/min (studies show faster shock reversal and lower mortality vs. dopamine)
- Alternative first-line: Norepinephrine (especially warm shock)
- If inadequate response: add a second vasopressor (choice not evidence-based)
- Initiate in any patient with septic shock + hypotension lasting >1 hour regardless of fluid amount given
Corticosteroids
- Consider hydrocortisone in fluid-refractory and catecholamine-refractory septic shock
- Dose: hydrocortisone 1-2 mg/kg/day (stress dosing) - for adrenal insufficiency or refractory shock
- Not routine in all pediatric sepsis
Respiratory Support
- Supplemental oxygen to all septic children
- Early intubation for respiratory failure, refractory shock, or altered mental status
- Target SpO2 >94%
- Be cautious: intubation during hemodynamic instability can precipitate cardiac arrest - have vasopressors ready
Disposition
- Septic shock / severe sepsis → Pediatric ICU (PICU)
- Sepsis with organ dysfunction → Minimum step-down/monitored unit
- Transfer to tertiary PICU if local resources insufficient
- Early PICU transfer improves outcomes
Key Differences from Adult Sepsis
| Feature | Pediatric | Adult |
|---|---|---|
| Hypotension | Late, compensated shock is common | Earlier sign |
| Fluid bolus | Up to 40-60 mL/kg in first hour | More conservative (30 mL/kg) |
| First-line vasopressor | Epinephrine | Norepinephrine |
| Definitions | SIRS-based (not Sepsis-3) | Sepsis-3 |
| qSOFA | Age-adjusted version | Standard |
2026 Surviving Sepsis Campaign Update
- 5 strong recommendations
- 24 conditional recommendations
- 10 good practice statements
- Most recommendations remain based on low certainty of evidence, highlighting ongoing gaps in pediatric-specific data
- Rosen's Emergency Medicine: Concepts and Clinical Practice - Ch. 158 (Pediatric Sepsis)
- Surviving Sepsis Campaign Pediatric Guidelines 2026 (PMID: 41869844)