
Bile metabolism and its clinical significance in detail study
bile acid synthesis metabolism enterohepatic circulation diagram
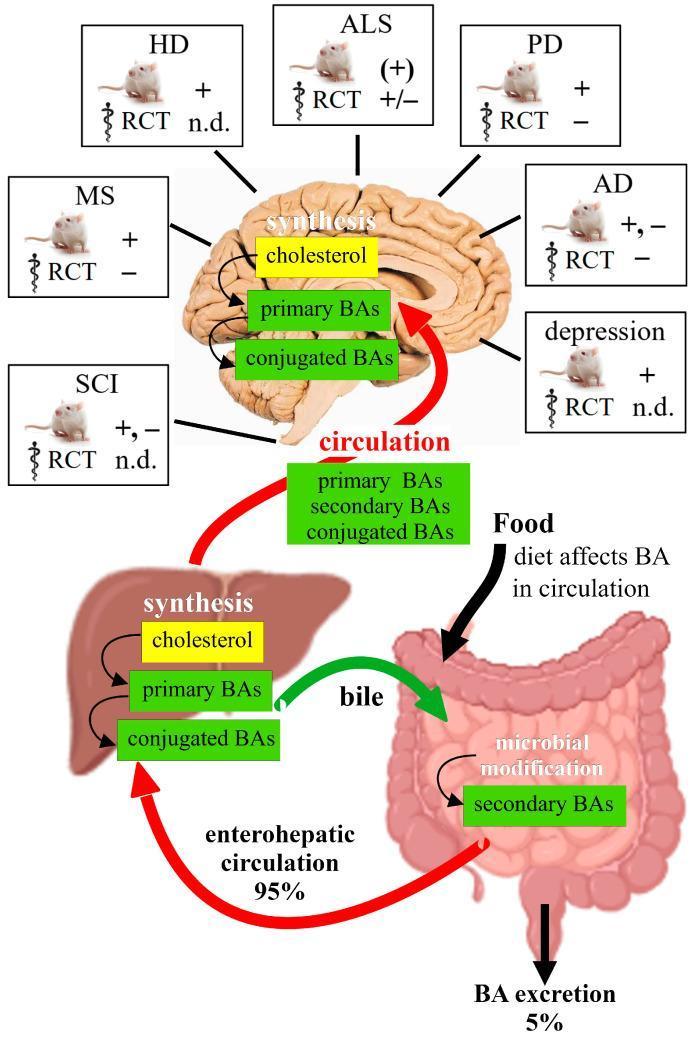
This medical infographic illustrates the gut-brain-liver axis focusing on bile acid (BA) synthesis and circulation. In the liver, cholesterol is converted into primary BAs and conjugated BAs, which are then released via bile into the intestines. In the gut, microbial modification transforms them into secondary BAs; 95% are reabsorbed through the enterohepatic circulation, while 5% are excreted. A systemic circulation pathway shows primary, secondary, and conjugated BAs reaching the Central Nervous System (CNS). The diagram suggests local synthesis of cholesterol and BAs may also occur within the brain. Surrounding the central physiological diagram are boxes detailing therapeutic research for various neuropathologies, including Multiple Sclerosis (MS), Huntington's Disease (HD), Amyotrophic Lateral Sclerosis (ALS), Parkinson's Disease (PD), Alzheimer's Disease (AD), Spinal Cord Injury (SCI), and depression. Each box indicates treatment efficacy in animal models (+) and Randomized Clinical Trials (RCT), with signs denoting positive effects (+), no effect (-), or no data available (n.d.).
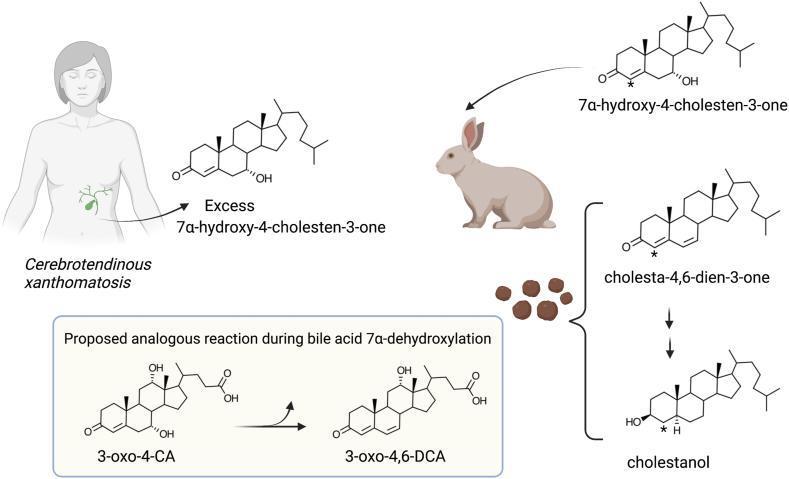
A pathophysiology diagram illustrating the metabolic pathways of bile acids and cholesterol derivatives in the context of cerebrotendinous xanthomatosis (CTX) and intestinal bacterial metabolism. On the left, an illustration of a human subject with CTX shows the excessive accumulation of 7α-hydroxy-4-cholesten-3-one (C4), a marker for bile acid synthesis. On the right, a rabbit model demonstrates the bacterial conversion of radiolabeled C4. The sequence shows C4 being transformed into cholesta-4,6-dien-3-one through the elimination of the 7α-hydroxyl group and introduction of a double bond at C6-C7. This is followed by reduction to cholestanol, involving the saturation of the steroid ring and reduction of the C3-ketone to a hydroxyl group. A boxed inset at the bottom left illustrates a 'Proposed analogous reaction during bile acid 7α-dehydroxylation' by gut microbiota. It depicts the conversion of 3-oxo-4-cholic acid (3-oxo-4-CA) to 3-oxo-4,6-deoxycholic acid (3-oxo-4,6-DCA), highlighting a mechanism involving a 3-oxo-Δ4-steroid intermediate. This educational visual explains the biochemical link between human metabolic errors and microbial bile acid biotransformation.
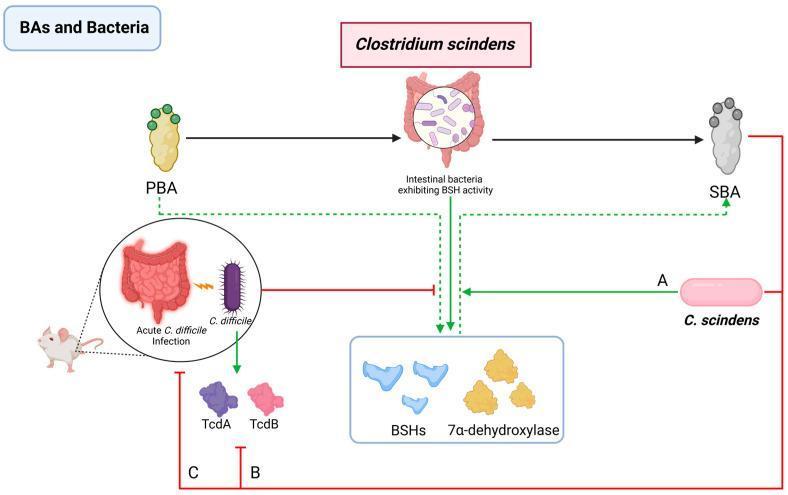
This pathophysiology diagram illustrates the protective role of Clostridium scindens (C. scindens) against acute Clostridioides difficile (C. difficile) infection through bile acid (BA) metabolism. The process begins with Primary Bile Acids (PBAs) being converted into Secondary Bile Acids (SBAs) by intestinal bacteria that possess Bile Salt Hydrolase (BSH) and 7Ͱ-dehydroxylase activity. C. scindens is shown as a critical driver of this conversion. The diagram highlights three specific inhibitory pathways (labeled A, B, and C) through which C. scindens and SBAs mitigate C. difficile infection: (A) direct inhibition of C. difficile bacterial counts, (B) suppression of C. difficile toxin production (specifically TcdA and TcdB), and (C) overall reduction of the infection's clinical impact, depicted in a mouse model. Key enzymatic components represented include BSHs and 7Ͱ-dehydroxylase, which facilitate the chemical transformation of BAs. This visual explains the therapeutic potential of microbial restoration in managing gastrointestinal dysbiosis and antibiotic-associated infections.
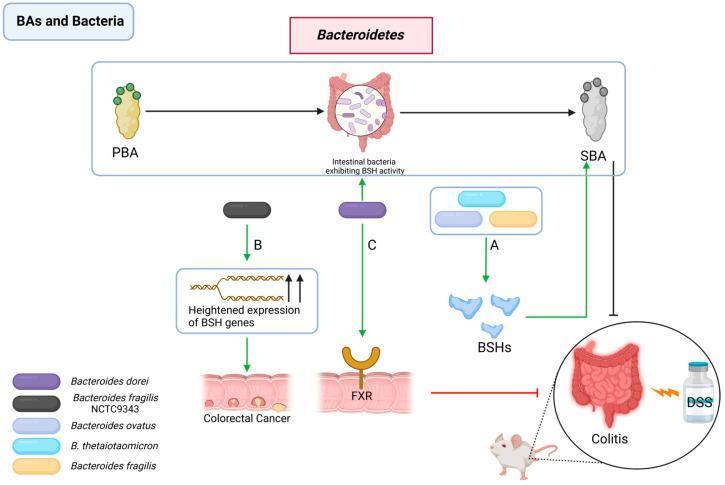
A medical pathophysiology diagram illustrating the complex interactions between Bacteroidetes species, bile acid metabolism, and intestinal health. The central pathway shows primary bile acids (PBA) being converted to secondary bile acids (SBA) by intestinal bacteria exhibiting bile salt hydrolase (BSH) activity. The diagram is divided into three functional pathways. Pathway A depicts Bacteroides ovatus, B. thetaiotaomicron, and B. fragilis producing BSH enzymes that facilitate SBA production, which subsequently inhibits colitis (modeled by DSS induction). Pathway B shows Bacteroides fragilis NCTC9343 triggering heightened BSH gene expression, which correlates with the development of Colorectal Cancer, characterized by visible cellular dysplasia. Pathway C illustrates Bacteroides dorei modulating the FXR (Farnesoid X Receptor) signaling pathway on the intestinal epithelium to alleviate experimental colitis. The diagram utilizes a rodent model (mouse) to contextualize these microbiome-host interactions, emphasizing the dual role of Bacteroidetes in promoting either anti-inflammatory outcomes or oncogenesis depending on specific strains and gene expression profiles.
bilirubin metabolism jaundice types unconjugated conjugated
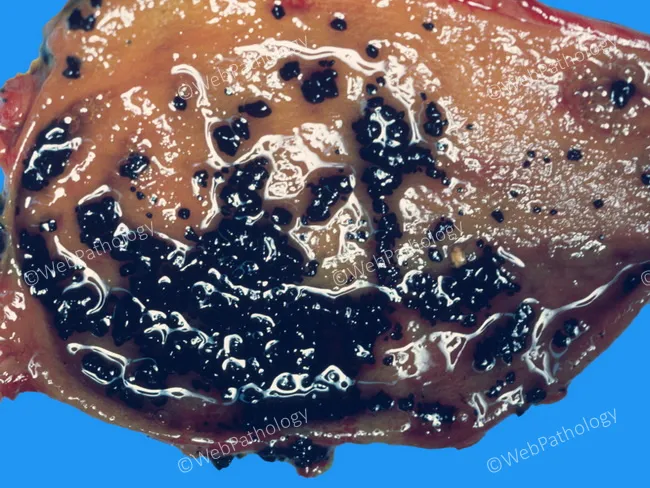
Gross pathology photograph of a gallbladder lumen containing numerous dark pigment stones. The specimen illustrates cholelithiasis with pigment-type calculi arising in the setting of chronic hemolysis. Pigment stones are rich in bilirubin calcium salts; excessive bilirubin turnover leads to supersaturation of bile with unconjugated bilirubin, promoting precipitation and stone formation. In chronic hemolytic states, conjugated bilirubin secretion increases and deconjugation within the biliary tree yields substantial deconjugated bilirubin, precipitating as black to brown pigment stones that fill the luminal cavity. The surrounding gallbladder wall may appear thickened or fibrotic in chronic inflammation, though mural details are limited in this image. The stones range from granular to angular and vary in size; their surface may be smooth or faceted and they impart a mottled, dark appearance to the lumen against a lighter mucosal backdrop. Clinically, pigment stones correlate with hemolytic anemias (e.g., sickle cell disease, hereditary spherocytosis) and can cause biliary colic or cholecystitis when obstructing cystic duct. Differential considerations include cholesterol stones, mixed pigment stones, and brown pigment stones due to infection. These findings underscore the diagnostic significance of gallbladder pigment lithiasis as a marker of bilirubin metabolism disturbances and chronic biliary disease. This image aids diagnostic and research interpretation.
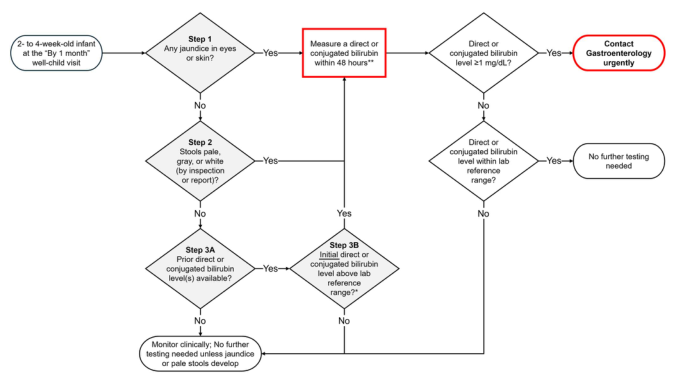
Summary : This flowchart outlines the clinical decision-making process for evaluating jaundice or pale stools in 2- to 4-week-old infants during the "By 1 month" well-child visit, focusing on when to measure direct or conjugated bilirubin and when to urgently contact gastroenterology. flowchart: # Nodes : • Start (ellipse): "2- to 4-week-old infant at the 'By 1 month' well-child visit" • Step 1 (diamond): "Any jaundice in eyes or skin?" • Step 2 (diamond): "Stools pale, gray, or white (by inspection or report)?" • Step 3A (diamond): "Prior direct or conjugated bilirubin level(s) available?" • Step 3B (diamond): "Initial direct or conjugated bilirubin level above lab reference range?" • Action (rectangle, red border): "Measure a direct or conjugated bilirubin within 48 hours**" • Decision (diamond): "Direct or conjugated bilirubin level ≥1 mg/dL?" • Decision (diamond): "Direct or conjugated bilirubin level within lab reference range?" • Action (ellipse, red border): "Contact Gastroenterology urgently" • Action (ellipse): "No further testing needed" • Action (ellipse): "Monitor clinically; No further testing needed unless jaundice or pale stools develop" # Connectors : • Start → Step 1 • Step 1 Yes → Measure a direct or conjugated bilirubin within 48 hours** • Step 1 No → Step 2 • Step 2 Yes → Measure a direct or conjugated bilirubin within 48 hours** • Step 2 No → Step 3A • Step 3A Yes → Step 3B • Step 3A No → Monitor clinically; No further testing needed unless jaundice or pale stools develop • Step 3B Yes → Measure a direct or conjugated bilirubin within 48 hours** • Step 3B No → No further testing needed • Measure a direct or conjugated bilirubin within 48 hours** → Direct or conjugated bilirubin level ≥1 mg/dL? • Direct or conjugated bilirubin level ≥1 mg/dL? Yes → Contact Gastroenterology urgently • Direct or conjugated bilirubin level ≥1 mg/dL? No → Direct or conjugated bilirubin level within lab reference range? • Direct or conjugated bilirubin level within lab reference range? Yes → No further testing needed • Direct or conjugated bilirubin level within lab reference range? No → Contact Gastroenterology urgently # Layout : • Top-down hierarchical structure. • Decision diamonds branch to actions or further decisions. • Red-bordered nodes highlight urgent actions. • Ellipses used for start/end points and urgent actions. # Analysis : • The flowchart provides a systematic approach to evaluating jaundice or pale stools in young infants. • It emphasizes early measurement of direct or conjugated bilirubin if jaundice or pale stools are present. • Urgent gastroenterology contact is required if bilirubin is ≥1 mg/dL or above reference range. • Clinical monitoring is recommended if no concerning findings are present. • The process ensures timely identification and management of possible liver or biliary disease.
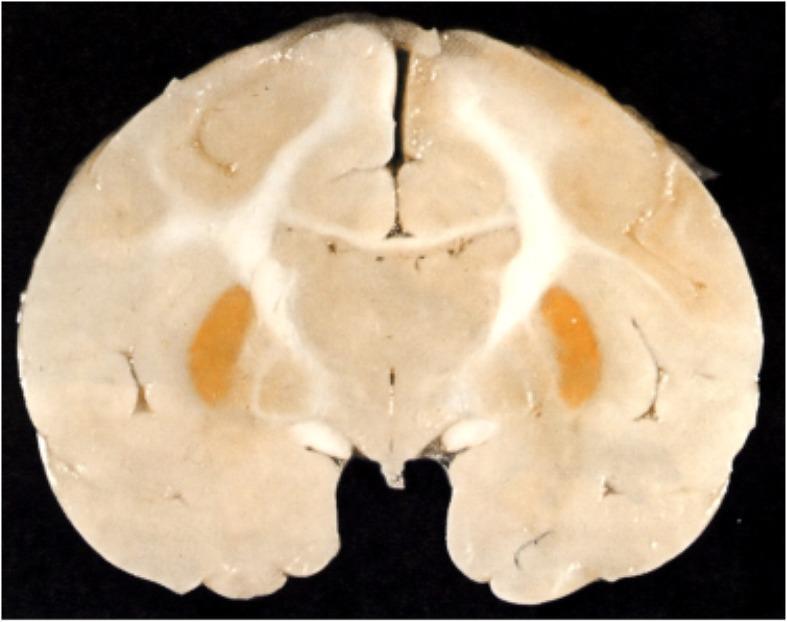
This clinical photograph displays a coronal gross section of a brain, serving as a classic pathological demonstration of kernicterus (bilirubin encephalopathy). The most striking visual feature is the intense, symmetrical yellow-orange staining (icterus) localized specifically to the basal ganglia, most notably the putamen. This discoloration results from the deposition of unconjugated bilirubin in specific subcortical nuclei. The surrounding cerebral cortex, white matter tracts, and ventricular spaces appear largely unaffected and maintain a normal pale cream coloration. This visual pattern is characteristic of neonatal jaundice where the blood-brain barrier is permeable to lipid-soluble unconjugated bilirubin, leading to localized neurotoxicity. The image highlights the selective vulnerability of deep gray matter structures to hyperbilirubinemia in the neonatal period, a key concept in pediatric neurology and pathology.
Bile Metabolism and Clinical Significance - Detailed Study
1. Overview of Bile
| Component | Molar % |
|---|---|
| Bile acids | 80% |
| Phospholipids (lecithins, cephalins, sphingomyelin) | 16% |
| Unesterified cholesterol | 4% (up to 8-10% in lithogenic states) |
- Harrison's Principles of Internal Medicine 22E, p. 1713
2. Bile Acid Synthesis
2a. Primary Bile Acids
- Cholic acid (CA) - trihydroxy (C-3, C-7, C-12)
- Chenodeoxycholic acid (CDCA) - dihydroxy (C-3, C-7)
2b. Two Biosynthetic Pathways
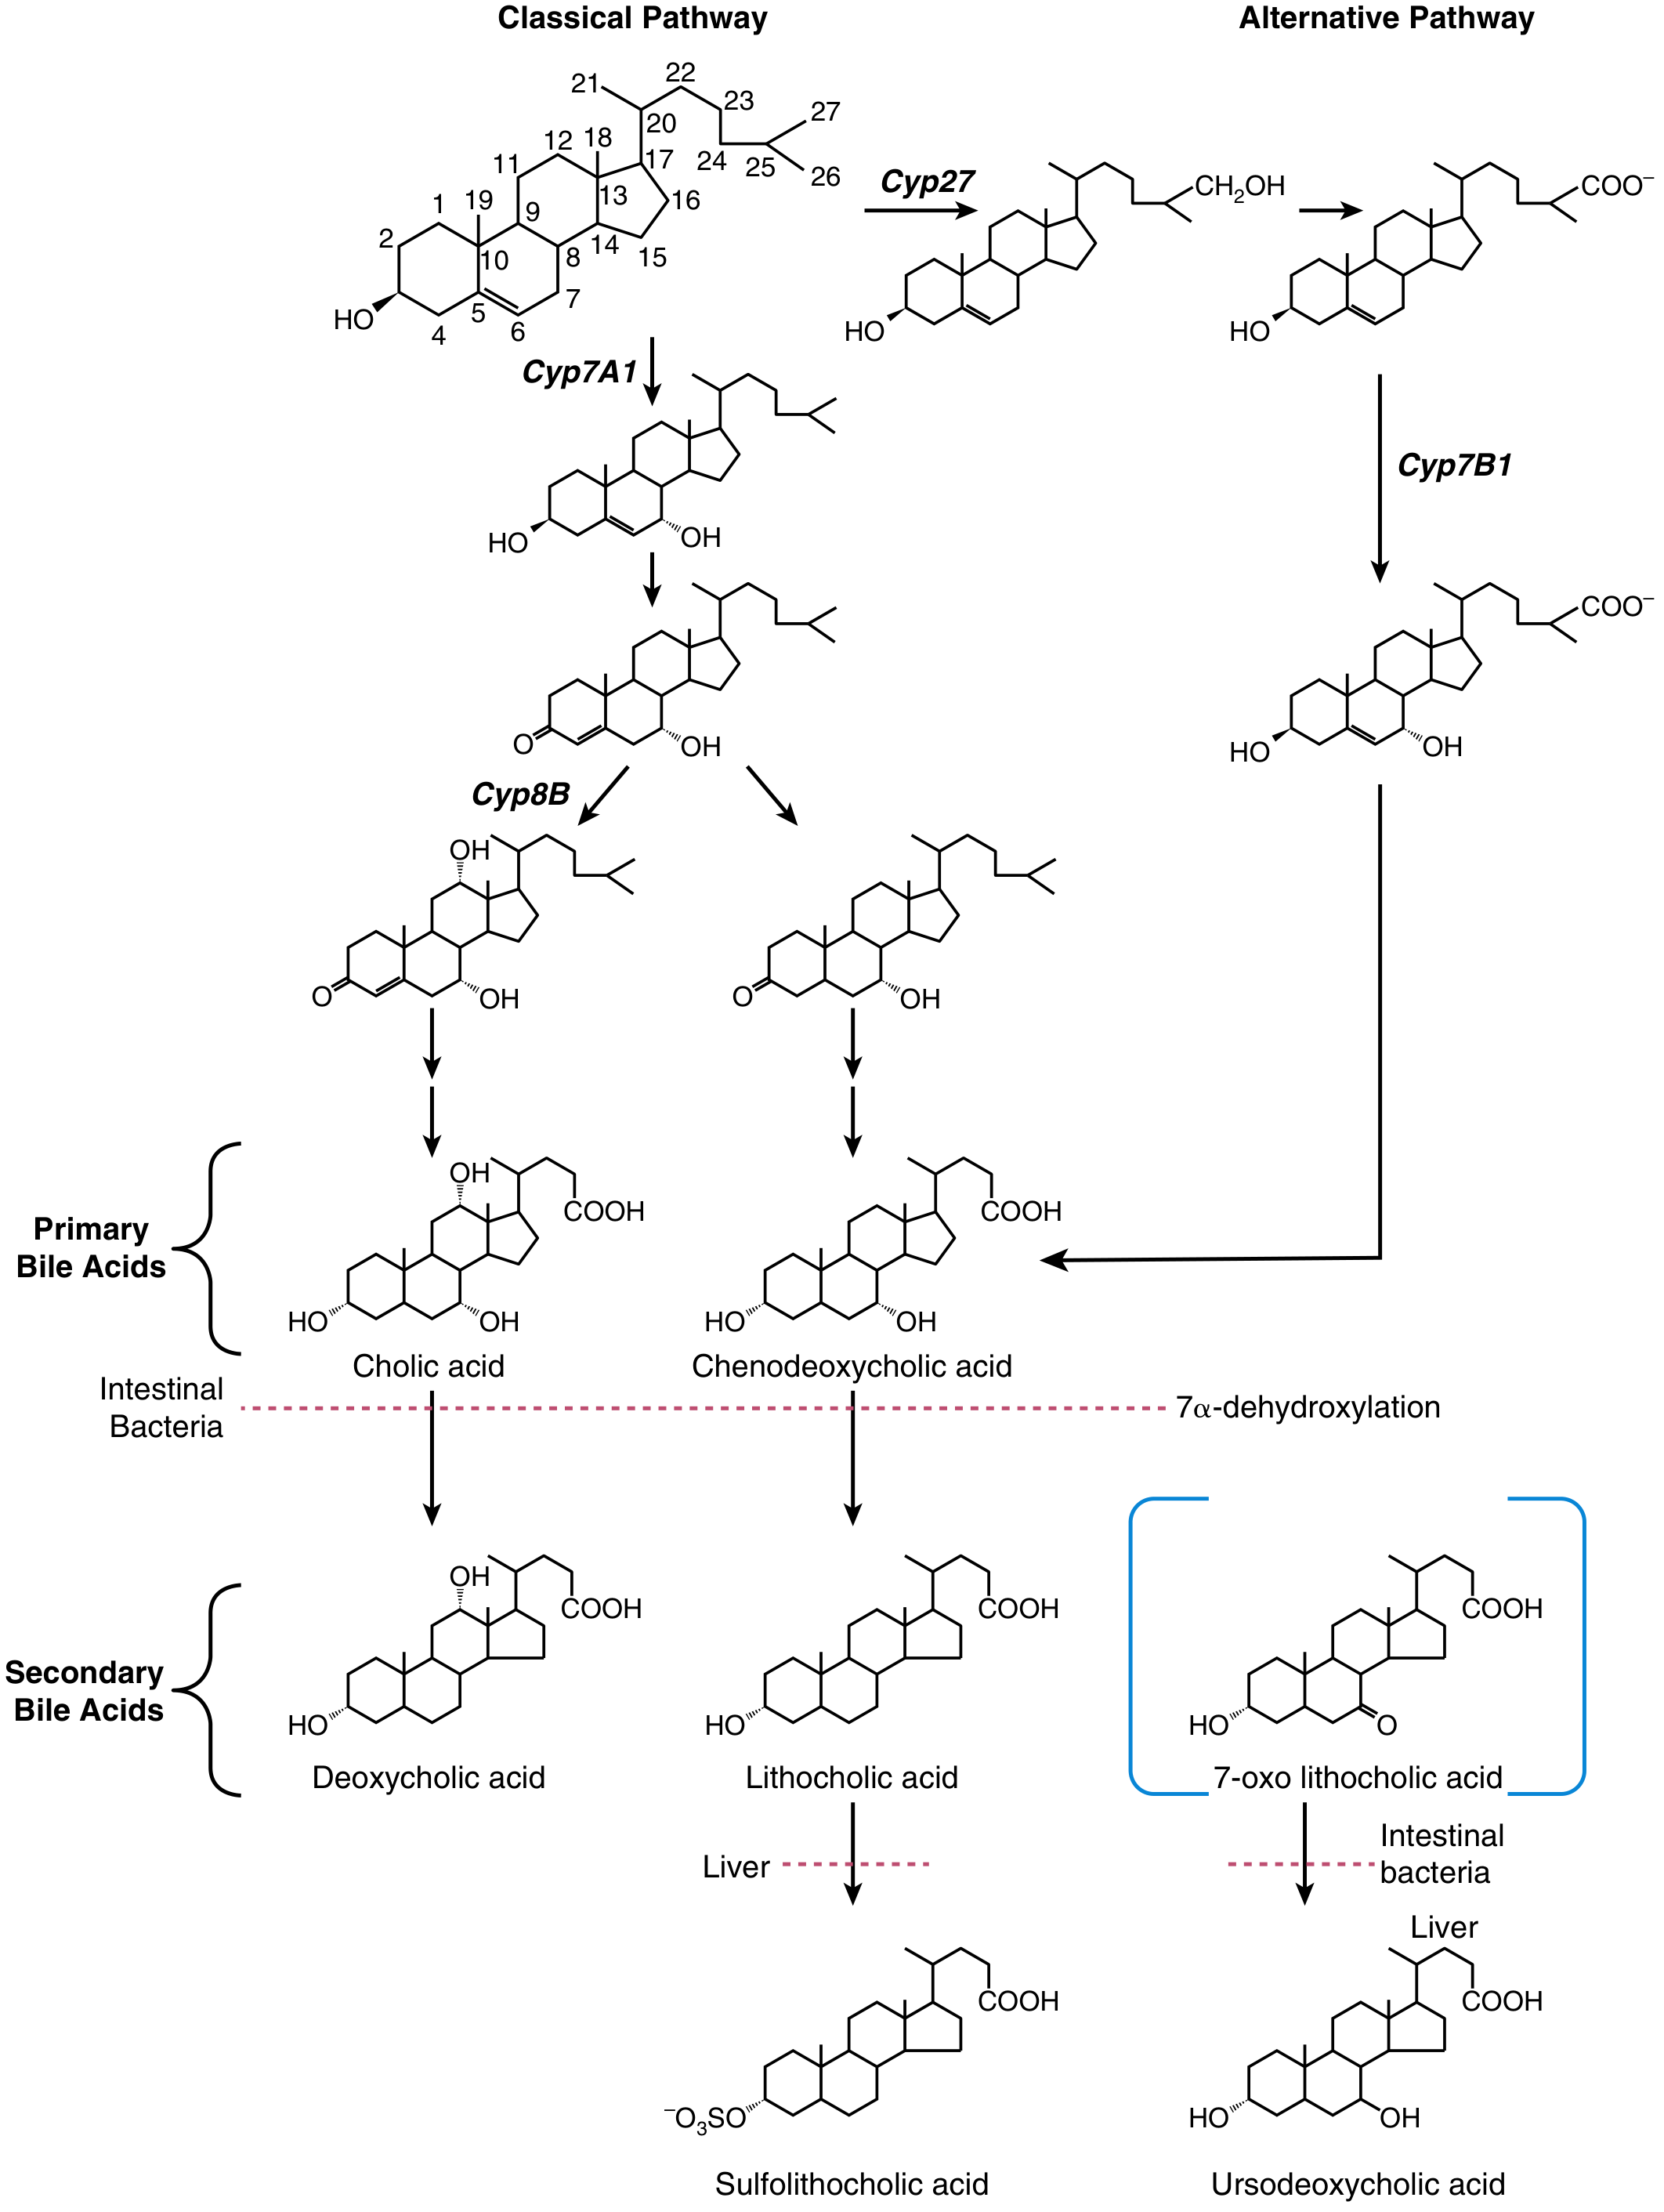
- Enzyme: cholesterol 7α-hydroxylase (CYP7A1) - rate-limiting step
- Favors CA biosynthesis
- CYP8B1 (sterol 12α-hydroxylase) determines CA:CDCA ratio
- Begins with CYP27A1 (sterol 27-hydroxylase) in mitochondria
- Then oxysterol 7α-hydroxylase (CYP7B1)
- Favors CDCA biosynthesis
2c. Regulation of CYP7A1 (the Feedback Loop)
- Bile acids activate FXR (farnesoid X receptor) in ileal enterocytes
- FXR induces secretion of FGF19 (fibroblast growth factor-19)
- FGF19 travels in portal blood to hepatocytes, signals via FGFR4-β-klotho complex → represses CYP7A1
- In hepatocytes, FXR also induces SHP (small heterodimer partner), which blocks HNF4α and LRH-1 (transcription factors activating CYP7A1)
- FXR also upregulates ZFP36L1, an RNA-binding protein that degrades CYP7A1 mRNA
- Sleisenger and Fordtran's GI and Liver Disease, p. 1201
3. Bile Acid Conjugation
- Increases hydrophilicity and acidity (pKa drops from ~5.0 → 3.9 for glycine-conjugate; ~2.0 for taurine-conjugate)
- Decreases passive diffusion across cell membranes
- More soluble at acidic pH, resistant to calcium precipitation
- Maintains high intraluminal concentrations in biliary tract and small intestine for lipid solubilization
4. Secondary Bile Acids and Gut Microbiota
- Deconjugation - bile salt hydrolases remove glycine/taurine (~15% in small intestine)
- 7α-dehydroxylation - converts CA → deoxycholic acid (DCA) and CDCA → lithocholic acid (LCA)
| Primary | → Bacteria → | Secondary |
|---|---|---|
| Cholic acid | 7α-dehydroxylation | Deoxycholic acid |
| Chenodeoxycholic acid | 7α-dehydroxylation | Lithocholic acid |
5. Bile Acid Transport Proteins
| Protein | Gene | Function |
|---|---|---|
| NTCP | SLC10A1 | Basolateral Na+-dependent bile salt uptake |
| OATP1B1/1B3 | SLCO1B1/1B3 | Basolateral Na+-independent uptake of bile acids and non-bile acid anions |
| BSEP | ABCB11 | Canalicular bile salt export pump (primary export) |
| MRP2 | ABCC2 | Canalicular export of conjugated bilirubin, drugs |
| MDR3 | ABCB4 | Phospholipid export pump (canalicular) |
| MDR1 | ABCB1 | Hydrophobic compound export |
| ABCG5/G8 | ABCG5/G8 | Canalicular cholesterol and phytosterol transporter |
- Harrison's Principles of Internal Medicine 22E
6. Enterohepatic Circulation
- Total bile acid pool: ~3 g
- Daily secretion: 12-36 g/day
- Basal synthesis: only ~600 mg/day (replacing fecal losses)
- Cycles per day: 4-12 times (up to 5+ times for a single fat-rich meal)
- Recovery efficiency: 95%+ reclaimed
- Conjugated bile salts secreted into duodenum; remain at high levels throughout the small intestine
- Passive absorption - along entire small intestine and colon (ionic + nonionic diffusion); nonionic diffusion is 10-fold greater. Unconjugated > glycine-conjugated > taurine-conjugated in passive absorption
- Active absorption - restricted to terminal ileum only (ASBT/IBAT transporter, SLC10A2), preferentially absorbs negatively charged conjugated bile salts
- Absorbed bile acids enter portal blood → delivered back to liver → re-secreted into bile
- Medical Physiology (Boron & Boulpaep), p. 1422
7. Bilirubin Metabolism
7a. Production (Pre-hepatic)
- ~80% from degradation of senescent RBCs in reticuloendothelial system
- ~20% from "early-labeled fraction": catabolism of other hemoproteins (myoglobin, cytochrome P450, catalase) and ineffective erythropoiesis
- Heme oxygenase cleaves the heme ring → biliverdin + CO + Fe²⁺
- Biliverdin reductase reduces biliverdin → unconjugated bilirubin (UCB)
7b. Hepatic Uptake
- UCB binds to albumin in blood (Kd ~10⁻⁸ mol/L) for transport to liver
- Dissociates from albumin at hepatocyte sinusoidal membrane
- Taken up by OATP1A1 and OATP1B3 transporters
- Inside hepatocyte, bound to ligandin (glutathione-S-transferase family, ~5% of liver cytosol protein) - prevents back-diffusion to plasma
7c. Conjugation (Hepatic)
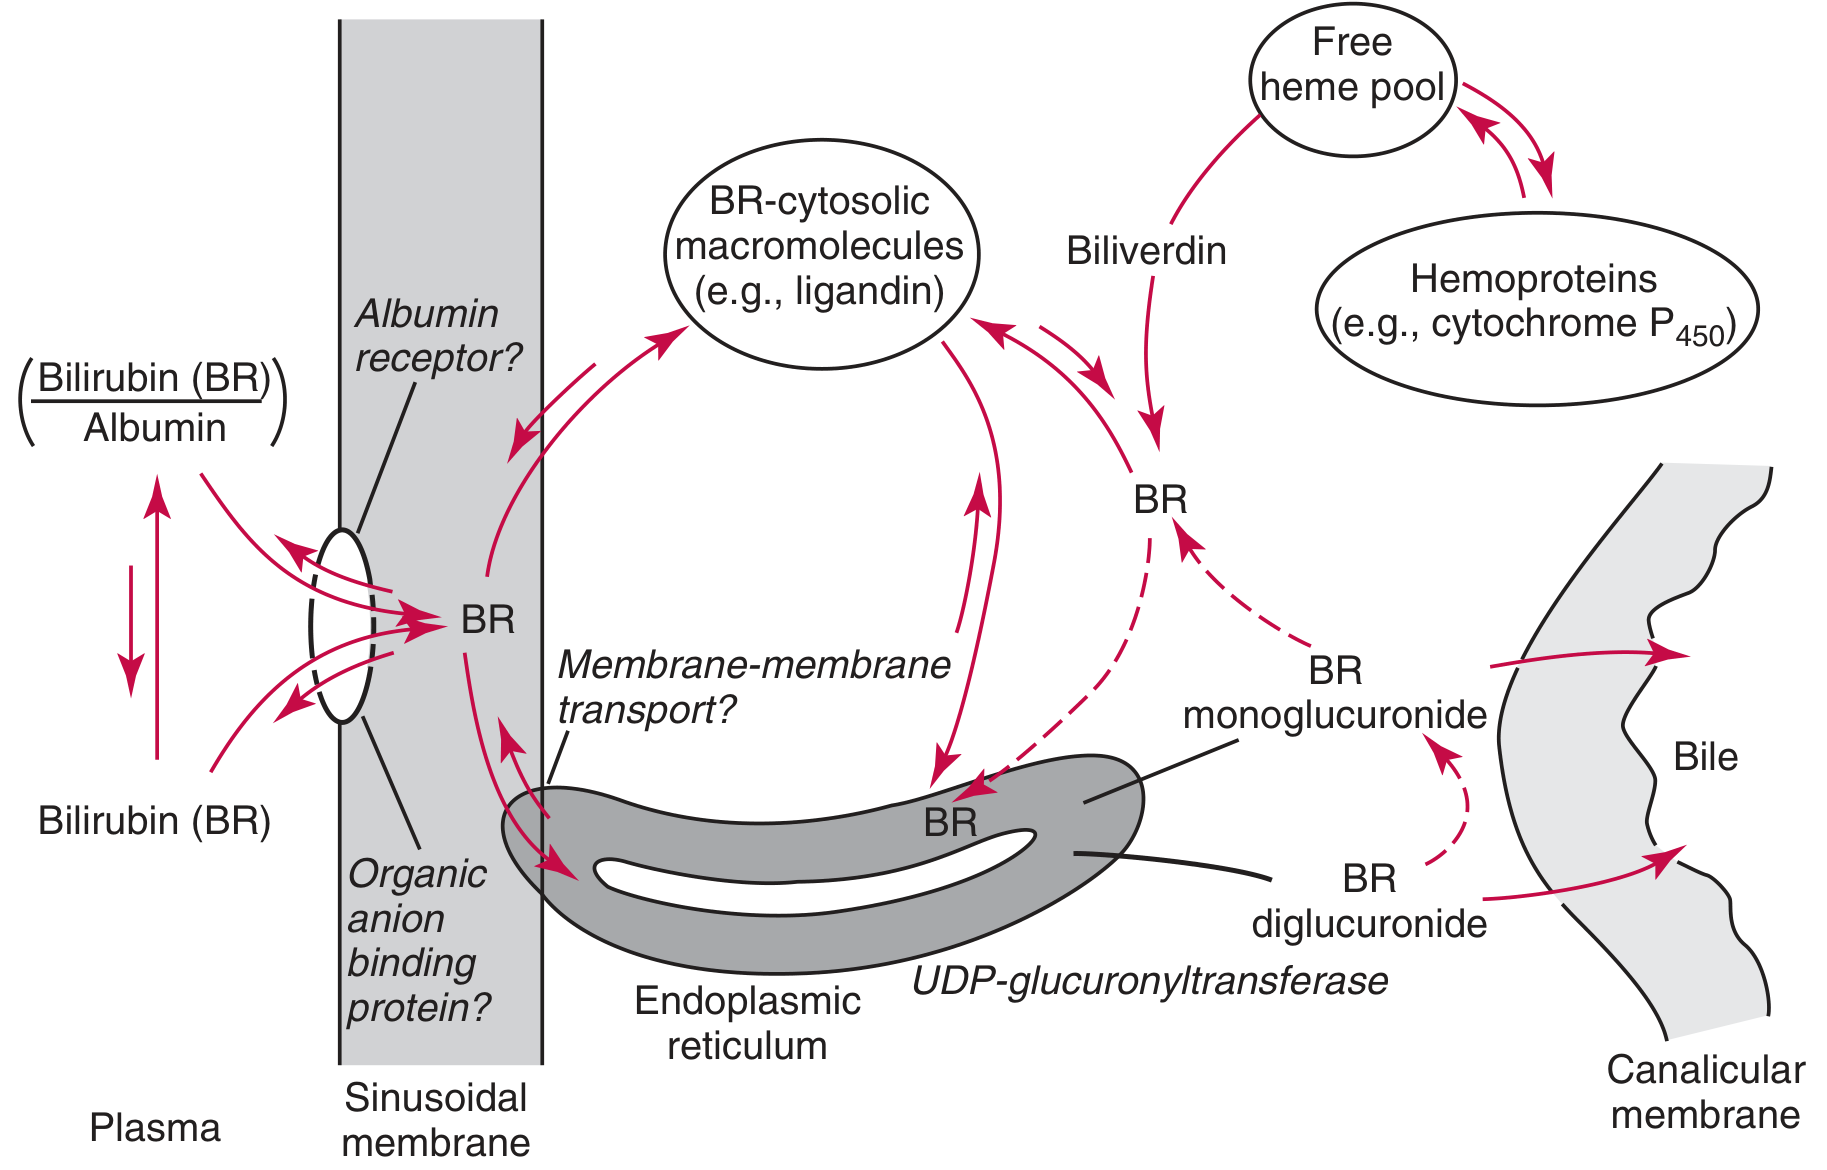
- UGT1A1 (UDP-glucuronyltransferase 1A1) in smooth ER conjugates bilirubin with glucuronic acid
- Products: bilirubin monoglucuronide (~10%) and diglucuronide (~90%)
- ~95% of glucuronides, with remainder as glucosides and xylosides
7d. Canalicular Excretion
- MRP2 (ABCC2) - primary canalicular transporter for bilirubin glucuronides
- ABCG2 - secondary pathway
- ABCC3 at sinusoidal pole can return bilirubin to plasma for uptake by OATP1B1/1B3
7e. Intestinal Fate (Urobilinogen Cycle)
- Bilirubin glucuronides not substantially reabsorbed - hydrolyzed by β-glucuronidase
- Unconjugated bilirubin reduced by anaerobic bacteria → urobilinogens (urobilinogen, mesobilinogen, stercobilinogen)
- ~20% of urobilinogen reabsorbed → enterohepatic circulation → liver re-excretes in bile
- Small fraction (2-5%) reaches systemic circulation → excreted in urine
- In lower intestinal tract, urobilinogens oxidized → urobilin, mesobilin, stercobilin (brown stool pigments)
- ~50% of conjugated bilirubin excreted in feces as urobilinoids
- Tietz Textbook of Laboratory Medicine, 7th Ed.
8. Lab Measurement: Direct vs. Indirect Bilirubin
- Direct bilirubin = water-soluble, reacts directly with diazo reagent without accelerator = conjugated bilirubin
- Indirect bilirubin = requires alcohol accelerator = unconjugated bilirubin
- Total bilirubin = direct + indirect
- Normal total serum bilirubin: <1.0-1.2 mg/dL
- α-bilirubin (unconjugated)
- β-bilirubin (monoconjugated)
- γ-bilirubin (diconjugated)
- δ-bilirubin (albumin-bound conjugated) - highly specific marker of hepatic dysfunction
9. Clinical Significance - Hyperbilirubinemia and Jaundice
9a. Pre-hepatic (Unconjugated Hyperbilirubinemia - Indirect ↑)
| Mechanism | Example |
|---|---|
| Hemolysis (overproduction) | Sickle cell anemia, hereditary spherocytosis, G6PD deficiency |
| Ineffective erythropoiesis | Thalassemia |
| Impaired hepatic uptake | Drugs, cardiac failure |
| Conjugation defect | Gilbert syndrome, Crigler-Najjar |
- Type I: Complete absence of UGT1A1 → severe unconjugated hyperbilirubinemia → risk of kernicterus (bilirubin deposits in basal ganglia - see image below)
- Type II (Arias syndrome): Partial UGT1A1 deficiency → responds to phenobarbital
9b. Hepatic (Mixed or Conjugated)
| Disorder | Defect | Feature |
|---|---|---|
| Dubin-Johnson Syndrome | Absent MRP2/ABCC2 | Conjugated hyperbilirubinemia; black liver; rotor of coproporphyrin metabolism |
| Rotor Syndrome | Defective OATP1B1/1B3 | Conjugated hyperbilirubinemia; no liver pigment |
| Viral hepatitis | Hepatocellular injury | Mixed hyperbilirubinemia |
| Drug-induced liver injury | Variable | Mixed |
9c. Post-hepatic (Conjugated/Direct Hyperbilirubinemia - Obstructive)
- Choledocholithiasis (common bile duct stones)
- Pancreatic carcinoma
- Cholangiocarcinoma
- Primary sclerosing cholangitis (PSC)
- Primary biliary cholangitis (PBC)
- Raised direct bilirubin, ALP, GGT
- Pale stools (no stercobilin)
- Dark urine (bilirubinuria - conjugated bilirubin is water-soluble, passes into urine)
- Pruritus (bile acid accumulation in skin)
- Fat-soluble vitamin deficiency (A, D, E, K) → coagulopathy, night blindness, osteoporosis
10. Disturbances in Bile Acid Metabolism (Clinical)
| Condition | Mechanism | Clinical Impact |
|---|---|---|
| Primary biliary cholangitis | Autoimmune bile duct destruction | Intrahepatic cholestasis, pruritus, fat malabsorption |
| Primary sclerosing cholangitis | Inflammatory bile duct strictures | Cholestasis, risk of cholangiocarcinoma |
| Intrahepatic cholestasis of pregnancy | FIC1/MDR3/BSEP mutations + estrogen | Pruritus, preterm birth risk |
| Ileal resection | Interrupts active bile acid reabsorption | Bile acid diarrhea; fat malabsorption if >100 cm resected |
| Inborn errors of bile acid synthesis (9 known) | Enzymatic defects in CYP7A1 pathway | Neonatal hepatitis, fat malabsorption, neurologic defects |
| BSEP deficiency (PFIC type 2) | Absent ABCB11 | Progressive familial intrahepatic cholestasis, cirrhosis |
| MDR3 deficiency (PFIC type 3) | Absent ABCB4 (phospholipid pump) | Cholestasis, low phospholipid bile → gallstones |
11. Gallstone Formation (Cholelithiasis)
- Supersaturation of bile with cholesterol (lithogenic bile) → nucleation → stone growth
- Favored by ↑ cholesterol secretion (obesity), ↓ bile acid pool (ileal disease), ↓ bile flow
- Cholesterol mole% in bile rises from normal 4% to 8-10% in lithogenic state
- Excessive unconjugated bilirubin production → supersaturation → precipitation as bilirubin calcium salts
- Black pigment stones: sickle cell disease, hereditary spherocytosis, cirrhosis
- Brown pigment stones: biliary tract infection, bile stasis
12. Bile Acid Signaling Functions (Beyond Digestion)
| Receptor | Location | Function |
|---|---|---|
| FXR (NR1H4) | Liver, intestine | Regulates bile acid synthesis (CYP7A1), transport, lipid metabolism |
| TGR5 (GPBAR1) | Intestine, gallbladder, brown adipose tissue | Stimulates GLP-1 secretion, regulates energy metabolism, intestinal motility |
| VDR (NR1I1) | Multiple tissues | Bile acid detoxification (especially LCA) |
| PXR (NR1I2) | Liver | Detoxification of secondary bile acids |
13. Neonatal Jaundice
- Peaks at day 3-5 in term infants
- Due to: high RBC breakdown rate, immature UGT1A1 activity, higher bilirubin production, lack of intestinal bacteria (less urobilinogen formation)
- Treated with phototherapy (450 nm light converts Z-Z bilirubin to more water-soluble E-E configuration)
Summary Table: Key Enzymes and Transporters
| Step | Protein | Clinical Mutation |
|---|---|---|
| Rate-limiting bile acid synthesis | CYP7A1 | Loss → hypercholesterolemia |
| Bile acid conjugation | BAAT | Defect → fat malabsorption |
| Hepatic bile salt uptake | NTCP (SLC10A1) | NTCP mutations → neonatal cholestasis |
| Canalicular bile salt export | BSEP (ABCB11) | Loss → PFIC type 2 |
| Phospholipid export | MDR3 (ABCB4) | Loss → PFIC type 3, low-phospholipid gallstones |
| Bilirubin conjugation | UGT1A1 | Crigler-Najjar I & II, Gilbert |
| Bilirubin canalicular export | MRP2 (ABCC2) | Loss → Dubin-Johnson |
| Bilirubin sinusoidal uptake | OATP1B1/1B3 | Loss → Rotor |
| Ileal bile acid reabsorption | ASBT (SLC10A2) | Loss → bile acid diarrhea, fat malabsorption |
- Sleisenger and Fordtran's Gastrointestinal and Liver Disease - Chapter 64: Bile Acid Synthesis and Metabolism
- Harrison's Principles of Internal Medicine 22E - Bile Secretion and Composition
- Tietz Textbook of Laboratory Medicine, 7th Ed. - Bilirubin and Bile Acids
- Medical Physiology (Boron & Boulpaep) - Enterohepatic Circulation