
medical biochemistry detailed notes
Which biochemistry topic(s) do you want detailed notes on? · What level are these notes for?
medical biochemistry detailed notes for mls year 1
glycolysis metabolic pathway diagram
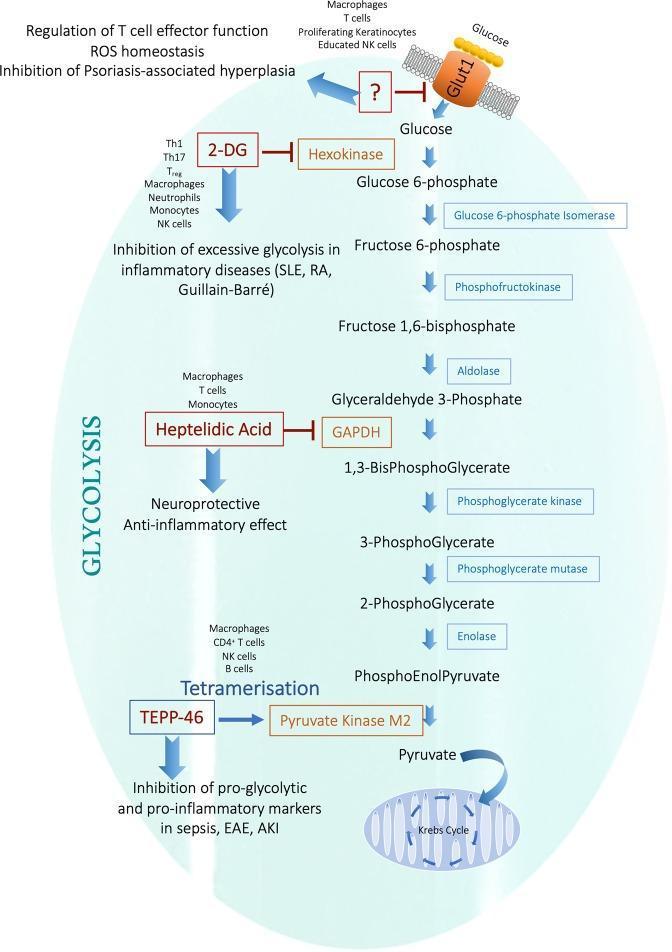
This pathophysiology diagram illustrates the glycolysis pathway as a therapeutic target for anti-inflammatory strategies. The metabolic flowchart depicts the sequence from glucose entry via the Glut1 transporter through various intermediates including glucose-6-phosphate, fructose-1,6-bisphosphate, and glyceraldehyde-3-phosphate, culminating in pyruvate entry into the Krebs cycle within the mitochondria. Key regulatory interventions are highlighted: 2-DG (2-deoxyglucose) inhibiting hexokinase to treat inflammatory diseases like SLE, RA, and Guillain-Barré; Heptelidic Acid inhibiting GAPDH for neuroprotective and anti-inflammatory effects; and TEPP-46 promoting the tetramerization of Pyruvate Kinase M2 to inhibit pro-inflammatory markers in sepsis, EAE, and AKI. The diagram identifies specific immune cell types affected by these interventions, such as Th1, Th17, macrophages, and NK cells. The educational focus is on how modulating metabolic enzymes can alter immune cell phenotype and manage systemic inflammatory conditions.
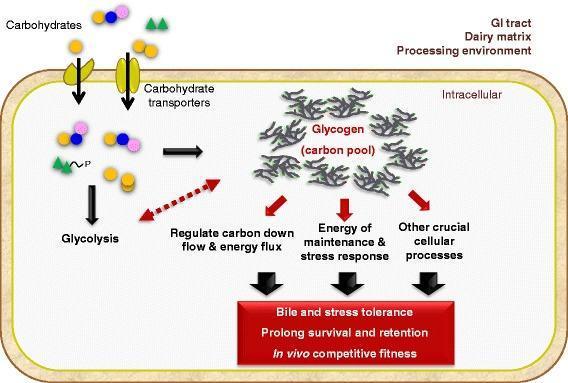
This pathophysiology diagram illustrates the metabolic mechanisms of the glycogen pathway in Lactobacillus acidophilus and its role in probiotic functionality. The diagram shows carbohydrate substrates being imported into the intracellular space through membrane-bound carbohydrate transporters. Once inside, these substrates follow two primary pathways: immediate metabolic processing via glycolysis or diversion to the glycogen biosynthetic pathway to form an intracellular 'carbon pool'. A bidirectional red arrow indicates a regulatory feedback loop between glycolysis and glycogen storage to modulate carbon downflow and energy flux. The glycogen pool is shown to serve three critical functions: regulation of metabolic flux, providing energy for maintenance and stress response, and supporting other crucial cellular processes. These physiological roles collectively contribute to the bacterium's clinical and probiotic attributes, including enhanced bile and stress tolerance, prolonged survival and retention in the GI tract, and improved in vivo competitive fitness within diverse environments such as the dairy matrix and processing facilities.
TCA citric acid cycle Krebs cycle diagram
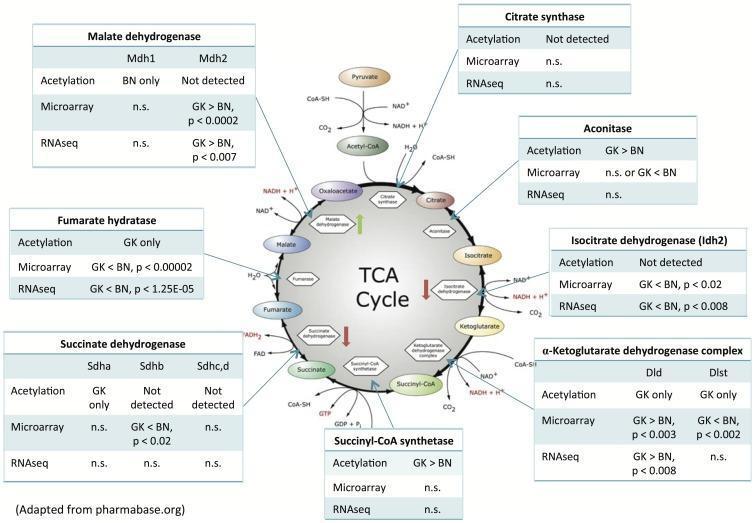
This pathophysiology diagram illustrates the integration of transcriptomic and proteomic data within the Tricarboxylic Acid (TCA) cycle, comparing diabetic Goto-Kakizaki (GK) and Brown Norway (BN) rat livers. The central circular diagram depicts the metabolic intermediates of the Krebs cycle, including Citrate, Isocitrate, Ketoglutarate, Succinyl-CoA, Succinate, Fumarate, Malate, and Oxaloacetate. Surrounding tables provide comparative data for key enzymes: Citrate Synthase, Aconitase, Isocitrate Dehydrogenase (Idh2), alpha-Ketoglutarate Dehydrogenase complex (Dld/Dlst), Succinyl-CoA synthetase, Succinate Dehydrogenase (Sdha/b/c/d), Fumarate Hydratase, and Malate Dehydrogenase (Mdh1/2). Each table details acetylation levels, microarray expression, and RNA sequencing results. Vertical arrows within the cycle indicate the impact of acetylation on enzyme activity: a green upward arrow for Malate Dehydrogenase denotes activation, while red downward arrows for Isocitrate Dehydrogenase and Succinate Dehydrogenase denote inhibition. This medical infographic serves as a model for systems-level analysis of metabolic regulation, specifically highlighting how post-translational modifications and mRNA expression levels differ in a diabetic state versus a control.
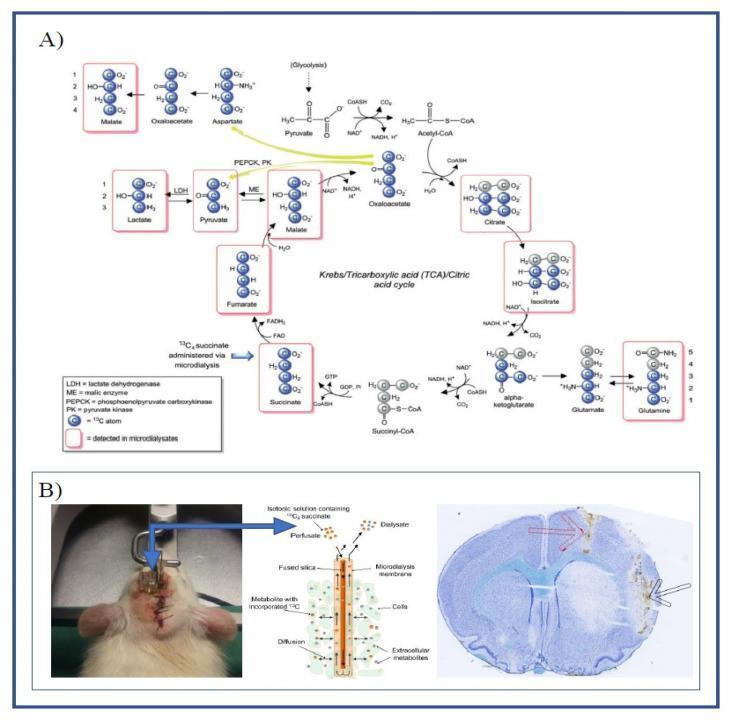
Educational composite detailing metabolic tracing and experimental neurology. Panel A features a Pathophysiology Diagram of the Tricarboxylic Acid (TCA) cycle, specifically illustrating the metabolic fate of 13C4-labeled succinate. Carbon atoms are represented as spheres, with blue-filled circles indicating the 13C label. The diagram tracks the label through cycle intermediates (fumarate, malate, oxaloacetate, citrate, isocitrate, alpha-ketoglutarate) and spin-out pathways leading to lactate, pyruvate, aspartate, glutamate, and glutamine. Red rectangular outlines highlight metabolites detectable via LC-MS analysis. Labeled enzymes include LDH, ME, PEPCK, and PK. Panel B demonstrates the Experimental Setup in a rat model of cerebral ischemia. It includes a Clinical Photograph of guide cannulas implanted in the left hemisphere, a schematic of a microdialysis catheter showing substrate diffusion across a semi-permeable membrane into brain tissue, and a Diagnostic Histology image (Nissl-stained cryosection). The histology shows the striatum with markers indicating the microdialysis catheter (black arrow) and ET-1 infusion site (red arrow), used to study mitochondrial function in vivo.
enzyme kinetics Michaelis Menten Lineweaver Burk plot
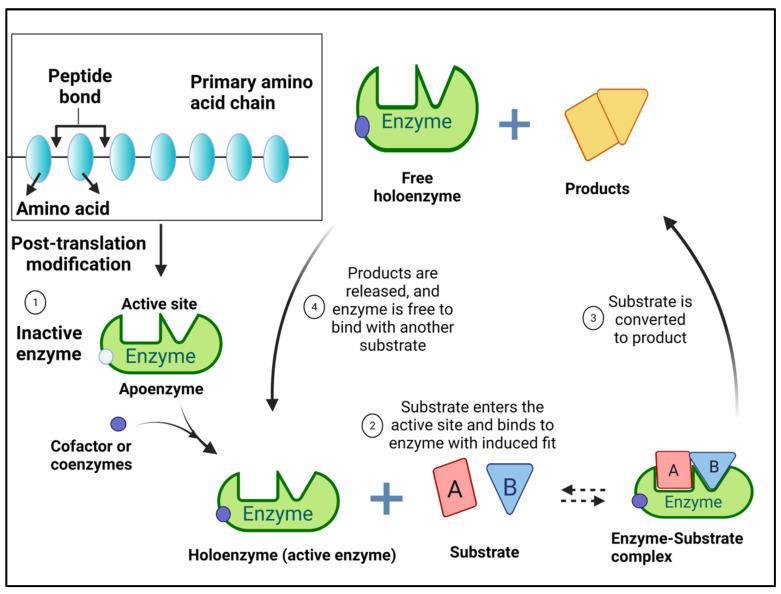
This pathophysiology diagram illustrates the life cycle of an enzyme, from primary synthesis to catalytic action. The process begins with a primary amino acid chain joined by peptide bonds, which undergoes post-translational modification to form an inactive apoenzyme. The activation phase shows a cofactor or coenzyme (blue sphere) binding to the apoenzyme to create a functional holoenzyme. The catalytic cycle follows the Michaelis-Menten and Induced Fit models in four numbered stages: (1) Formation of the active holoenzyme; (2) Binding of a two-part substrate (labeled A and B) to the active site, inducing a conformational change to form an enzyme-substrate complex; (3) Catalytic conversion of the substrate into products; and (4) Release of the products (gold structures), restoring the free holoenzyme for subsequent reactions. This schematic is designed for basic biochemistry and medical physiology education, emphasizing the structural requirements for enzymatic catalysis and the specific interactions within the active site.
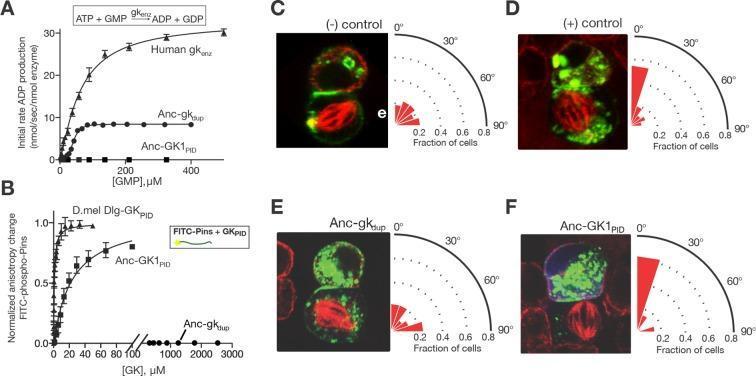
Educational figure illustrating the evolutionary transition from metabolic enzyme to spindle-orientation scaffold in the guanylate kinase (GK) family. Panel A shows an enzyme kinetics plot comparing initial ADP production rates; the human enzyme and ancestral Anc-gkdup show activity, while the later Anc-GK1PID is inactive. Panel B presents a fluorescence anisotropy assay demonstrating that Anc-GK1PID acquired Pins-binding affinity, unlike its predecessor. Panels C-F display immunocytochemical images of mitotic S2 cells alongside radial histograms quantifying spindle orientation. In these panels, the mitotic spindle is visualized in red (tubulin) and the cortical Pins crescent in green (GFP-tagged Pins-Ecd). Panels D (+) control and F (Anc-GK1PID) show robust spindle alignment, evidenced by high-intensity red segments concentrated near 0 degrees on the radial histograms. Conversely, Panel C (-) control and Panel E (Anc-gkdup) exhibit randomized spindle orientation with broader, lower-intensity angular distributions. The figure demonstrates how a specific protein domain evolved to scaffold the mitotic apparatus, a critical mechanism for organized animal tissue development and asymmetric cell division.
MEDICAL BIOCHEMISTRY - MLS YEAR 1
Comprehensive Lecture Notes
UNIT 1: CARBOHYDRATES
1.1 Classification of Carbohydrates
| Type | Units | Examples |
|---|---|---|
| Monosaccharides | 1 | Glucose, Fructose, Galactose |
| Disaccharides | 2 | Sucrose, Lactose, Maltose |
| Oligosaccharides | 3-10 | Raffinose |
| Polysaccharides | >10 | Starch, Glycogen, Cellulose |
- Aldoses - contain an aldehyde group (e.g., glucose, galactose)
- Ketoses - contain a ketone group (e.g., fructose)
- Compounds with the same chemical formula but different structures = isomers
- Glucose, fructose, mannose, and galactose all share the formula C₆H₁₂O₆
- Epimers differ in configuration around only one specific carbon (e.g., glucose and galactose differ at C-4)
- Pentoses (C5): Ribose (in RNA), Deoxyribose (in DNA), Xylulose
- Hexoses (C6): Glucose (blood sugar), Galactose (from lactose), Fructose (from sucrose/fruit)
1.2 Glycolysis (Embden-Meyerhof Pathway)
Net reaction: Glucose + 2 NAD⁺ + 2 ADP + 2 Pi → 2 Pyruvate + 2 NADH + 2 ATP + 2 H₂O
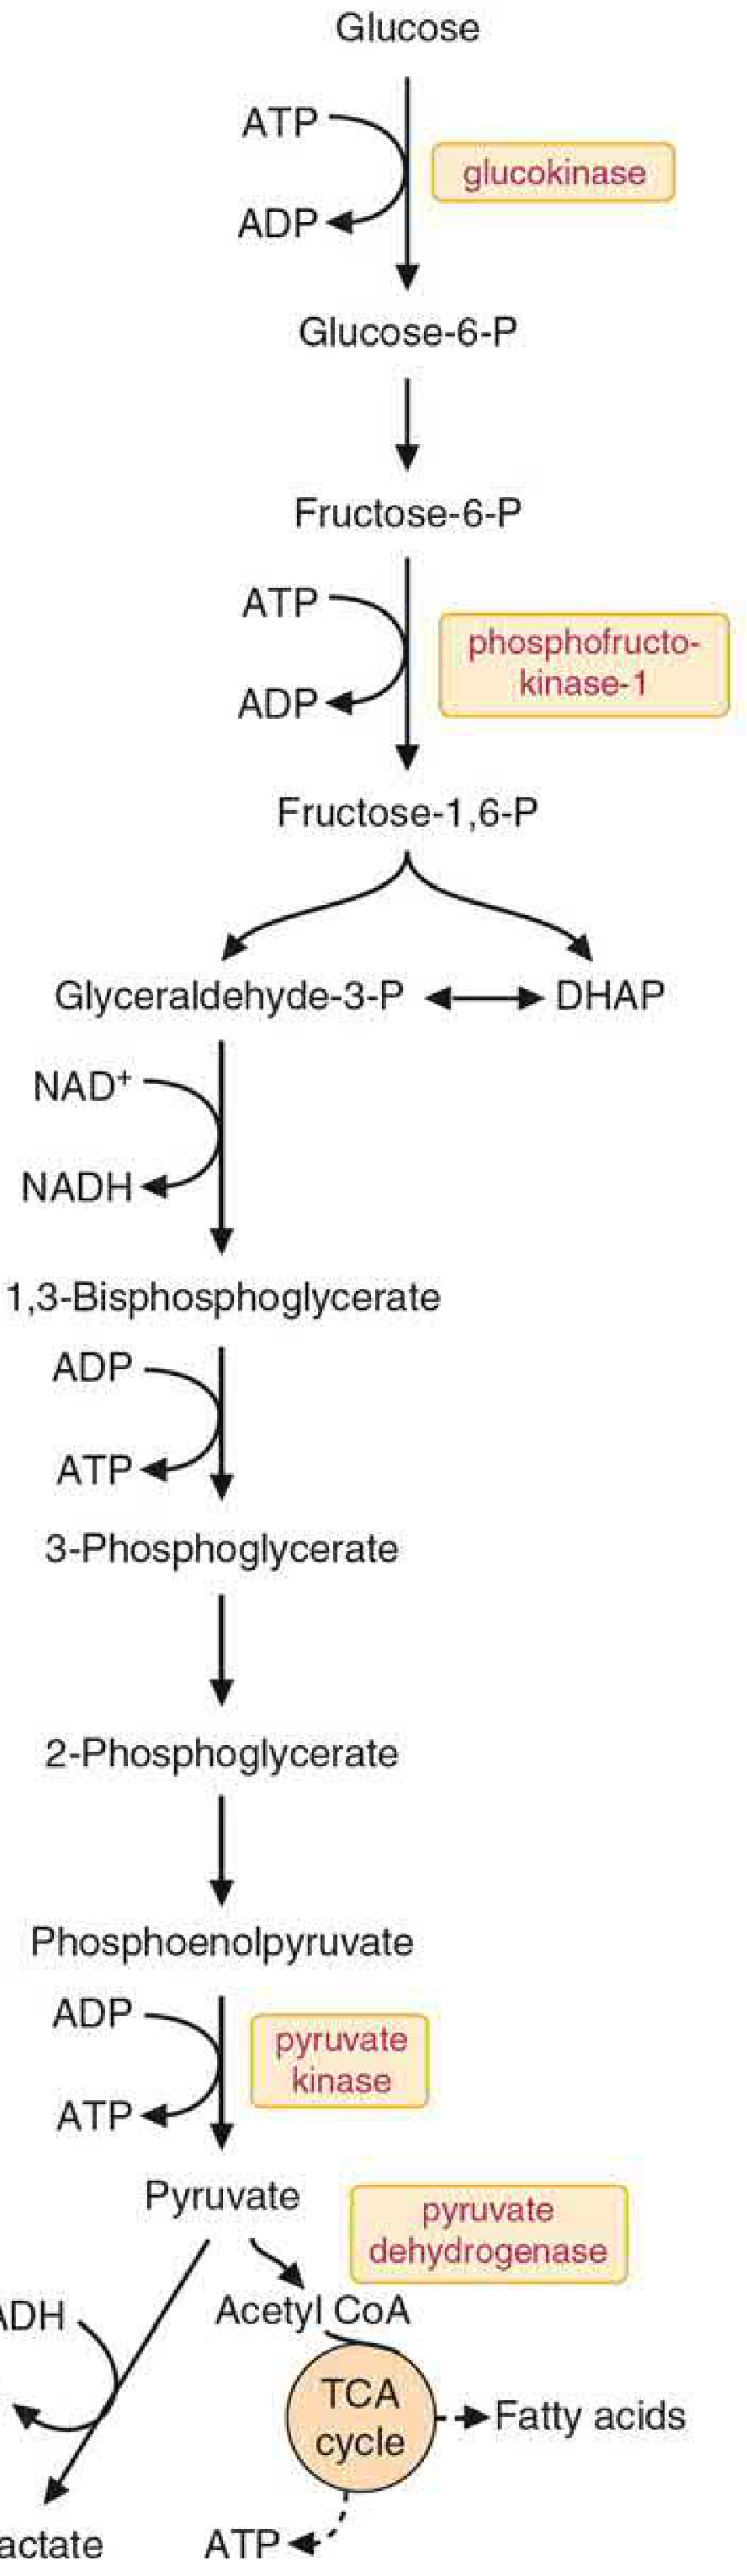
- Glucose → Glucose-6-phosphate (enzyme: Hexokinase/Glucokinase; uses 1 ATP)
- Glucose-6-phosphate → Fructose-6-phosphate (enzyme: Phosphoglucose isomerase)
- Fructose-6-phosphate → Fructose-1,6-bisphosphate (enzyme: Phosphofructokinase-1 [PFK-1]; uses 1 ATP) - key regulatory step
- Fructose-1,6-bisphosphate → DHAP + Glyceraldehyde-3-phosphate (enzyme: Aldolase)
- DHAP → Glyceraldehyde-3-phosphate (enzyme: Triose phosphate isomerase)
| Enzyme | Activated by | Inhibited by |
|---|---|---|
| Hexokinase | - | Glucose-6-phosphate (product inhibition) |
| PFK-1 (key regulator) | AMP, ADP, Fructose-2,6-bisphosphate | ATP, citrate |
| Pyruvate kinase | Fructose-1,6-bisphosphate | ATP, alanine |
- Aerobic conditions: Pyruvate → Acetyl-CoA (via pyruvate dehydrogenase complex) → TCA cycle
- Anaerobic conditions: Pyruvate → Lactate (via lactate dehydrogenase; regenerates NAD⁺)
- In yeast: Pyruvate → Ethanol + CO₂ (fermentation)
1.3 Gluconeogenesis
Location: Primarily liver (90% in overnight fast); kidney cortex during prolonged fasting (>48 hrs, ~40%)
When it occurs: During fasting, starvation, prolonged exercise, low-carbohydrate diets
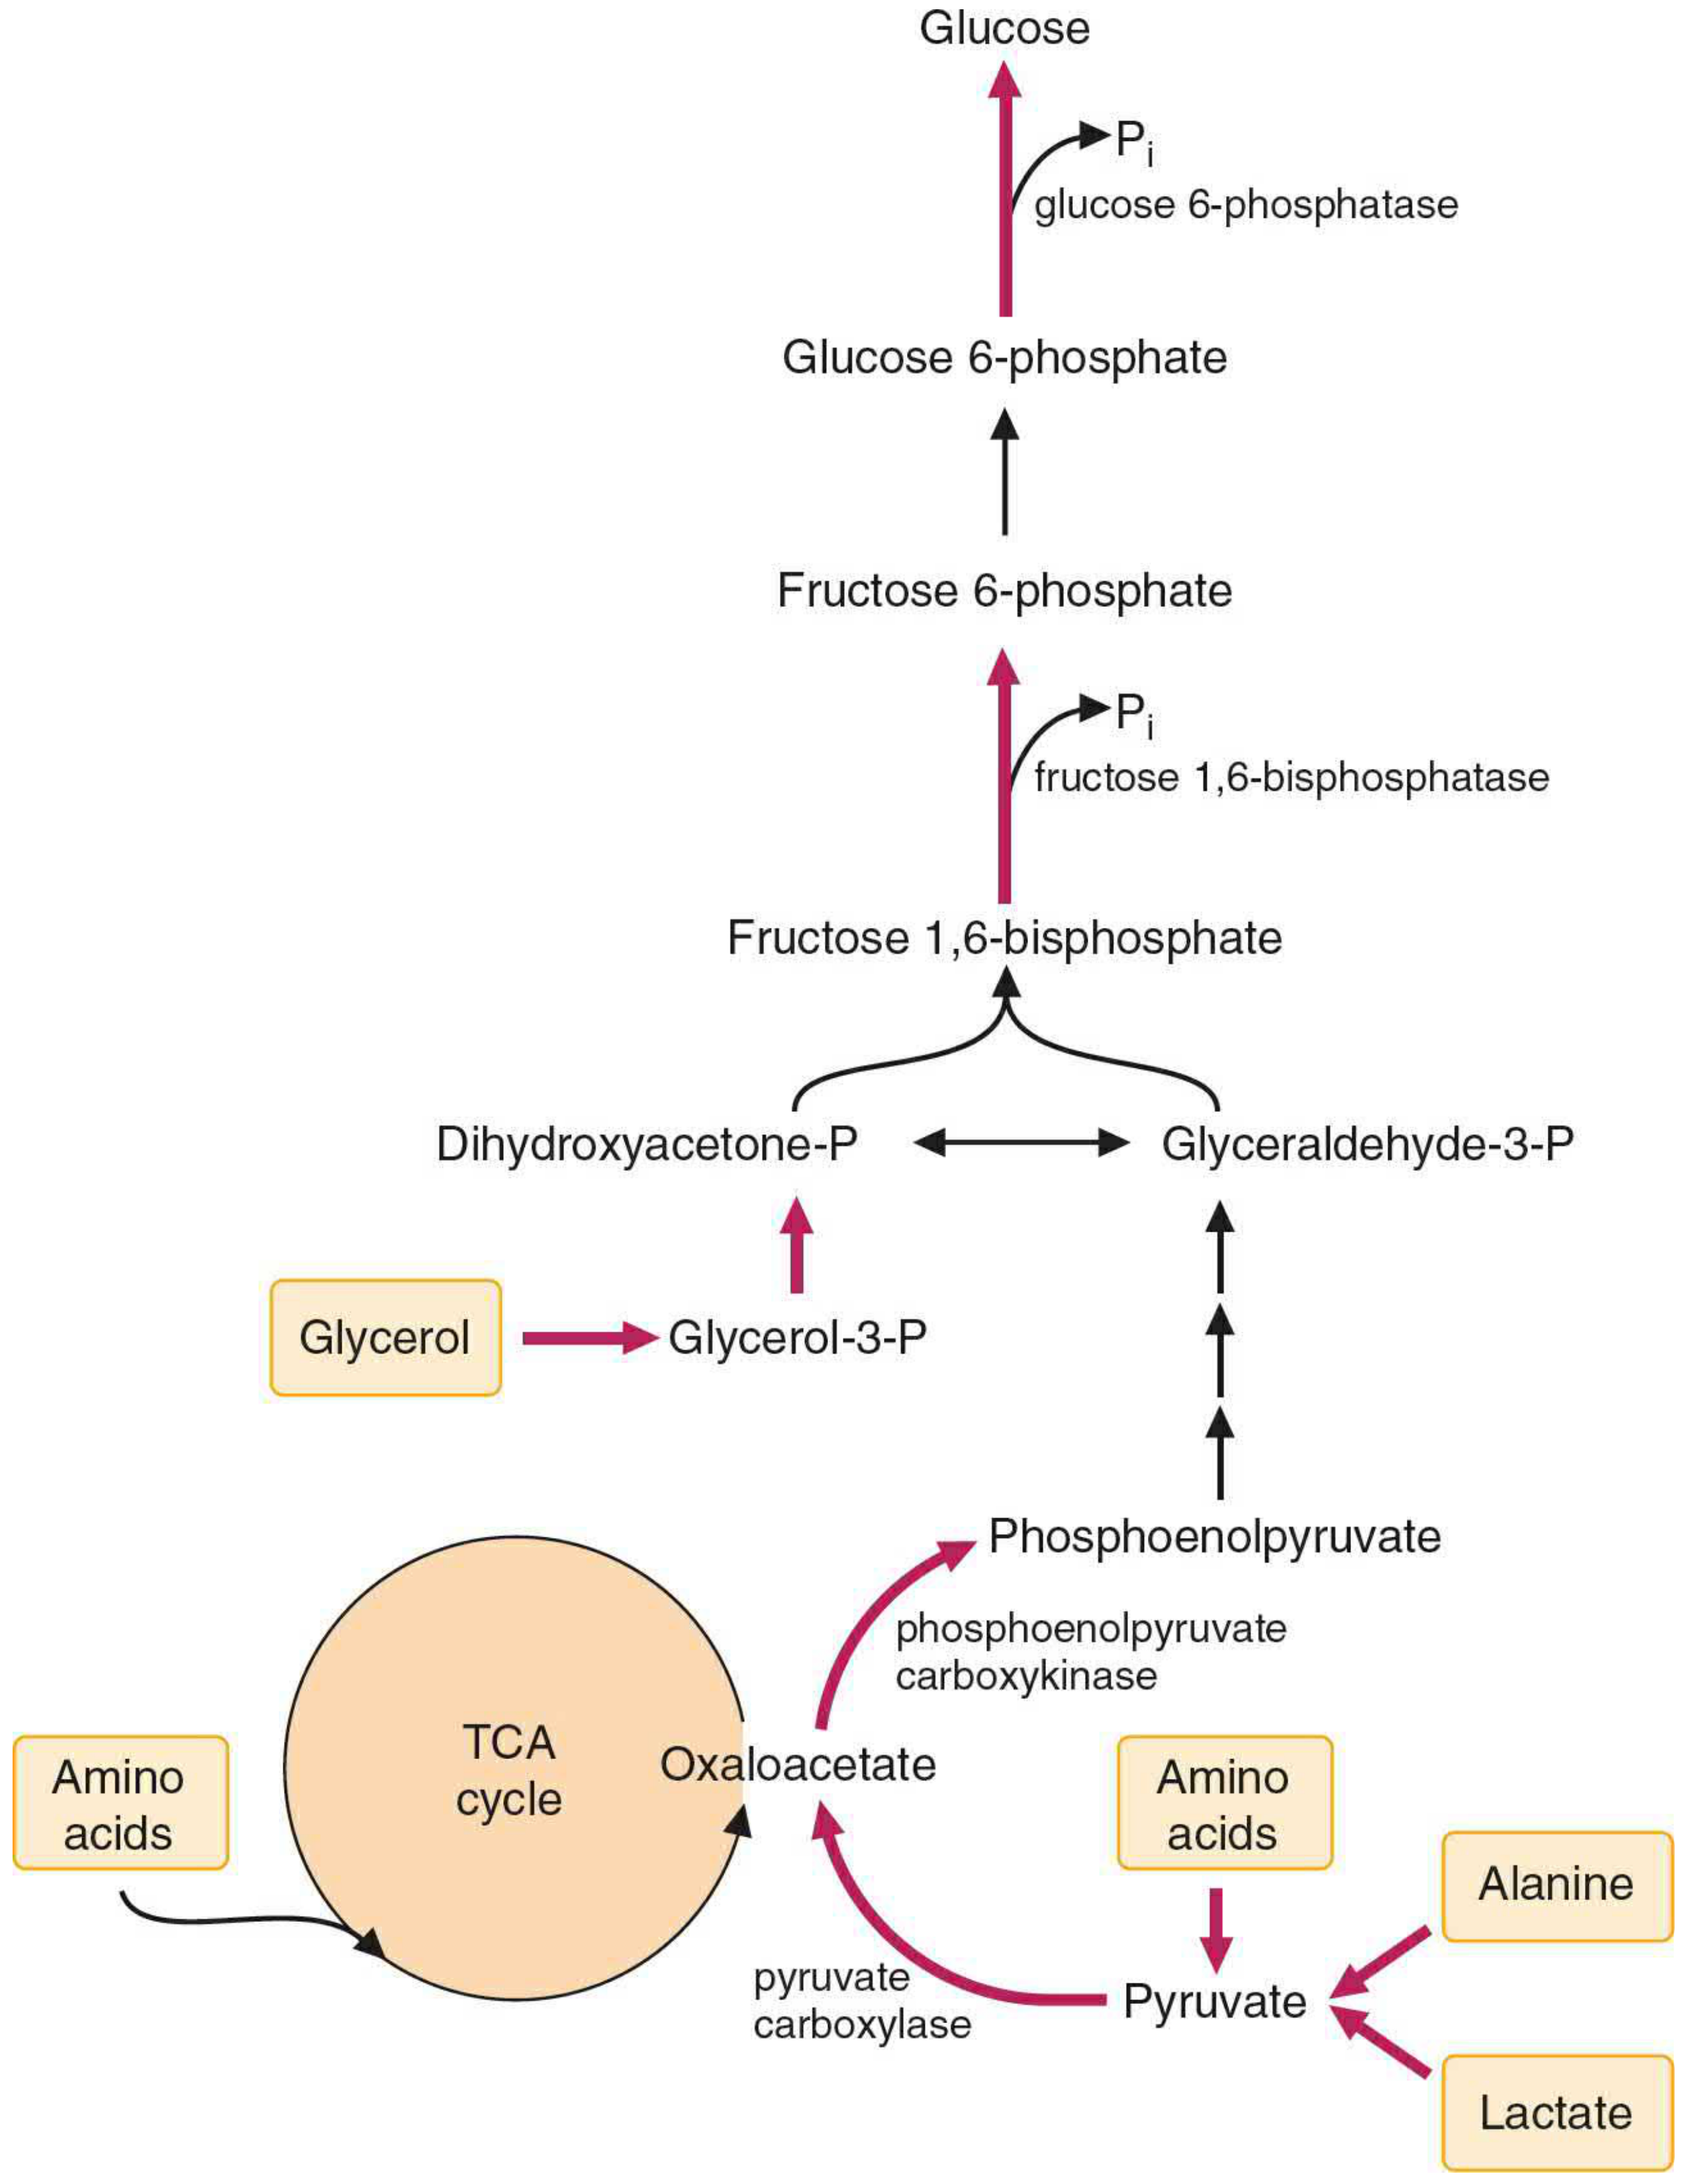
- Lactate - from anaerobic glycolysis in RBCs and exercising muscle (Cori cycle: lactate → liver → glucose → back to muscle)
- Glycerol - from hydrolysis of triacylglycerols in adipose tissue → glycerol-3-phosphate → DHAP
- Amino acids - most are glucogenic (except leucine and lysine which are purely ketogenic)
- Odd-chain fatty acids - yield propionyl-CoA → succinyl-CoA → oxaloacetate
| Glycolysis Step | Enzyme | Gluconeogenesis Bypass | Enzyme(s) |
|---|---|---|---|
| PEP → Pyruvate | Pyruvate kinase | Pyruvate → OAA → PEP | Pyruvate carboxylase (mito) + PEPCK (cyto) |
| Fructose-6-P → Fructose-1,6-BP | PFK-1 | Fructose-1,6-BP → Fructose-6-P | Fructose-1,6-bisphosphatase |
| Glucose-6-P → Glucose | Hexokinase | Glucose-6-P → Glucose | Glucose-6-phosphatase (ER; liver/kidney only) |
Key point: Tissues lacking glucose-6-phosphatase (brain, muscle) cannot release free glucose into blood.
1.4 Glycogen Metabolism
- Glucose-6-P → Glucose-1-P (phosphoglucomutase)
- Glucose-1-P + UTP → UDP-glucose (UDP-glucose pyrophosphorylase)
- UDP-glucose added to chain: Glycogen synthase (adds α-1,4 linkages)
- Branching enzyme creates α-1,6 branch points every 8-10 residues
- Glycogen phosphorylase cleaves α-1,4 bonds → glucose-1-phosphate
- Debranching enzyme handles α-1,6 branch points (releases free glucose)
- Glucose-1-P → Glucose-6-P → Glucose (in liver, for blood glucose maintenance)
| Hormone | Effect | Mechanism |
|---|---|---|
| Insulin (fed state) | Promotes glycogen synthesis | Activates glycogen synthase |
| Glucagon (fasting) | Promotes glycogenolysis | Activates phosphorylase (via cAMP) |
| Epinephrine (stress) | Promotes glycogenolysis (muscle & liver) | Activates phosphorylase (via cAMP) |
| Disease | Enzyme Deficiency | Tissue | Lab Finding |
|---|---|---|---|
| Von Gierke (Type I) | Glucose-6-phosphatase | Liver, kidney | Hypoglycemia, lactic acidosis |
| Pompe (Type II) | Lysosomal α-1,4-glucosidase | All tissues | Cardiomegaly |
| McArdle (Type V) | Muscle phosphorylase | Muscle | Myoglobinuria on exercise |
1.5 Pentose Phosphate Pathway (HMP Shunt)
Purpose: Produces NADPH and ribose-5-phosphate (NOT for ATP)
- Oxidative phase (irreversible): Glucose-6-P → Ribulose-5-P + 2 NADPH + CO₂
- Key enzyme: Glucose-6-phosphate dehydrogenase (G6PD)
- Non-oxidative phase (reversible): Interconverts sugars; produces ribose-5-P
- NADPH - used in fatty acid synthesis, steroid synthesis, glutathione regeneration, respiratory burst (neutrophils)
- Ribose-5-phosphate - nucleotide and nucleic acid synthesis
- X-linked recessive; most common enzyme deficiency worldwide
- RBCs cannot regenerate NADPH → cannot recycle glutathione → hemolytic anemia
- Triggered by: oxidant drugs (primaquine, dapsone), fava beans, infections
- Lab: Heinz bodies (denatured Hb), bite cells, low G6PD assay
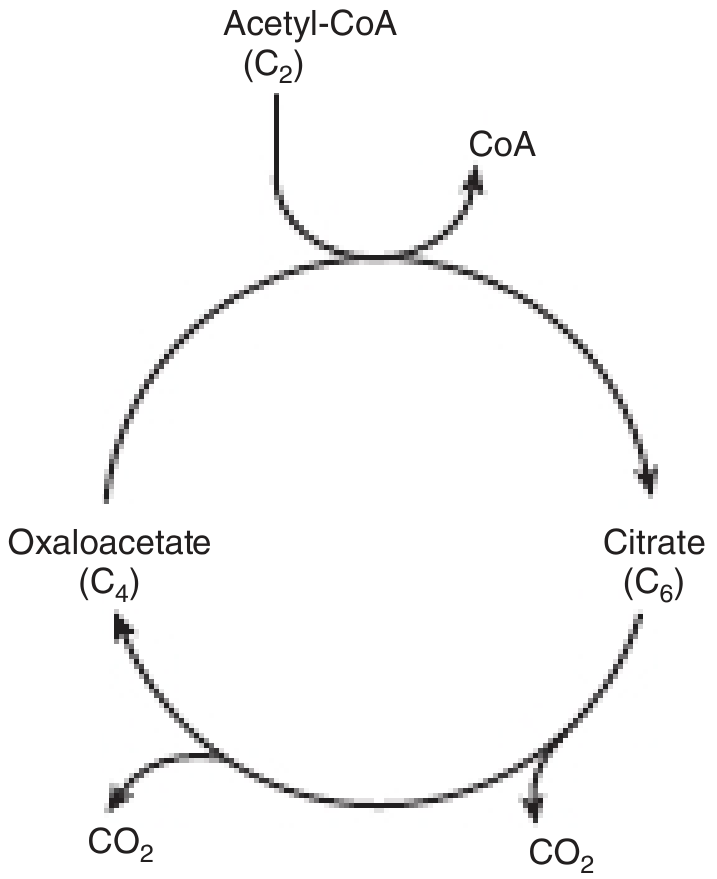
UNIT 2: THE CITRIC ACID CYCLE (TCA / KREBS CYCLE)
2.1 Overview
Purpose: Final common pathway for oxidation of carbohydrates, fats, and proteins; generates reducing equivalents (NADH, FADH₂) for oxidative phosphorylation
2.2 The 8 Steps of the TCA Cycle
| Step | Reaction | Enzyme | Cofactors/Products |
|---|---|---|---|
| 1 | Oxaloacetate + Acetyl-CoA → Citrate | Citrate synthase | - |
| 2 | Citrate → Isocitrate | Aconitase | - |
| 3 | Isocitrate → α-Ketoglutarate | Isocitrate dehydrogenase | NADH, CO₂ |
| 4 | α-Ketoglutarate → Succinyl-CoA | α-Ketoglutarate dehydrogenase | NADH, CO₂ |
| 5 | Succinyl-CoA → Succinate | Succinyl-CoA synthetase | GTP |
| 6 | Succinate → Fumarate | Succinate dehydrogenase | FADH₂ |
| 7 | Fumarate → Malate | Fumarase | - |
| 8 | Malate → Oxaloacetate | Malate dehydrogenase | NADH |
- 3 NADH + 1 FADH₂ + 1 GTP + 2 CO₂
- Glycolysis: 2 ATP + 2 NADH
- Pyruvate dehydrogenase: 2 NADH
- TCA (x2): 6 NADH + 2 FADH₂ + 2 GTP
- Total: ~30-32 ATP
- Activated by: ADP, NAD⁺, Ca²⁺ (in muscle)
- Inhibited by: ATP, NADH (product inhibition)
- Rate-limiting enzymes: Isocitrate dehydrogenase, α-Ketoglutarate dehydrogenase, Citrate synthase
- Anaplerosis = adding carbon to TCA cycle (e.g., pyruvate → oxaloacetate via pyruvate carboxylase)
- Cataplerosis = withdrawing carbon (e.g., OAA → PEP for gluconeogenesis)
- These must be equal to sustain the cycle
UNIT 3: LIPID METABOLISM
3.1 Fatty Acid Structure and Classification
Unsaturated fatty acids - one or more double bonds
- Monounsaturated: one double bond (e.g., oleic acid C18:1)
- Polyunsaturated: multiple double bonds (e.g., linoleic acid C18:2)
- Linoleic acid (omega-6) - precursor of arachidonic acid → prostaglandins
- α-Linolenic acid (omega-3) - precursor of EPA and DHA
3.2 Beta-Oxidation of Fatty Acids
Activation: Fatty acid + CoA → Fatty acyl-CoA (in cytoplasm; uses 2 ATP equivalents)
Transport: Long-chain fatty acids enter mitochondria via carnitine shuttle (carnitine acyltransferase I & II)
- Oxidation → FADH₂
- Hydration
- Oxidation → NADH
- Thiolysis → Acetyl-CoA + shortened acyl-CoA
- 7 cycles → 7 FADH₂ + 7 NADH + 8 Acetyl-CoA
- Each Acetyl-CoA via TCA: ~10 ATP
- Total: ~106 ATP (net ~104 after activation cost)
- Carnitine transport = rate-limiting step
- Malonyl-CoA (from fatty acid synthesis) inhibits carnitine acyltransferase I → prevents futile cycling of synthesis + oxidation
3.3 Ketone Body Metabolism
Ketone bodies: Acetoacetate, β-Hydroxybutyrate, Acetone
- Excess Acetyl-CoA (from β-oxidation when OAA is depleted) → HMG-CoA → Acetoacetate → β-Hydroxybutyrate
- Fuel for brain, heart, kidney, skeletal muscle during fasting
- Brain uses ketones after 3+ days of starvation
- Uncontrolled Type 1 diabetes: no insulin → excessive fatty acid oxidation → ketone overproduction
- Signs: acetone breath (fruity), Kussmaul respirations (deep rapid breathing to blow off CO₂), metabolic acidosis
- Lab: high blood glucose, ketonemia, ketonuria, low blood pH (<7.3), low bicarbonate
3.4 Fatty Acid Synthesis
Starting material: Acetyl-CoA (from mitochondria, transported via citrate shuttle)
Key enzyme: Fatty acid synthase (FAS) - multi-enzyme complex
Cofactors needed: NADPH (from HMP shunt), Biotin (B7), Pantothenic acid (B5)
- Acetyl-CoA + CO₂ → Malonyl-CoA (enzyme: Acetyl-CoA carboxylase; requires biotin; rate-limiting)
- Condensation + reduction + dehydration + reduction (repeat 7 times to produce palmitate C16)
- Stimulated by: insulin, high glucose (feeds into citrate shuttle)
- Inhibited by: glucagon, epinephrine, AMPK
3.5 Cholesterol Metabolism
Key regulatory enzyme: HMG-CoA reductase (target of statins)
| Lipoprotein | Origin | Major Lipid | Function |
|---|---|---|---|
| Chylomicrons | Intestine | Triglycerides (dietary) | Transport dietary fat to tissues |
| VLDL | Liver | Triglycerides (endogenous) | Transport liver TG to tissues |
| IDL | From VLDL | TG + Cholesterol | Precursor to LDL |
| LDL | From IDL | Cholesterol | Delivers cholesterol to cells |
| HDL | Liver/intestine | Protein + cholesterol | Reverse cholesterol transport |
- Apo B-100: LDL/VLDL receptor binding
- Apo B-48: Chylomicron structural protein
- Apo C-II: Activates lipoprotein lipase
- Apo E: Remnant receptor binding (VLDL/IDL/chylomicron remnants)
- Apo A-I: HDL structural protein; activates LCAT
UNIT 4: PROTEIN AND AMINO ACID METABOLISM
4.1 Classification of Amino Acids
| Type | Examples |
|---|---|
| Nonpolar/hydrophobic | Glycine, Alanine, Valine, Leucine, Isoleucine, Proline, Phenylalanine, Methionine, Tryptophan |
| Polar/uncharged | Serine, Threonine, Cysteine, Tyrosine, Asparagine, Glutamine |
| Positively charged (+) | Lysine, Arginine, Histidine |
| Negatively charged (-) | Aspartate, Glutamate |
Phenylalanine, Valine, Threonine, Tryptophan, Isoleucine, Methionine, Histidine, Arginine*, Leucine, Lysine
(*Arginine conditionally essential)
- Purely ketogenic: Leucine, Lysine
- Both glucogenic & ketogenic: Isoleucine, Phenylalanine, Tyrosine, Tryptophan, Threonine
- All others: Purely glucogenic
4.2 Nitrogen Metabolism and Transamination
Enzyme: Aminotransferases (transaminases)
Cofactor: Pyridoxal phosphate (PLP = Vitamin B6)
- Alanine + α-Ketoglutarate ⇌ Pyruvate + Glutamate (ALT / alanine aminotransferase)
- Aspartate + α-Ketoglutarate ⇌ OAA + Glutamate (AST / aspartate aminotransferase)
- Both elevated in liver disease (hepatitis)
- ALT is more liver-specific → preferred marker for hepatocellular damage
- AST:ALT ratio >2 suggests alcoholic liver disease
4.3 Oxidative Deamination and the Urea Cycle
Enzyme: Glutamate dehydrogenase (mitochondria; uses NAD⁺ or NADP⁺)
| Step | Location | Enzyme | Reaction |
|---|---|---|---|
| 1 | Mitochondria | Carbamoyl phosphate synthetase I | NH₃ + CO₂ → Carbamoyl phosphate |
| 2 | Mitochondria | Ornithine transcarbamylase (OTC) | Ornithine + Carbamoyl-P → Citrulline |
| 3 | Cytoplasm | Argininosuccinate synthetase | Citrulline + Aspartate → Argininosuccinate |
| 4 | Cytoplasm | Argininosuccinate lyase | Argininosuccinate → Arginine + Fumarate |
| 5 | Cytoplasm | Arginase | Arginine → Ornithine + Urea |
- Symptoms: vomiting, lethargy, intellectual disability, coma
- Most common: OTC deficiency (X-linked)
- Lab: elevated ammonia, elevated glutamine, low BUN
4.4 Amino Acid Catabolism - Key Pathways
- Primarily catabolized in muscle (liver has limited capacity)
- Defect: Maple Syrup Urine Disease (MSUD) - deficiency of branched-chain α-keto acid dehydrogenase; sweet-smelling urine, neurological damage
- Enzyme: Phenylalanine hydroxylase (requires BH4 cofactor)
- Deficiency: Phenylketonuria (PKU) - most common amino acid disorder; fair skin/hair, musty odor, intellectual disability; treat with low-Phe diet
- Requires B12 and folate (for remethylation to methionine)
- Requires B6 (for transsulfuration to cysteine)
- Homocystinuria - elevated homocysteine; cardiovascular risk, lens dislocation
UNIT 5: ENZYMES
5.1 Enzyme Structure and Function
Active site: Specific region where substrate binds and reaction occurs
Induced fit model: Active site changes shape to accommodate substrate
| Term | Definition | Example |
|---|---|---|
| Cofactor | Non-protein component required for activity | Metal ions (Zn²⁺, Mg²⁺, Fe²⁺) |
| Coenzyme (organic cofactor) | Organic molecule; usually derived from vitamins | NAD⁺ (B3), FAD (B2), CoA (B5) |
| Prosthetic group | Tightly bound cofactor | Heme in cytochrome P450 |
| Apoenzyme | Enzyme without cofactor (inactive) | - |
| Holoenzyme | Apoenzyme + cofactor (active) | - |
Multiple forms of an enzyme catalyzing the same reaction but with different kinetic properties and tissue distribution.
| Enzyme | Isoforms | Clinical Use |
|---|---|---|
| LDH | LDH-1 (heart), LDH-5 (liver) | Myocardial infarction, liver disease |
| CK | CK-MM (muscle), CK-MB (heart), CK-BB (brain) | AMI (CK-MB), muscular dystrophy (CK-MM) |
| ALP | Bone, liver, placenta, intestine | Bone disease, cholestasis |
| AST/ALT | Both elevated in liver damage | Hepatitis, cirrhosis |
5.2 Enzyme Kinetics
- Vmax - maximum reaction velocity when all enzyme is saturated with substrate
- Km (Michaelis constant) - substrate concentration at which v = Vmax/2; reflects enzyme-substrate affinity (low Km = high affinity)
- kcat (turnover number) - number of substrate molecules converted per enzyme molecule per second
- x-axis: 1/[S]; y-axis: 1/v
- x-intercept = -1/Km; y-intercept = 1/Vmax; slope = Km/Vmax
5.3 Enzyme Inhibition
| Type | Mechanism | Effect on Km | Effect on Vmax | Lineweaver-Burk |
|---|---|---|---|---|
| Competitive | Competes with substrate at active site; overcome by increasing [S] | Increased (apparent) | Unchanged | Lines meet on y-axis |
| Noncompetitive | Binds allosteric site; cannot be overcome by [S] | Unchanged | Decreased | Lines meet on x-axis |
| Uncompetitive | Binds only E-S complex | Decreased | Decreased | Parallel lines |
| Mixed | Binds E or E-S with different affinities | Changes | Decreased | Lines meet in second quadrant |
Mnemonics:
Competitive = Km ↑, Vmax same ("C for Changed Km")
Noncompetitive = Vmax ↓, Km same ("Non-violent = Km stays")
- Statins - competitive inhibitors of HMG-CoA reductase (treat hypercholesterolemia)
- Methotrexate - competitive inhibitor of dihydrofolate reductase (cancer, RA)
- Aspirin - irreversible inhibitor of cyclooxygenase (COX-1 and COX-2)
5.4 Enzyme Regulation
- Allosteric regulation - non-substrate molecules bind allosteric sites; change enzyme conformation
- Covalent modification - phosphorylation/dephosphorylation (e.g., glycogen phosphorylase)
- Proteolytic activation - zymogen (inactive precursor) activated by cleavage (e.g., trypsinogen → trypsin)
- Feedback inhibition - end-product inhibits enzyme earlier in pathway
- Gene expression - induction/repression of enzyme synthesis (slow response)
UNIT 6: VITAMINS
6.1 Water-Soluble Vitamins (B-complex and Vitamin C)
| Vitamin | Active Form | Key Function | Deficiency Disease | Lab Coenzyme Role |
|---|---|---|---|---|
| B1 (Thiamine) | TPP (thiamine pyrophosphate) | Oxidative decarboxylation (PDH, α-KGD, transketolase) | Beriberi, Wernicke-Korsakoff | Carbohydrate metabolism |
| B2 (Riboflavin) | FAD, FMN | Electron carrier in β-oxidation, ETC | Ariboflavinosis (angular cheilitis) | β-Oxidation (FADH₂) |
| B3 (Niacin) | NAD⁺, NADP⁺ | Electron carrier in TCA, glycolysis | Pellagra (dermatitis, diarrhea, dementia) | Redox reactions |
| B5 (Pantothenic acid) | Coenzyme A | Acyl group carrier (acetyl-CoA, succinyl-CoA) | Rare; burning feet syndrome | Fatty acid metabolism |
| B6 (Pyridoxine) | PLP (pyridoxal phosphate) | Transamination, decarboxylation of amino acids, heme synthesis | Sideroblastic anemia, peripheral neuropathy | Aminotransferases (ALT, AST) |
| B7 (Biotin) | Biocytin | CO₂ carrier in carboxylations (ACC, pyruvate carboxylase) | Dermatitis, alopecia (raw egg whites bind avidin) | Carboxylation reactions |
| B9 (Folate) | THF (tetrahydrofolate) | One-carbon transfers; nucleotide synthesis | Megaloblastic anemia, neural tube defects | DNA synthesis |
| B12 (Cobalamin) | Methylcobalamin, Adenosylcobalamin | Remethylation of homocysteine; odd-chain FA metabolism | Megaloblastic anemia + subacute combined degeneration of cord | Neurological function |
| C (Ascorbic acid) | Ascorbic acid | Collagen synthesis; antioxidant; iron absorption (Fe³⁺ → Fe²⁺) | Scurvy (bleeding gums, perifollicular hemorrhage) | Prolyl hydroxylase cofactor |
- B12 and Folate trap: B12 deficiency traps folate as methyl-THF (methyl trap) → functional folate deficiency → megaloblastic anemia
- Both B12 and folate deficiencies cause megaloblastic anemia; only B12 deficiency causes neurological symptoms
- Lab distinction: MMA (methylmalonic acid) elevated in B12 deficiency only; homocysteine elevated in both
6.2 Fat-Soluble Vitamins (A, D, E, K)
| Vitamin | Active Form | Key Function | Deficiency | Toxicity |
|---|---|---|---|---|
| A (Retinol) | Retinal (vision), Retinoic acid (gene expression) | Night vision, epithelial integrity, immune function | Night blindness, Bitot's spots, xerophthalmia | Hepatotoxicity, teratogenicity |
| D (Calciferol) | 1,25-(OH)₂D₃ (Calcitriol) | Ca²⁺ and PO₄³⁻ absorption from gut; bone mineralization | Rickets (children), Osteomalacia (adults) | Hypercalcemia, renal stones |
| E (Tocopherol) | α-Tocopherol | Antioxidant (protects cell membranes from lipid peroxidation) | Hemolytic anemia, peripheral neuropathy (rare) | Anticoagulant effect |
| K (Phylloquinone) | Menaquinone (K₂) | Carboxylation of clotting factors II, VII, IX, X; proteins C and S | Bleeding diathesis; HDN in newborns | Hemolysis (synthetic K₃) |
- Sun → Cholecalciferol (D3) in skin (7-dehydrocholesterol + UV)
- Liver → 25-hydroxyvitamin D (storage form; measured in serum)
- Kidney (1α-hydroxylase) → 1,25-(OH)₂D3 (Calcitriol) (active form)
- PTH stimulates renal 1α-hydroxylase
- Lab: 25-OH-D3 is the best marker for Vitamin D status
UNIT 7: NUCLEOTIDES AND NUCLEIC ACIDS
7.1 Nucleotide Structure
Nucleotide = Base + Sugar + Phosphate
Pyrimidines: Cytosine (C), Thymine (T) [DNA only], Uracil (U) [RNA only] - single ring
7.2 Purine and Pyrimidine Synthesis
- De novo: Built on ribose-5-phosphate; requires glutamine, glycine, THF, aspartate, CO₂
- Salvage pathway: Recycles free purines (HGPRT enzyme; deficiency = Lesch-Nyhan syndrome)
- Ring built first (from carbamoyl phosphate + aspartate), then attached to ribose
- Key enzyme: CAD (carbamoyl phosphate synthetase II, aspartate transcarbamylase, dihydroorotase)
- AMP → IMP → Hypoxanthine → Xanthine → Uric acid (xanthine oxidase)
- GMP → Guanosine → Guanine → Xanthine → Uric acid
- Hyperuricemia → Gout (urate crystals in joints); treated with allopurinol (inhibits xanthine oxidase)
7.3 DNA Structure and Replication
- A pairs with T (2 hydrogen bonds)
- G pairs with C (3 hydrogen bonds)
- Antiparallel strands (5'→3' and 3'→5')
- Sugar-phosphate backbone on outside; bases on inside
| Protein/Enzyme | Function |
|---|---|
| Helicase | Unwinds double helix |
| Primase | Synthesizes RNA primer |
| DNA Polymerase III | Synthesizes new DNA (5'→3' direction only) |
| DNA Polymerase I | Removes RNA primers, fills in gaps |
| DNA Ligase | Joins Okazaki fragments (lagging strand) |
| Topoisomerase | Relieves supercoiling ahead of replication fork |
Lagging strand - synthesized discontinuously as Okazaki fragments (5'→3')
7.4 Protein Synthesis (Translation)
- Template strand read 3'→5'; mRNA synthesized 5'→3'
- RNA polymerase (no primer needed)
- mRNA processing: 5' cap + poly-A tail + splicing of introns
- Ribosomes: 80S (eukaryotes) = 60S + 40S; 70S (prokaryotes) = 50S + 30S
- tRNA carries amino acids; anticodon pairs with mRNA codon
- Start codon: AUG (methionine)
- Stop codons: UAA, UAG, UGA ("U Are Away," "U Are Gone," "U Go Away")
UNIT 8: HEMOGLOBIN AND PORPHYRIN METABOLISM
8.1 Hemoglobin Structure
- HbA: α₂β₂ (major adult form, ~97%)
- HbA₂: α₂δ₂ (~2.5%)
- HbF: α₂γ₂ (fetal; higher O₂ affinity than HbA)
- O₂ binds Fe²⁺ (ferrous); if oxidized to Fe³⁺ (ferric) → methemoglobin (cannot carry O₂)
8.2 Hemoglobin-Oxygen Binding
- Increased CO₂ (Bohr effect)
- Increased H⁺ (acidosis/lower pH)
- Increased temperature
- Increased 2,3-BPG (bisphosphoglycerate; made in RBCs)
- Decreased CO₂, decreased H⁺ (alkalosis)
- HbF (fewer BPG binding sites)
- CO (carbon monoxide binds Hb with 200x affinity of O₂)
- Methemoglobin
8.3 Heme Synthesis and Degradation
- Begins and ends in mitochondria; middle steps in cytoplasm
- Start: Glycine + Succinyl-CoA → δ-Aminolevulinic acid (ALA synthase; requires B6)
- Key intermediate: Porphobilinogen → Uroporphyrin → Coproporphyrin → Protoporphyrin IX + Fe²⁺ → Heme
| Porphyria | Enzyme Deficient | Key Feature |
|---|---|---|
| AIP (Acute Intermittent) | PBG deaminase | Attacks of abdominal pain, neuropsychiatric symptoms, port-wine urine |
| PCT (Porphyria Cutanea Tarda) | Uroporphyrinogen decarboxylase | Skin blistering, photosensitivity |
| Lead poisoning | ALA dehydratase + ferrochelatase | Microcytic anemia, neurological effects |
- Heme → Biliverdin (heme oxygenase; in macrophages/spleen) → Bilirubin (fat-soluble)
- Bilirubin + albumin → liver (unconjugated bilirubin = indirect)
- Liver conjugates with glucuronic acid → conjugated bilirubin (direct; water-soluble)
- Secreted into bile → intestine → urobilinogen → stercobilin (stool) or urobilin (urine)
| Type | Cause | Unconjugated | Conjugated | Urine bilirubin | Stool |
|---|---|---|---|---|---|
| Pre-hepatic | Hemolysis | ↑↑ | Normal | Absent | Normal |
| Hepatic | Hepatocellular damage | ↑ | ↑ | Present | Pale |
| Post-hepatic | Bile duct obstruction | Normal | ↑↑ | Present (dark) | Pale/white |
UNIT 9: INTEGRATION AND ENERGY METABOLISM
9.1 Fed State vs Fasting State
| Parameter | Fed (Absorptive) State | Fasting State |
|---|---|---|
| Key hormone | Insulin | Glucagon |
| Glucose metabolism | Glycolysis, glycogenesis | Glycogenolysis, gluconeogenesis |
| Fat metabolism | Fatty acid synthesis, TAG storage | Lipolysis, β-oxidation, ketogenesis |
| Protein metabolism | Protein synthesis | Protein catabolism, gluconeogenesis |
| Liver function | Takes up glucose | Releases glucose |
| Adipose | Takes up FA, stores TAG | Releases FA and glycerol |
| Brain | Uses glucose | Uses ketones (prolonged fast) |
9.2 Metabolic Pathways Summary
| Pathway | Location | Key Substrate | Key Product | Net ATP |
|---|---|---|---|---|
| Glycolysis | Cytoplasm | Glucose | Pyruvate | +2 |
| TCA cycle | Mitochondria | Acetyl-CoA | CO₂ + NADH + FADH₂ | +2 (GTP) |
| Oxidative phosphorylation | Inner mito. membrane | NADH, FADH₂ | ATP | ~28 |
| β-Oxidation | Mitochondria | Fatty acyl-CoA | Acetyl-CoA + NADH + FADH₂ | Variable |
| Gluconeogenesis | Liver/kidney | Lactate, AA, glycerol | Glucose | -6 |
| Fatty acid synthesis | Cytoplasm | Acetyl-CoA | Palmitate | -7 |
| HMP Shunt | Cytoplasm | Glucose-6-P | NADPH + Ribose-5-P | 0 |
QUICK REFERENCE: KEY ENZYMES FOR MLS EXAMS
| Enzyme | Pathway | Inhibited By | Clinical Relevance |
|---|---|---|---|
| Hexokinase/Glucokinase | Glycolysis | Glucose-6-P | Glucose regulation |
| PFK-1 | Glycolysis | ATP, citrate | Rate-limiting step |
| Pyruvate dehydrogenase | Pyruvate → Acetyl-CoA | NADH, ATP | Thiamine deficiency (B1) |
| Citrate synthase | TCA | ATP, NADH | Entry to TCA |
| HMG-CoA reductase | Cholesterol synthesis | Statins | Target for lipid-lowering drugs |
| Acetyl-CoA carboxylase | FA synthesis | Malonyl-CoA, AMPK | Rate-limiting in FA synthesis |
| Carnitine acyltransferase I | FA transport | Malonyl-CoA | Prevents FA uptake when synthesizing |
| G6PD | HMP shunt | - | Deficiency causes hemolytic anemia |
| Phenylalanine hydroxylase | Phe → Tyr | - | Deficiency = PKU |
| ALA synthase | Heme synthesis | Heme (feedback) | Requires B6; first step |
| Xanthine oxidase | Purine catabolism | Allopurinol | Target in gout treatment |
- Lippincott's Illustrated Reviews: Biochemistry, 8th ed. - Chapters on carbohydrates, gluconeogenesis, amino acid metabolism, enzyme kinetics
- Harper's Illustrated Biochemistry, 32nd ed. - TCA cycle, lipid metabolism, enzyme structure
- Basic Medical Biochemistry: A Clinical Approach, 6th ed. - Glycolysis, gluconeogenesis, clinical correlations