
Tell me details about ecg like how to read and ecg with diagnosis of each and every disease conditions easily
ECG waveform components P wave QRS complex T wave normal
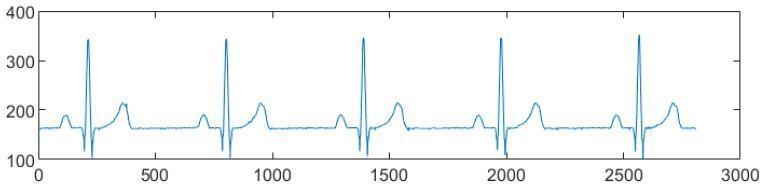
This diagnostic image displays a reconstructed single-lead electrocardiogram (ECG) tracing, specifically identifying a normal sinus rhythm from lead II at a rate of 60 beats per minute. The waveform is presented on a graph with an x-axis representing samples (time) and a y-axis representing amplitude in arbitrary units. The tracing illustrates five complete cardiac cycles, characterized by highly regular R-R intervals. Visually distinct components include a rounded P wave, a sharp and narrow QRS complex with a prominent R-peak reaching approximately 350 units, and a broader, slightly asymmetrical T wave. The isoelectric baseline is positioned at approximately the 160 mark. The morphology demonstrates classic electrophysiological features: a short QRS duration relative to the T wave and consistent amplitudes across cycles, signifying hemodynamic stability. This visual serves as an educational model for signal processing and the fundamental morphological identification of cardiac electrical activity in a clinical diagnostic context.
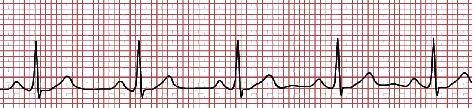
This diagnostic image displays a continuous electrocardiogram (ECG) rhythm strip, illustrating several cardiac cycles on standard red-grid paper. The waveform demonstrates a regular sinus rhythm characterized by distinct morphological components: a small, rounded P wave signifying atrial depolarization, followed by a narrow, high-amplitude QRS complex representing ventricular depolarization. The QRS complex consists of a sharp upward R-wave with a standard voltage peak near 1 mV. Subsequent to the QRS complex is a broad, positive T wave indicating ventricular repolarization. The image illustrates consistent R-R intervals, indicating a steady heart rate, and stable PR and QT intervals. This physiological signal serves as a fundamental educational example of cardiac electrical activity, highlighting the temporal and amplitude relationships necessary for clinical assessment in cardiology. The grid allows for the measurement of voltage (vertical axis) and time (horizontal axis), essential for identifying arrhythmias or conduction abnormalities.

This diagnostic image shows a single-lead (Lead II) electrocardiogram (ECG) rhythm strip printed on standard grid paper. The tracing demonstrates a normal sinus rhythm with a heart rate of approximately 97-100 beats per minute. Each cardiac cycle consists of a discernible P wave, indicating atrial depolarization, followed by a narrow, sharply peaked QRS complex representing ventricular depolarization. The R-R intervals are regular, and the QRS amplitude is consistent across the strip. Following each QRS complex is a shallow, upright T wave representing ventricular repolarization. The ST segment remains at the isoelectric line, showing no evidence of elevation or depression. A standard calibration pulse is visible at the far left. The baseline exhibits minor undulations, but all waveform components (P, QRS, and T) are clearly identifiable, confirming a baseline cardiac status before therapeutic intervention in a clinical oncology setting.
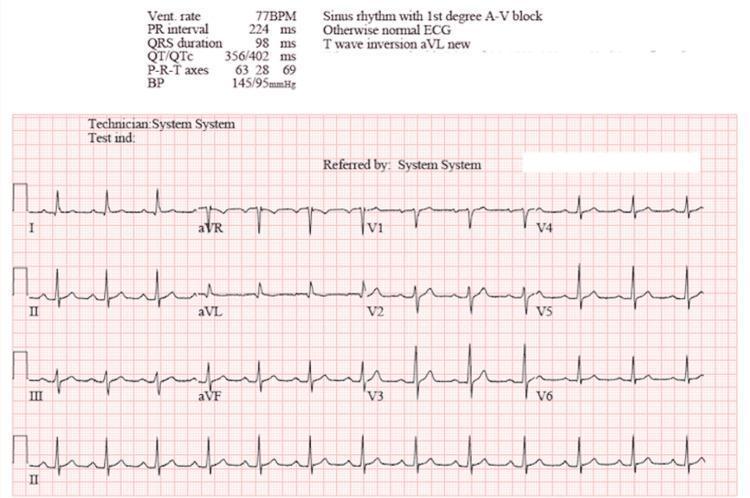
A standard 12-lead electrocardiogram (ECG) printed on red-grid paper, demonstrating a normal sinus rhythm following cardioversion. The diagnostic header indicates a ventricular rate of 77 BPM and a blood pressure of 145/95 mmHg. Key waveform findings include a prolonged PR interval of 224 ms, diagnostic of a first-degree atrioventricular (AV) block. The QRS complex duration is within normal limits at 98 ms, and the QT/QTc intervals are measured at 356/402 ms. Morphologically, P waves are present and consistent across leads, followed by narrow QRS complexes. A notable finding is T-wave inversion in lead aVL. The P-R-T axes are reported at 63, 28, and 69 degrees, respectively. The tracing includes limb leads (I, II, III, aVR, aVL, aVF) and precordial leads (V1-V6), with a continuous rhythm strip of lead II at the bottom. This image serves as a clinical example of post-cardioversion rhythm assessment and the presentation of a first-degree heart block.
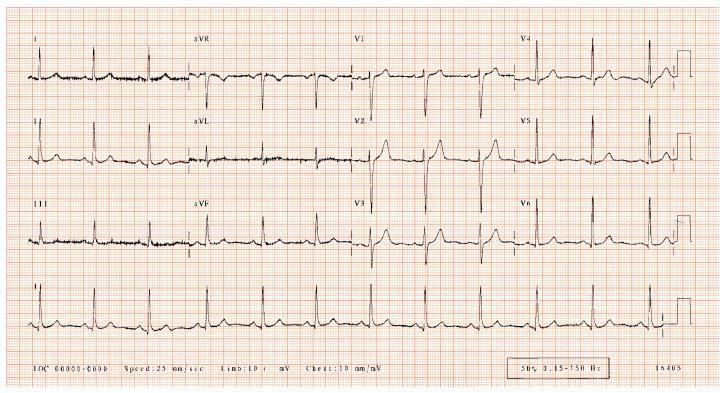
This diagnostic image shows a standard 12-lead electrocardiogram (ECG) recorded on a red-grid thermal graph paper. The layout is organized into four columns and three rows, supplemented by a continuous rhythm strip (typically lead II) along the bottom. The first column displays the limb leads (I, II, III), the second column shows the augmented limb leads (aVR, aVL, aVF), and the third and fourth columns display the precordial chest leads (V1–V3 and V4–V6, respectively). Each lead waveform clearly demonstrates standard cardiac cycle components: the P wave (atrial depolarization), the QRS complex (ventricular depolarization), and the T wave (ventricular repolarization). The grid background allows for clinical measurements, where each small 1 mm square represents 0.04 seconds horizontally and 0.1 mV vertically. The traces show a normal sinus rhythm with regular intervals and consistent morphology, used in cardiology to screen for arrhythmias, conduction delays, or ischemic heart disease.
atrial fibrillation ECG pattern diagnosis
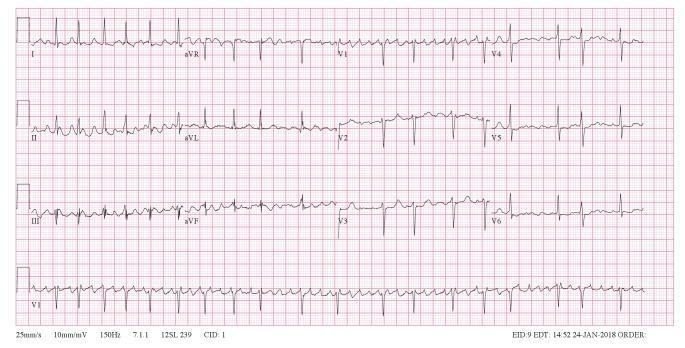
This diagnostic image is a standard 12-lead electrocardiogram (ECG) demonstrating coarse atrial fibrillation. The tracing displays a classic 'irregularly irregular' rhythm with no discernible pattern to the R-R intervals. Key features include the absence of distinct, organized P waves, which are replaced by rapid, continuous, and chaotic fibrillatory (f) waves. These waves are particularly prominent in lead V1 (bottom-most strip), showing significant variation in amplitude, morphology, and rate. This 'coarse' appearance can mimic the saw-tooth pattern of atrial flutter; however, the lack of a constant baseline and the presence of subtle variations in the atrial waveforms support the diagnosis of atrial fibrillation. The QRS complexes are narrow, indicating normal ventricular conduction. This visual is an essential educational tool for cardiology, teaching the distinction between different supraventricular tachyarrhythmias based on atrial activity characteristics and rhythm regularity.
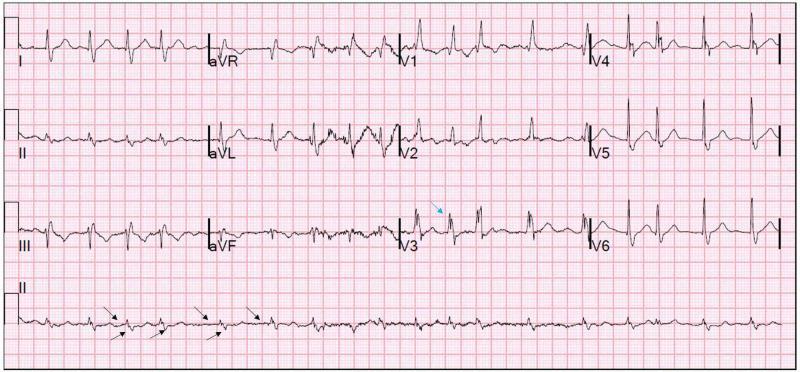
A standard 12-lead electrocardiogram (ECG) displayed on a pink grid background. The tracing demonstrates atrial fibrillation (AF) and a right bundle branch block (RBBB). Diagnostic features of AF include an irregularly irregular ventricular rhythm, absence of discernible P waves, and an irregular, fibrillatory baseline (indicated by black arrows on the rhythm strip). The QRS complexes show widened morphology with a duration exceeding 120 ms. In lead V1, a classic RSR' pattern ('bunny ears') is visible, characteristic of a right bundle branch block. Lead I and V6 show slurred S waves, further supporting the RBBB diagnosis. The ventricular rate is approximately 108 beats per minute, representing AF with a rapid ventricular response. The image provides clinical evidence of supraventricular arrhythmia combined with intraventricular conduction delay, common in patients with underlying cardiovascular disease or acute systemic triggers.
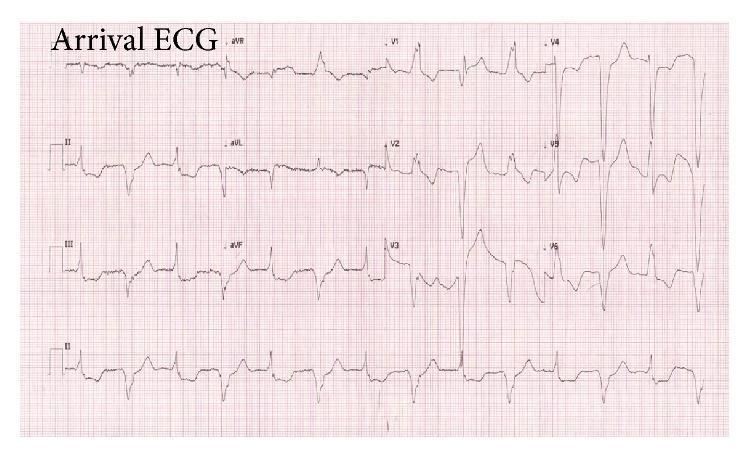
This diagnostic image is a 12-lead electrocardiogram (ECG) demonstrating atrial fibrillation with a unique pattern of alternating QRS morphologies. The rhythm is irregularly irregular with absent P-waves. The QRS complexes alternate beat-to-beat between a right bundle branch block (RBBB) pattern (characterized by an rSR' pattern in V1) and a left bundle branch block (LBBB) pattern (characterized by broad, notched R-waves in lateral leads). Significant ST-segment changes are visible: ST-segment elevation is present in the precordial leads V2-V3 and high lateral leads I and aVL, accompanied by reciprocal ST-segment depression in the inferior leads II, III, and aVF. Notably, in the LBBB-pattern beats, concordant ST-segment elevation is seen in leads V4 and V5, while discordant ST-segment changes are noted in V2-V3 and the inferior leads, satisfying Sgarbossa criteria for acute myocardial infarction. This tracing illustrates a complex presentation of infranodal conduction disease and concurrent myocardial injury in the setting of atrial fibrillation.
ST elevation myocardial infarction STEMI ECG leads
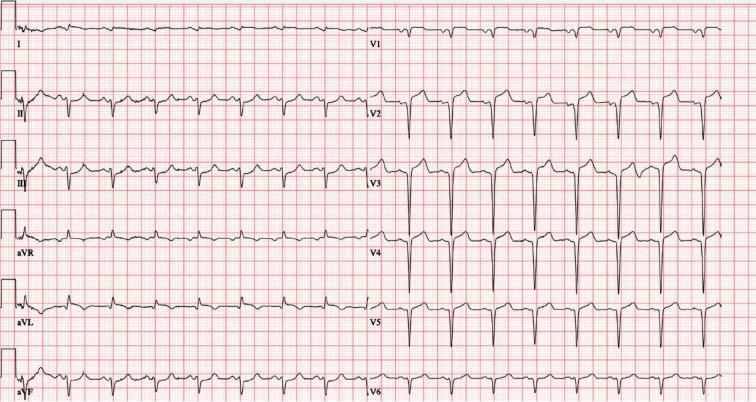
This is a 12-lead electrocardiogram (ECG) demonstrating an acute ST-segment elevation myocardial infarction (STEMI). The diagnostic hallmark is prominent ST-segment elevation across the precordial leads V1 through V6, with the most significant convex elevation appearing in leads V2, V3, and V4. These findings are highly characteristic of an acute anterior wall infarction, typically involving the left anterior descending (LAD) coronary artery. In the limb leads, mild ST-segment elevation is also visible in leads I, II, III, and aVF, accompanied by positive, upright T waves. Lead aVR shows expected global inversion. The tracing displays a sinus rhythm with regular morphology, but the ST-segment deviations from the isoelectric baseline indicate acute myocardial injury. This visual material is a critical educational tool for teaching the ECG localization of coronary occlusions and the identification of STEMI criteria in an emergency clinical context.
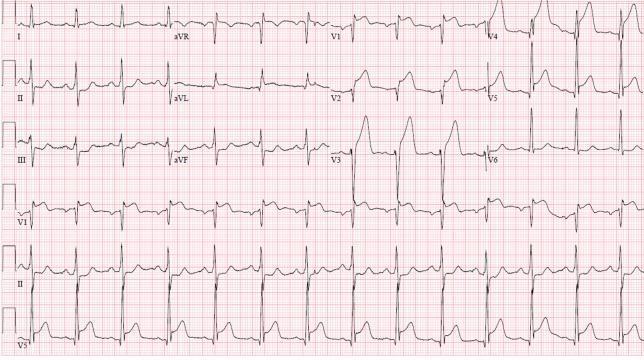
A 12-lead electrocardiogram (ECG) demonstrating an acute anterolateral ST-elevation myocardial infarction (STEMI). The tracing shows significant, convex-upward ST-segment elevation in the precordial leads (V1–V6), consistent with an anterior wall injury. Leads I and aVL also display ST-elevation, indicating lateral involvement. These changes are accompanied by hyperacute, peaked T-waves most prominent in V2 through V4. There is evidence of reciprocal ST-segment depression in the inferior leads (II, III, and aVF). The QRS complexes appear widened in the leads with maximal ST elevation. The heart rhythm is sinus. This ECG pattern is clinically significant for proximal left anterior descending (LAD) artery occlusion, necessitating urgent reperfusion therapy. The visual presentation focuses on teachable hallmarks of cardiac ischemia, including the relationship between anatomical lead distribution and corresponding vascular territories, as well as the identification of reciprocal changes in opposing leads.
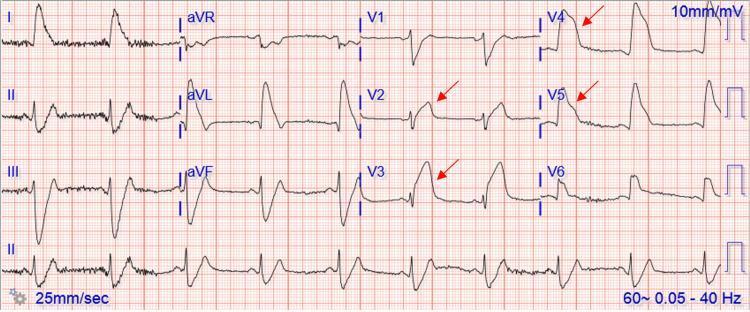
This diagnostic image is a 12-lead electrocardiogram (ECG) demonstrating an ST-elevation myocardial infarction (STEMI). The tracing exhibits significant ST-segment elevation across several leads, most prominently marked with red arrows in the precordial leads V2, V3, V4, and V5. The ST-segments show a convex-upward (coved) morphology, characteristic of acute myocardial injury. Additionally, there is evident ST-segment elevation in the lateral leads (I, aVL) and hyperacute T-waves. Leads II, III, and aVF show reciprocal ST-segment depression. The cardiac rhythm appears to be a sinus bradycardia, with a visible P-wave preceding each QRS complex. The tracing is set at a standard paper speed of 25 mm/sec and a voltage calibration of 10 mm/mV. This ECG is a critical educational tool for identifying the 'tombstone' ST-elevation pattern associated with proximal left anterior descending artery (LAD) or left main coronary artery occlusion, correlating with extensive anterior-lateral wall ischemia.
complete heart block third degree AV block ECG
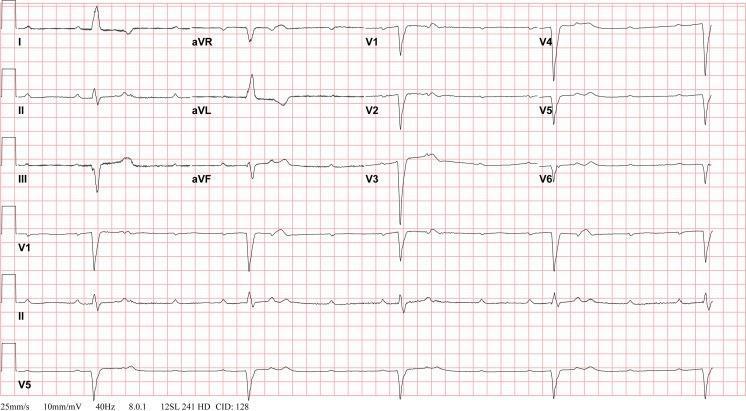
A 12-lead electrocardiogram (ECG) demonstrating a complete atrioventricular (AV) block, also known as third-degree heart block. The diagnostic image shows total AV dissociation characterized by a lack of relationship between P waves and QRS complexes. The atrial rate is significantly faster and independent of the ventricular rate. The ventricular escape rhythm is slow (bradycardic) with wide QRS complexes (duration >120 ms), indicating the escape rhythm originates from a ventricular or infra-Hisian site. Prominent features include deep S waves in the precordial leads (V1-V3) and T-wave inversions in several leads, including I, II, aVL, and V4-V6. This tracing represents a postoperative clinical scenario following tricuspid valve replacement, illustrating a known complication of congenital heart surgery. The ECG is recorded at standard settings of 25 mm/s and 10 mm/mV, serving as a critical educational tool for identifying life-threatening conduction system failures and the necessity for pacing interventions.

This diagnostic image is a single-lead (Lead II) rhythm strip electrocardiogram (ECG) demonstrating a complete heart block, also known as third-degree atrioventricular (AV) block. The tracing shows complete AV dissociation, characterized by independent atrial and ventricular activity. P waves are present and occur at a regular, faster atrial rate, but they bear no consistent relationship to the QRS complexes; some P waves are superimposed on T waves or the QRS complexes themselves. The ventricular rhythm is maintained by a slow, bradycardic escape rhythm. The QRS complexes are relatively narrow and appear at regular intervals, suggesting a junctional escape origin. This clinical finding is critical for medical students and clinicians to recognize as it indicates a total failure of conduction through the AV node, necessitating urgent clinical intervention such as a permanent pacemaker.
ventricular tachycardia ECG wide complex rhythm
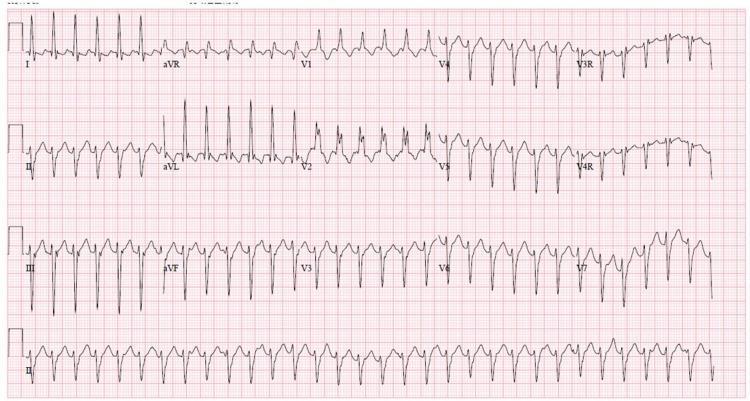
A 12-lead electrocardiogram (ECG) demonstrating a regular wide complex tachycardia (WCT). The rhythm is characterized by a rapid ventricular rate and broad QRS complexes, indicating delayed ventricular depolarization. Key morphological findings include a Right Bundle Branch Block (RBBB) pattern, notably visible as an RSR' or notched morphology in the right precordial leads (V1, V2). There is significant left axis deviation (LAD), with predominantly negative QRS complexes in the inferior leads (II, III, and aVF) and positive complexes in leads I and aVL. This combination of RBBB morphology and left axis deviation in the context of wide complex tachycardia is a classic presentation of idiopathic left ventricular tachycardia, also known as Belhassen tachycardia or verapamil-sensitive fascicular ventricular tachycardia. The rhythm appears monomorphic, and the baseline shows no clearly identifiable P waves, suggesting atrioventricular dissociation or retrograde conduction common in ventricular arrhythmias.
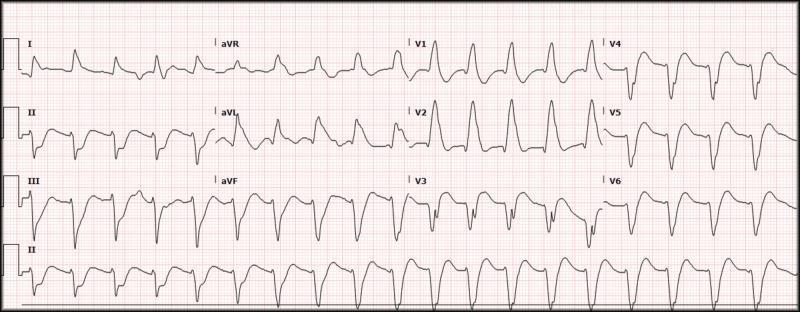
This diagnostic image is a 12-lead electrocardiogram (ECG) demonstrating a wide-complex tachycardia with a ventricular rate of approximately 116 beats per minute and a QRS duration of approximately 200 ms. The ECG shows a regular rhythm with significantly widened QRS complexes and bizarre morphology, suggestive of a ventricular origin or severe intraventricular conduction delay. In the precordial leads, V1 and V2 exhibit tall, peaked R-waves with slurred upstrokes, while V4 through V6 show deep S-waves and discordant T-waves. The limb leads (I, II, III, aVR, aVL, aVF) demonstrate varied morphology with notching and slurring. No clear P-waves are discernible preceding the QRS complexes, which is characteristic of ventricular tachycardia or a highly aberrant supraventricular rhythm. The clinical focus of this visual is to illustrate the features of wide-complex tachycardia in an emergency clinical setting, emphasizing the importance of recognizing prolonged QRS intervals and atypical wave morphology for rapid triage and Advanced Cardiovascular Life Support (ACLS) intervention.
left bundle branch block right bundle branch block ECG comparison
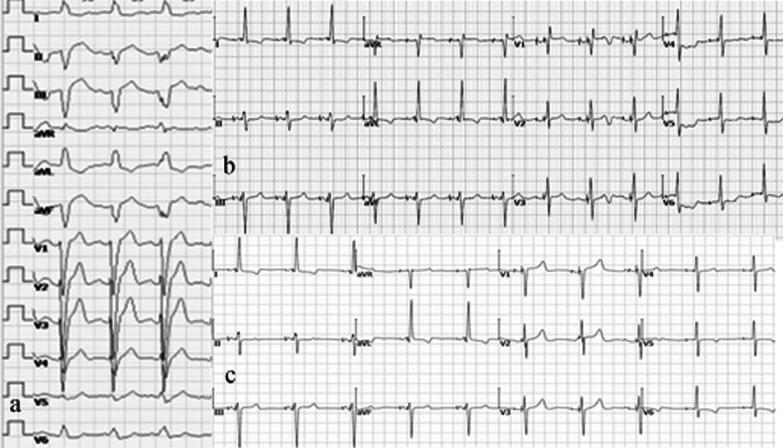
This diagnostic image contains three comparison panels (a, b, and c) of 12-lead electrocardiograms (ECG) demonstrating the evolution of ventricular conduction in a patient with ischemic cardiomyopathy. Panel (a) shows the baseline ECG with a classic Left Bundle Branch Block (LBBB) morphology, characterized by a wide QRS duration (160 ms), broad notched R waves in lateral leads (I, aVL, V6), and deep S waves in precordial leads V1-V3. Panel (b) illustrates unipolar Left Bundle Branch Area Pacing (LBBAP), showing a transition to a Right Bundle Branch Block (RBBB) pattern with a reduced QRS duration of 122 ms, indicated by terminal R' waves in lead V1. Panel (c) displays pacing with Left Bundle Branch Optimized Cardiac Resynchronization Therapy (LOT-aCRTD). This configuration demonstrates 'LBBB correction,' resulting in the narrowest QRS duration (120 ms) and a more physiological depolarization pattern. The image serves as an educational comparison of cardiac pacing modalities and their impact on ventricular synchronization and QRS morphology.
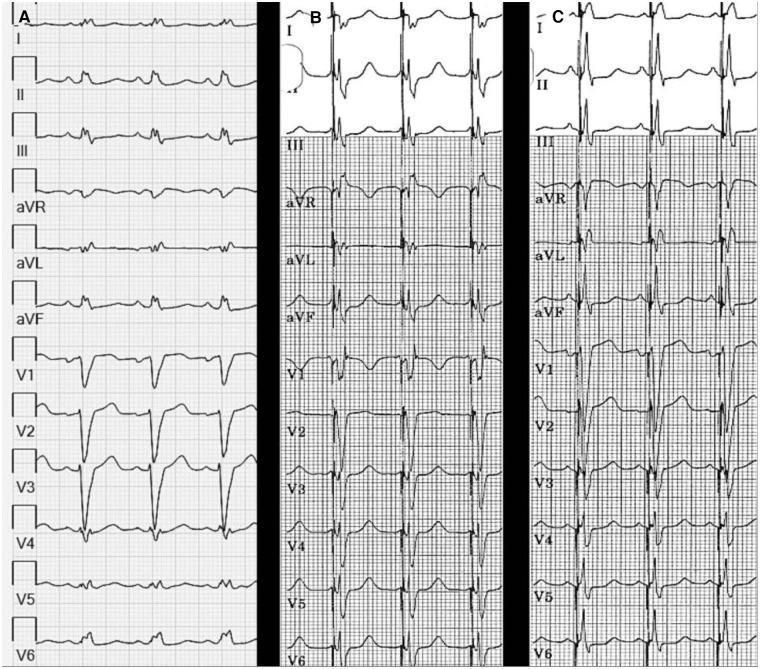
A comparison of three 12-lead electrocardiogram (ECG) strips (labeled A, B, and C) illustrating the effects of Left Bundle Branch Area Pacing (LBBAP) on ventricular activation. Panel A displays baseline sinus rhythm with Left Bundle Branch Block (LBBB), characterized by a wide QRS duration (156 ms), dominant S waves in V1-V3, and broad R waves in I, aVL, and V6. Panel B shows LBBAP with a short Atrioventricular (AV) delay of 40 ms, resulting in a reduced QRS duration of 128 ms and a Right Bundle Branch Block (RBBB) morphology in lead V1 (rSR' pattern), indicating left ventricular capture. Panel C demonstrates the normalization of the QRS complex (120 ms) by increasing the AV delay to 80 ms. This adjustment facilitates physiological fusion between the paced left ventricular activation and intrinsic anterograde conduction through the right bundle. The sequence highlights the transition from wide-complex dyssynchrony to a more narrow, synchronized ventricular activation pattern, with associated improvements in T-wave morphology and ST-segment alignment across the limb and precordial leads.
Wolff-Parkinson-White syndrome WPW ECG delta wave pre-excitation
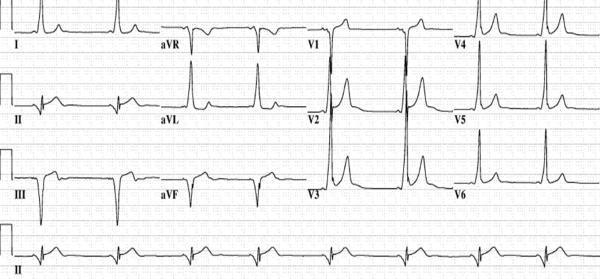
This diagnostic image is a 12-lead electrocardiogram (ECG) demonstrating the classic pre-excitation pattern of Wolff-Parkinson-White (WPW) syndrome associated with a posteroseptal accessory pathway. Key features include a shortened PR interval and the presence of delta waves—slurred upstrokes at the start of the QRS complexes. In the precordial leads, the delta wave is positive in V1, becomes less prominent in V2, and disappears by V3. Crucially, the delta waves are negative in the inferior leads (II, III, and aVF), mimicking a pseudo-infarct Q-wave pattern. This negative polarity in the inferior leads is highly suggestive of an accessory pathway originating in the posteroseptal region, potentially localized near the coronary sinus or middle cardiac vein. The tracing serves as an educational tool for medical students and electrophysiologists to practice electrocardiographic localization of bypass tracts prior to catheter ablation.
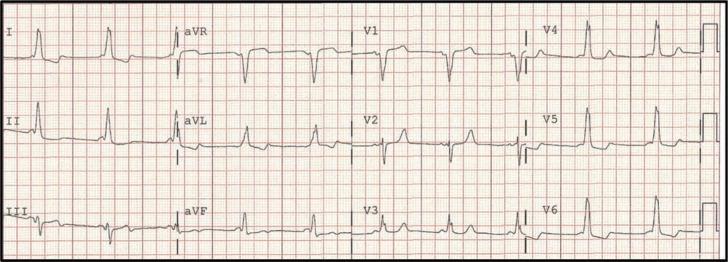
A standard 12-lead electrocardiogram (ECG) tracing demonstrating classic features of manifest ventricular pre-excitation, characteristic of Wolff-Parkinson-White (WPW) syndrome. The primary diagnostic findings include a shortened PR interval (<120 ms) and a widened QRS complex with a distinctive 'delta wave,' visible as initial slurring or notching of the QRS upstroke. These features are most prominent in the precordial leads (V1-V6) and lateral limb leads. The polarity of the delta waves—specifically the negative delta wave in lead III and a predominantly positive QRS in leads V4-V6—is consistent with a mid-septal accessory pathway location. The rhythm is a regular sinus rhythm, and secondary ST-T wave changes are visible, which are common in pre-excitation due to altered ventricular depolarization. This diagnostic image is essential for medical students and clinicians studying cardiac electrophysiology and the interpretation of tachyarrhythmia substrates.
Complete ECG Guide: How to Read & Disease Diagnosis
PART 1: ECG BASICS - The Paper & Calibration
| Parameter | Value |
|---|---|
| Paper speed | 25 mm/second |
| 1 small square (1 mm) | 0.04 seconds horizontally; 0.1 mV vertically |
| 1 large square (5 mm) | 0.20 seconds horizontally; 0.5 mV vertically |
| Normal calibration | 10 mm = 1 mV |
PART 2: The 12 Leads and What They See
Limb Leads
| Lead | View of Heart |
|---|---|
| I | Lateral wall (left side) |
| II | Inferior wall |
| III | Inferior wall |
| aVR | Cavity (right arm - global view) |
| aVL | High lateral wall |
| aVF | Inferior wall |
Precordial (Chest) Leads
| Lead | View |
|---|---|
| V1-V2 | Septal / Right ventricle |
| V3-V4 | Anterior wall (LAD territory) |
| V5-V6 | Lateral wall (LCX territory) |
PART 3: Normal Waveforms - Step-by-Step
P Wave
- Represents atrial depolarization (SA node firing → atria contract)
- Normal: rounded, upright in II, inverted in aVR
- Duration: < 0.12 s (3 small squares)
- Amplitude: < 2.5 mm in limb leads; < 1.5 mm in V1
PR Interval
- From start of P wave to start of QRS
- Represents AV nodal delay (the "gatekeeper" delay)
- Normal: 0.12 - 0.20 s (3-5 small squares)
- Short PR = pre-excitation (WPW); Long PR = heart block
QRS Complex
- Represents ventricular depolarization (ventricles contracting)
- Q wave = first negative deflection
- R wave = first positive deflection
- S wave = negative deflection after R
- Normal duration: < 0.12 s (< 3 small squares)
- Wide QRS (≥ 0.12 s) = bundle branch block or ventricular origin
ST Segment
- From end of QRS to start of T wave
- Normally isoelectric (flat, on baseline)
- Elevation = injury/infarction; Depression = ischemia
T Wave
- Represents ventricular repolarization
- Normally upright in I, II, V3-V6; inverted in aVR
- Peaked T waves = hyperkalemia or early ischemia
- Inverted T waves = ischemia, strain, LVH
QT Interval
- From start of QRS to end of T wave
- Normal QTc (corrected): < 440 ms in men, < 460 ms in women
- Prolonged QTc = risk of Torsades de Pointes
PART 4: The Systematic Approach (ALWAYS use this)
- R - Rate
- I - Intervals (PR, QRS, QT)
- P - P waves (present? morphology? relation to QRS?)
- E - Electrical axis
- S - ST segment changes
- A - Arrhythmia identification
- T - T wave changes
Calculating Heart Rate
- Regular rhythm: 300 ÷ number of large squares between R-R intervals
- Quick method: Count R waves in 6-second strip × 10
- Normal: 60-100 bpm | Bradycardia: < 60 | Tachycardia: > 100
Axis Determination
| Lead I | aVF | Axis |
|---|---|---|
| Positive | Positive | Normal (0° to +90°) |
| Positive | Negative | Left axis deviation (-30° to -90°) |
| Negative | Positive | Right axis deviation (+90° to +180°) |
| Negative | Negative | Extreme axis ("northwest") |
- Left axis deviation suggests: LBBB, left anterior hemiblock, inferior MI, LVH
- Right axis deviation suggests: RVH, RBBB, left posterior hemiblock, lateral MI, COPD
PART 5: ECG Diagnosis by Disease
1. NORMAL SINUS RHYTHM
- Rate: 60-100 bpm
- P wave before every QRS, upright in II
- PR interval: 0.12-0.20 s
- QRS: narrow (< 0.12 s)
- Regular R-R intervals
2. SINUS BRADYCARDIA
- All normal morphology BUT rate < 60 bpm
- Causes: athletes, hypothyroidism, beta-blockers, inferior MI, raised ICP
3. SINUS TACHYCARDIA
- All normal morphology BUT rate > 100 bpm
- Causes: fever, pain, hypovolemia, anemia, PE, anxiety, hyperthyroidism
4. ATRIAL FIBRILLATION (AF)

- No discrete P waves - replaced by chaotic fibrillatory (f) waves
- Irregularly irregular R-R intervals (the hallmark)
- Narrow QRS (unless aberrant conduction)
- Ventricular rate typically 100-160 bpm (uncontrolled)
5. ATRIAL FLUTTER
- Sawtooth flutter (F) waves at ~300 bpm - best seen in II, III, aVF
- Ventricular rate typically 150 bpm (2:1 block) or 75 bpm (4:1)
- Regular rhythm (unless variable block)
- Memory: "Sawtooth in the inferior leads"
6. SUPRAVENTRICULAR TACHYCARDIA (SVT)
- Sudden onset narrow-complex tachycardia at 150-250 bpm
- P waves often hidden in or just after QRS complex
- Regular rhythm
- Responds to vagal maneuvers or adenosine
7. WOLFF-PARKINSON-WHITE (WPW) SYNDROME
- Short PR interval (< 0.12 s)
- Delta wave - slurred upstroke at the start of QRS
- Widened QRS (> 0.12 s)
- Secondary ST-T wave changes
8. FIRST DEGREE AV BLOCK
- PR interval > 0.20 s (> 5 small squares)
- Every P wave is followed by a QRS
- Usually benign; caused by increased vagal tone, digoxin, AV nodal disease
9. SECOND DEGREE AV BLOCK - MOBITZ TYPE I (Wenckebach)
- Progressive PR lengthening until a P wave is NOT followed by QRS
- Then the cycle resets
- Usually involves AV node; typically benign
- "The PR gets longer and longer, then drops a QRS"
10. SECOND DEGREE AV BLOCK - MOBITZ TYPE II
- Fixed PR interval (normal or prolonged), then sudden non-conducted P wave (dropped beat)
- No PR lengthening
- Below His bundle (infranodal) - more serious, can progress to complete block
- May need pacemaker
11. THIRD DEGREE (COMPLETE) HEART BLOCK
- Complete AV dissociation - P waves and QRS complexes are independent
- Atrial rate: 60-100 bpm (regular P waves)
- Ventricular rate: 30-60 bpm (slow escape rhythm)
- Wide QRS if escape from ventricle; narrow QRS if junctional escape
12. LEFT BUNDLE BRANCH BLOCK (LBBB)
- QRS duration ≥ 0.12 s
- Broad, notched "M-shaped" R wave in V5, V6, I, aVL ("WiLLiaM" = W in V1, M in V6 for LBBB)
- Deep broad S wave in V1
- ST and T waves are discordant (opposite to QRS)
- No septal q waves in lateral leads
13. RIGHT BUNDLE BRANCH BLOCK (RBBB)
- QRS duration ≥ 0.12 s
- RSR' ("bunny ears" or M pattern) in V1 ("MaRRoW" = M in V1, W in V6 for RBBB)
- Wide, slurred S wave in I, V5, V6
- T wave inversion in V1-V3
14. STEMI - ST ELEVATION MYOCARDIAL INFARCTION
| Territory | Affected Leads | Culprit Artery |
|---|---|---|
| Anteroseptal | ST elevation V1, V2, (V3) | LAD (proximal) |
| Anterior | ST elevation V1-V4 | LAD |
| Anterolateral | ST elevation V1-V6, I, aVL | LAD (proximal) / Left main |
| Lateral | ST elevation I, aVL | LCX |
| Inferior | ST elevation II, III, aVF | RCA (usually) |
| Inferolateral | ST elevation II, III, aVF, V5, V6 | RCA or LCX |
| True Posterior | Tall R waves in V1-V2, R/S ≥1 | RCA or LCX |
| Right Ventricular | ST elevation II, III, aVF + right-sided leads V3R-V6R | RCA (proximal) |
- Convex (tombstone) ST elevation ≥ 1 mm in ≥ 2 contiguous leads
- Reciprocal ST depression in mirror leads (confirms true STEMI)
- Hyperacute T waves (very early sign)
- Q waves develop after hours (indicate completed infarction)
15. NSTEMI / UNSTABLE ANGINA
- ST depression ≥ 0.5 mm or T wave inversion in ischemic distribution
- No ST elevation
- Diagnosed by elevated troponin (NSTEMI) or normal troponin (UA)
- Subendocardial ischemia pattern: diffuse ST depression + ST elevation in aVR
16. VENTRICULAR TACHYCARDIA (VT)
- Wide QRS (> 0.12 s) tachycardia at rate 100-250 bpm
- AV dissociation (P waves independent of QRS) - pathognomonic
- Fusion beats and capture beats (diagnostic when present)
- Concordance of QRS across all precordial leads (all positive or all negative)
- Extreme axis deviation
17. VENTRICULAR FIBRILLATION (VF)
- Completely chaotic, irregular waveforms - no recognizable P, QRS, or T
- No effective cardiac output - cardiac arrest
- Immediate defibrillation required
18. LEFT VENTRICULAR HYPERTROPHY (LVH)
- S in V1 + R in V5 or V6 ≥ 35 mm
- R in aVL ≥ 11 mm
- Left axis deviation
- "Strain" pattern: ST depression + T wave inversion in I, aVL, V5, V6 (lateral leads)
- Left atrial enlargement (broad, bifid P wave - P mitrale)
19. RIGHT VENTRICULAR HYPERTROPHY (RVH)
- Right axis deviation (> +90°)
- Dominant R wave in V1 (R > S in V1)
- Deep S waves in V5, V6
- ST depression and T inversion in right precordial leads (V1-V3)
- P pulmonale: tall peaked P wave > 2.5 mm in lead II
20. PULMONARY EMBOLISM (PE)
- S wave in lead I
- Q wave in lead III
- T wave inversion in lead III
- Sinus tachycardia (most common finding)
- New RBBB
- Right axis deviation
- T wave inversions in V1-V4
21. HYPERKALEMIA
| K+ level | ECG change |
|---|---|
| 5.5-6.5 mEq/L | Tall, peaked (tented) T waves |
| 6.5-7.5 mEq/L | PR prolongation, P wave flattening |
| 7.5-8.0 mEq/L | Wide QRS, sine wave pattern |
| > 8.0 mEq/L | Ventricular fibrillation, asystole |
22. HYPOKALEMIA
- Flattened T waves
- U waves (prominent positive deflection after T wave, especially in V3-V4)
- ST depression
- Prolonged QU interval (mistaken for QT prolongation)
23. HYPERCALCEMIA
- Short QT interval (shortened ST segment)
- Bradycardia in severe cases
HYPOCALCEMIA
- Prolonged QT interval (prolonged ST segment, T wave normal)
24. PERICARDITIS
- Stage 1: Diffuse saddle-shaped ST elevation in most leads EXCEPT aVR and V1 (which show ST depression) + PR depression
- Stage 2: ST returns to baseline, PR depression persists
- Stage 3: T wave inversions develop
- Stage 4: ECG normalizes
25. LONG QT SYNDROME
- QTc > 440 ms (men) or > 460 ms (women)
- Risk of Torsades de Pointes (a polymorphic VT)
- Torsades on ECG: twisting of QRS complexes around the isoelectric baseline
26. DIGOXIN EFFECT / TOXICITY
- Digoxin effect (therapeutic): "Reverse tick" or "Salvador Dali moustache" ST depression (scooped ST segment downsloping)
- Digoxin toxicity: Bradyarrhythmias, AV blocks, ventricular ectopics, bidirectional VT (pathognomonic)
27. BRUGADA SYNDROME
- Type 1 (diagnostic): Coved ST elevation > 2 mm in V1-V2 with RBBB pattern and ST that slopes down into inverted T wave
- Type 2 and 3 are "saddle-back" patterns
- Risk of sudden cardiac death due to VF
- Often young males of Southeast Asian descent
PART 6: Quick Reference Summary Table
| Disease | Key ECG Finding |
|---|---|
| Normal Sinus Rhythm | P before every QRS, HR 60-100, narrow QRS |
| Sinus Bradycardia | Normal morphology, rate < 60 |
| Sinus Tachycardia | Normal morphology, rate > 100 |
| Atrial Fibrillation | No P waves, irregularly irregular |
| Atrial Flutter | Sawtooth flutter waves, ~150 bpm (2:1 block) |
| SVT | Narrow complex, 150-250 bpm, sudden onset |
| WPW | Short PR, delta wave, wide QRS |
| 1st Degree AV Block | PR > 0.20 s, every P conducts |
| Wenckebach (Mobitz I) | Progressive PR lengthening → dropped QRS |
| Mobitz II | Fixed PR, sudden dropped QRS |
| 3rd Degree Block | AV dissociation, slow escape rhythm |
| LBBB | QRS ≥ 0.12 s, WiLLiaM pattern (W in V1, M in V5-6) |
| RBBB | QRS ≥ 0.12 s, MaRRoW pattern (M in V1, W in V6) |
| STEMI | ST elevation ≥ 1 mm in ≥ 2 contiguous leads |
| NSTEMI/UA | ST depression or T inversion, no elevation |
| VT | Wide complex tachycardia, AV dissociation |
| VF | Chaotic - no recognizable waveforms |
| LVH | S(V1) + R(V5/V6) ≥ 35 mm, strain pattern |
| RVH | RAD, dominant R in V1, strain V1-V3 |
| PE | S1Q3T3, sinus tachycardia, new RBBB |
| Hyperkalemia | Peaked T waves → wide QRS → sine wave |
| Hypokalemia | Flattened T, prominent U waves |
| Pericarditis | Diffuse saddle ST elevation, PR depression |
| Long QT | QTc > 440-460 ms, risk Torsades |
| Digoxin effect | Scooped/reverse tick ST depression |
| Brugada | Coved ST in V1-V2, RBBB pattern |