Explain 10 heart disease with ECG change and ECG images of those disease
Reading File
Finding Sources
Searching Images
ECG changes myocardial infarction ST elevation
Finding Sources
Searching Images
atrial fibrillation ECG irregular rhythm no P waves
Searching Images
complete heart block third degree AV block ECG
Searching Images
Wolff-Parkinson-White syndrome ECG delta wave short PR
Searching Images
hypertrophic cardiomyopathy ECG left ventricular hypertrophy
Searching Images
pericarditis ECG saddle shaped ST elevation diffuse
Searching Images
Brugada syndrome ECG coved ST elevation V1 V2 V3
Searching Images
long QT syndrome ECG prolonged QT interval torsades de pointes
Searching Images
pulmonary embolism ECG S1Q3T3 right heart strain sinus tachycardia
Searching Images
dilated cardiomyopathy ECG left bundle branch block poor R wave progression
Searching Images
hyperkalemia ECG peaked T waves wide QRS sine wave
Here is a comprehensive guide to 10 heart diseases and their characteristic ECG changes, with clinical ECG images for each.
10 Heart Diseases with ECG Changes
1. 🫀 ST-Elevation Myocardial Infarction (STEMI)
ECG Changes
- Hyperacute T waves — earliest sign (peaked, broad T waves)
- ST-segment elevation ≥1 mm in ≥2 contiguous leads (convex/tombstone morphology)
- Reciprocal ST depression in opposing leads
- Pathological Q waves — develop within hours (>25% of R wave height, >40 ms wide)
- T-wave inversion in the evolving/chronic phase
| Territory | Leads with ST Elevation | Artery |
|---|---|---|
| Anterior | V1–V4 | LAD |
| Inferior | II, III, aVF | RCA |
| Lateral | I, aVL, V5–V6 | LCx |
| Posterior | V1–V3 (tall R + ST depression) | RCA/LCx |
ECG Image — Anterior STEMI (LAD occlusion)

ECG Image — Inferior STEMI with posterior extension
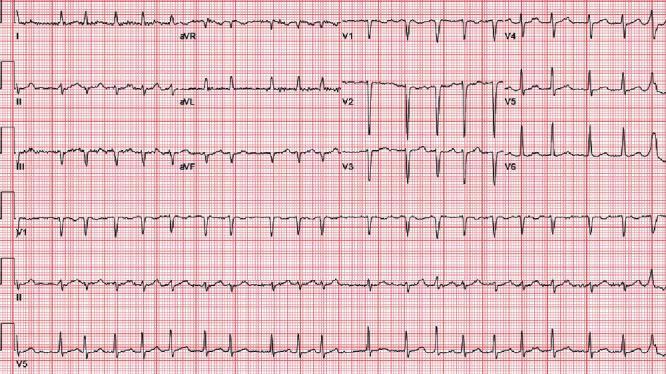
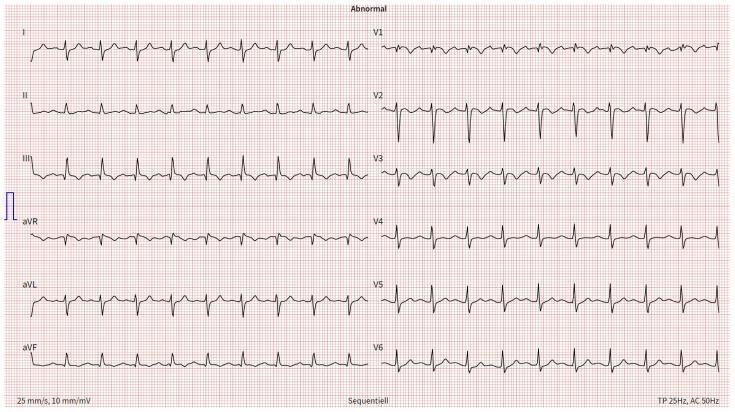
2. 💓 Atrial Fibrillation (AF)
ECG Changes
- Absent P waves — replaced by chaotic fibrillatory (f) waves, most visible in V1
- Irregularly irregular RR intervals — hallmark feature
- Narrow QRS complexes (unless aberrant conduction or pre-excitation)
- Rate: can be rapid (>100 bpm), controlled, or slow
- Fine vs. coarse f waves (coarse may mimic flutter)
ECG Image — Atrial Fibrillation
3. 🔇 Complete (Third-Degree) AV Heart Block
ECG Changes
- Complete AV dissociation — P waves and QRS complexes are totally independent
- Atrial rate > ventricular escape rate
- Regular P-P intervals and regular R-R intervals but NO consistent relationship
- Wide QRS (>120 ms) if ventricular escape focus; narrow if junctional escape
- Bradycardia — escape rate 20–40 bpm (ventricular) or 40–60 bpm (junctional)
ECG Image — Complete Heart Block
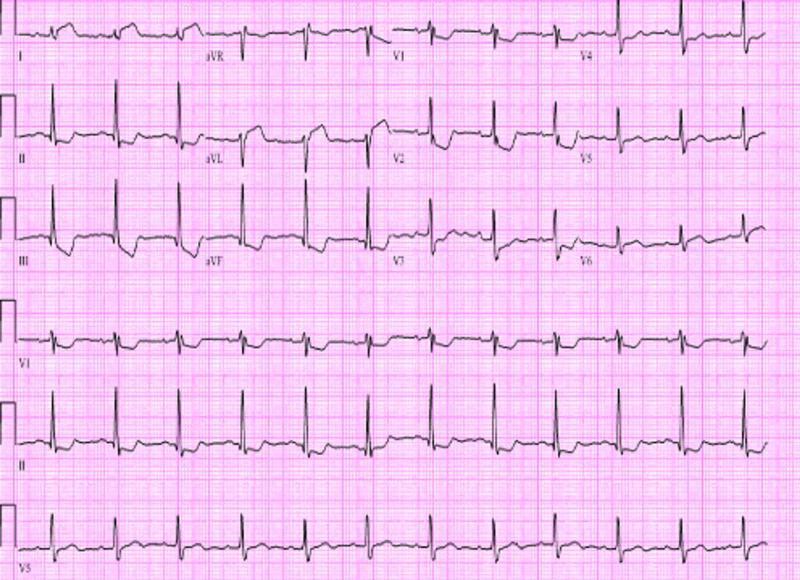
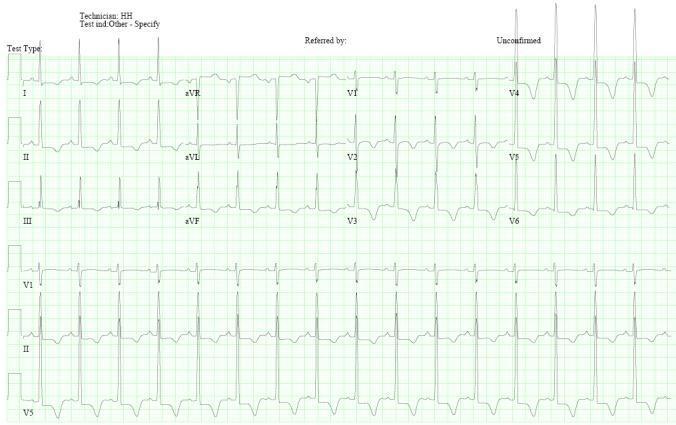
4. ⚡ Wolff-Parkinson-White (WPW) Syndrome
ECG Changes
- Short PR interval (<120 ms) — rapid conduction through accessory pathway
- Delta wave — slurred upstroke at onset of QRS (pre-excitation of ventricle)
- Wide QRS — total duration >120 ms (delta + normal conduction fusion)
- Secondary ST-T changes — discordant from QRS
- Delta wave polarity localizes the accessory pathway
- Risk: AF with pre-excitation can cause ventricular fibrillation
ECG Image — WPW Syndrome
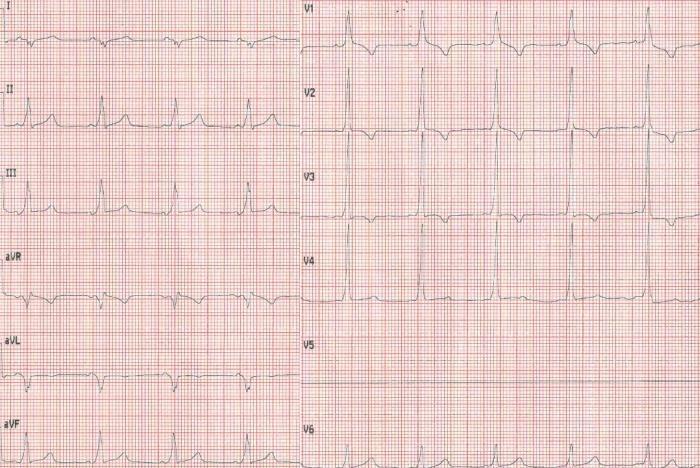
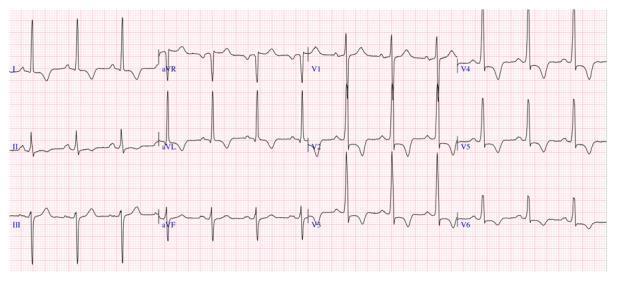
5. 🧱 Hypertrophic Cardiomyopathy (HCM)
ECG Changes
- Left ventricular hypertrophy (LVH) — increased QRS voltage (Sokolow-Lyon: S V1 + R V5 > 35 mm)
- Deep, symmetric T-wave inversions — especially lateral and precordial leads; "giant" negative T waves in apical HCM (Yamaguchi pattern)
- Strain pattern — ST depression with T-wave inversion in V4–V6, I, aVL
- Absence of septal Q waves in I, aVL, V5–V6 (abnormal septal depolarization)
- Abnormal Q waves in inferior/lateral leads mimicking infarction
ECG Image — HCM with Apical Variant
ECG Image — Septal HCM with strain pattern
6. 🔥 Acute Pericarditis
ECG Changes (Classically Evolves Through 4 Stages)
| Stage | ECG Finding |
|---|---|
| I | Diffuse concave (saddle-shaped) ST elevation in all leads except aVR/V1; PR depression |
| II | ST returns to baseline; PR depression persists |
| III | T-wave inversion (diffuse) |
| IV | ECG normalizes |
- PR segment depression — most specific finding (due to atrial epicarditis); reciprocal PR elevation in aVR
- Spodick's sign — downward slope of TP segment
- ST elevation is diffuse (not territory-specific), and there are no reciprocal ST depressions (unlike STEMI)
ECG Image — Acute Pericarditis

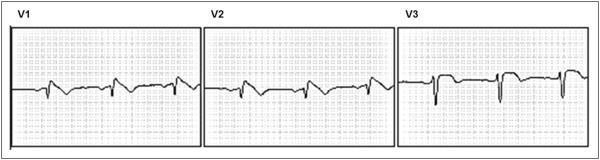
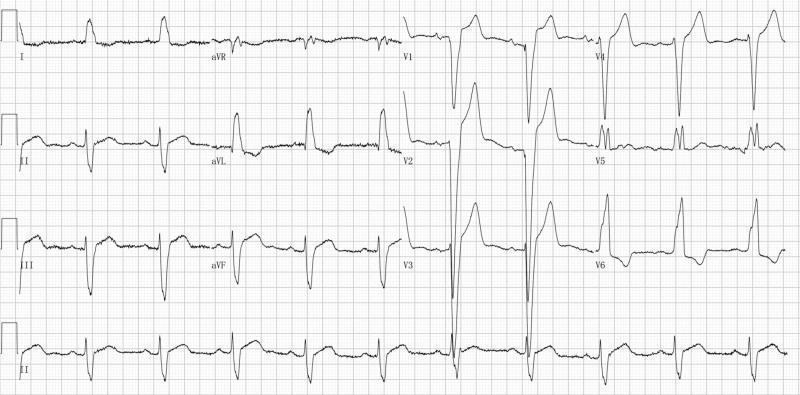
7. 🧬 Brugada Syndrome
ECG Changes
Three ECG patterns recognized:
| Pattern | ST Morphology | Diagnostic |
|---|---|---|
| Type 1 (coved) | J-point ≥2 mm, convex/coved ST descending to inverted T | Diagnostic of Brugada syndrome |
| Type 2 (saddle-back) | J-point ≥2 mm, saddle-back ST with positive T | Not diagnostic alone |
| Type 3 | <2 mm elevation, saddle-back | Not diagnostic |
- Location: V1–V3 (or V1–V2 with leads placed in 3rd/2nd intercostal space)
- Spontaneous Type 1 is most significant; provocation with ajmaline/flecainide can unmask
- Risk of polymorphic VT and sudden cardiac death, especially at rest/night
ECG Image — Brugada Type 1
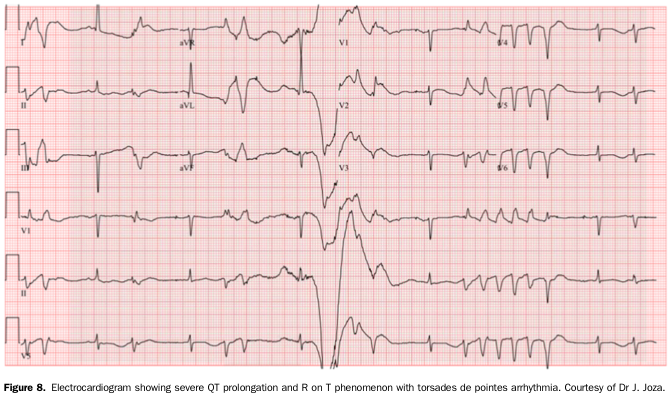
8. 🔁 Long QT Syndrome (LQTS)
ECG Changes
- Prolonged QTc interval — QTc >440 ms (men), >460 ms (women); >500 ms = high risk
- T-wave abnormalities — broad, notched, or biphasic T waves
- T-wave alternans — beat-to-beat variation in T-wave morphology (severe LQTS)
- Torsades de Pointes (TdP) — polymorphic VT that "twists" around the isoelectric line; triggered by R-on-T
| LQTS Subtype | T-Wave Pattern | Trigger |
|---|---|---|
| LQT1 | Broad-based T wave | Exercise |
| LQT2 | Notched/bifid T wave | Auditory stimuli |
| LQT3 | Late-onset, peaked T wave | Rest/sleep |
ECG Image — LQTS with Torsades de Pointes
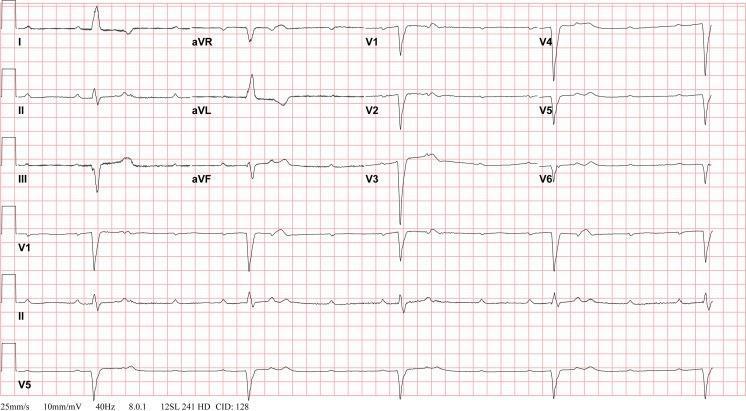
9. 🩸 Acute Pulmonary Embolism (PE)
ECG Changes
- Sinus tachycardia — most common finding (80%)
- S1Q3T3 pattern (McGinn-White sign) — S wave in I, Q wave and inverted T in III
- Right bundle branch block (RBBB) — complete or incomplete, due to acute RV pressure overload
- T-wave inversions V1–V4 — RV strain pattern
- Right axis deviation
- P pulmonale — peaked P waves in II (right atrial enlargement)
- Atrial arrhythmias — AF, flutter from RV dilation
ECG Image — Pulmonary Embolism with S1Q3T3
10. 🫁 Dilated Cardiomyopathy (DCM)
ECG Changes
- Left bundle branch block (LBBB) — broad notched R waves in I, aVL, V5–V6; deep S in V1–V3; >120 ms QRS
- Left ventricular hypertrophy — increased voltage criteria
- Poor R-wave progression in precordial leads (V1–V4 fail to develop normal R waves)
- Non-specific ST-T changes — ST depression, T-wave flattening or inversion
- Pathological Q waves — from fibrosis/scar mimicking infarction
- Atrial fibrillation or flutter — from atrial dilatation
- Ventricular ectopy — frequent PVCs, NSVT
- Prolonged PR interval (1st degree AV block)
ECG Image — Dilated Cardiomyopathy with LBBB
Quick Reference Summary Table
| # | Disease | Key ECG Finding |
|---|---|---|
| 1 | STEMI | ST elevation (convex) + reciprocal depression + Q waves |
| 2 | Atrial Fibrillation | Irregular RR, absent P waves, f-waves |
| 3 | Complete AV Block | P-QRS dissociation, bradycardia, escape rhythm |
| 4 | WPW Syndrome | Short PR + delta wave + wide QRS |
| 5 | Hypertrophic Cardiomyopathy | LVH + giant T inversions (apical) or strain pattern |
| 6 | Acute Pericarditis | Diffuse saddle ST elevation + PR depression |
| 7 | Brugada Syndrome | Coved ST elevation V1–V3 + inverted T wave |
| 8 | Long QT Syndrome | Prolonged QTc + T-wave abnormalities + TdP |
| 9 | Pulmonary Embolism | S1Q3T3 + sinus tachycardia + RBBB + RV strain |
| 10 | Dilated Cardiomyopathy | LBBB + poor R progression + arrhythmias |
Sources: Braunwald's Heart Disease (10th ed.), Rosen's Emergency Medicine; ECG images from PMC Clinical VQA database.
This is a shared conversation. Sign in to Orris to start your own chat.