Mechanics of human respiration Factors controlling respiration
Reading File
Finding Sources
Finding Sources
Finding Sources
Finding Sources
Finding Sources
Reading File
Reading File
Finding Sources
Finding Sources
Reading File
Reading File
Reading File
Reading File
Reading File
Loading Image
Loading Image
Loading Image
Here is a comprehensive overview of both topics, drawn from Guyton and Hall Textbook of Medical Physiology.
Mechanics of Human Respiration
1. Muscles of Ventilation
The lungs expand and contract by two mechanisms:
- Downward/upward movement of the diaphragm — lengthens or shortens the chest cavity (vertical diameter).
- Elevation/depression of the rib cage — increases or decreases the anteroposterior (AP) diameter.
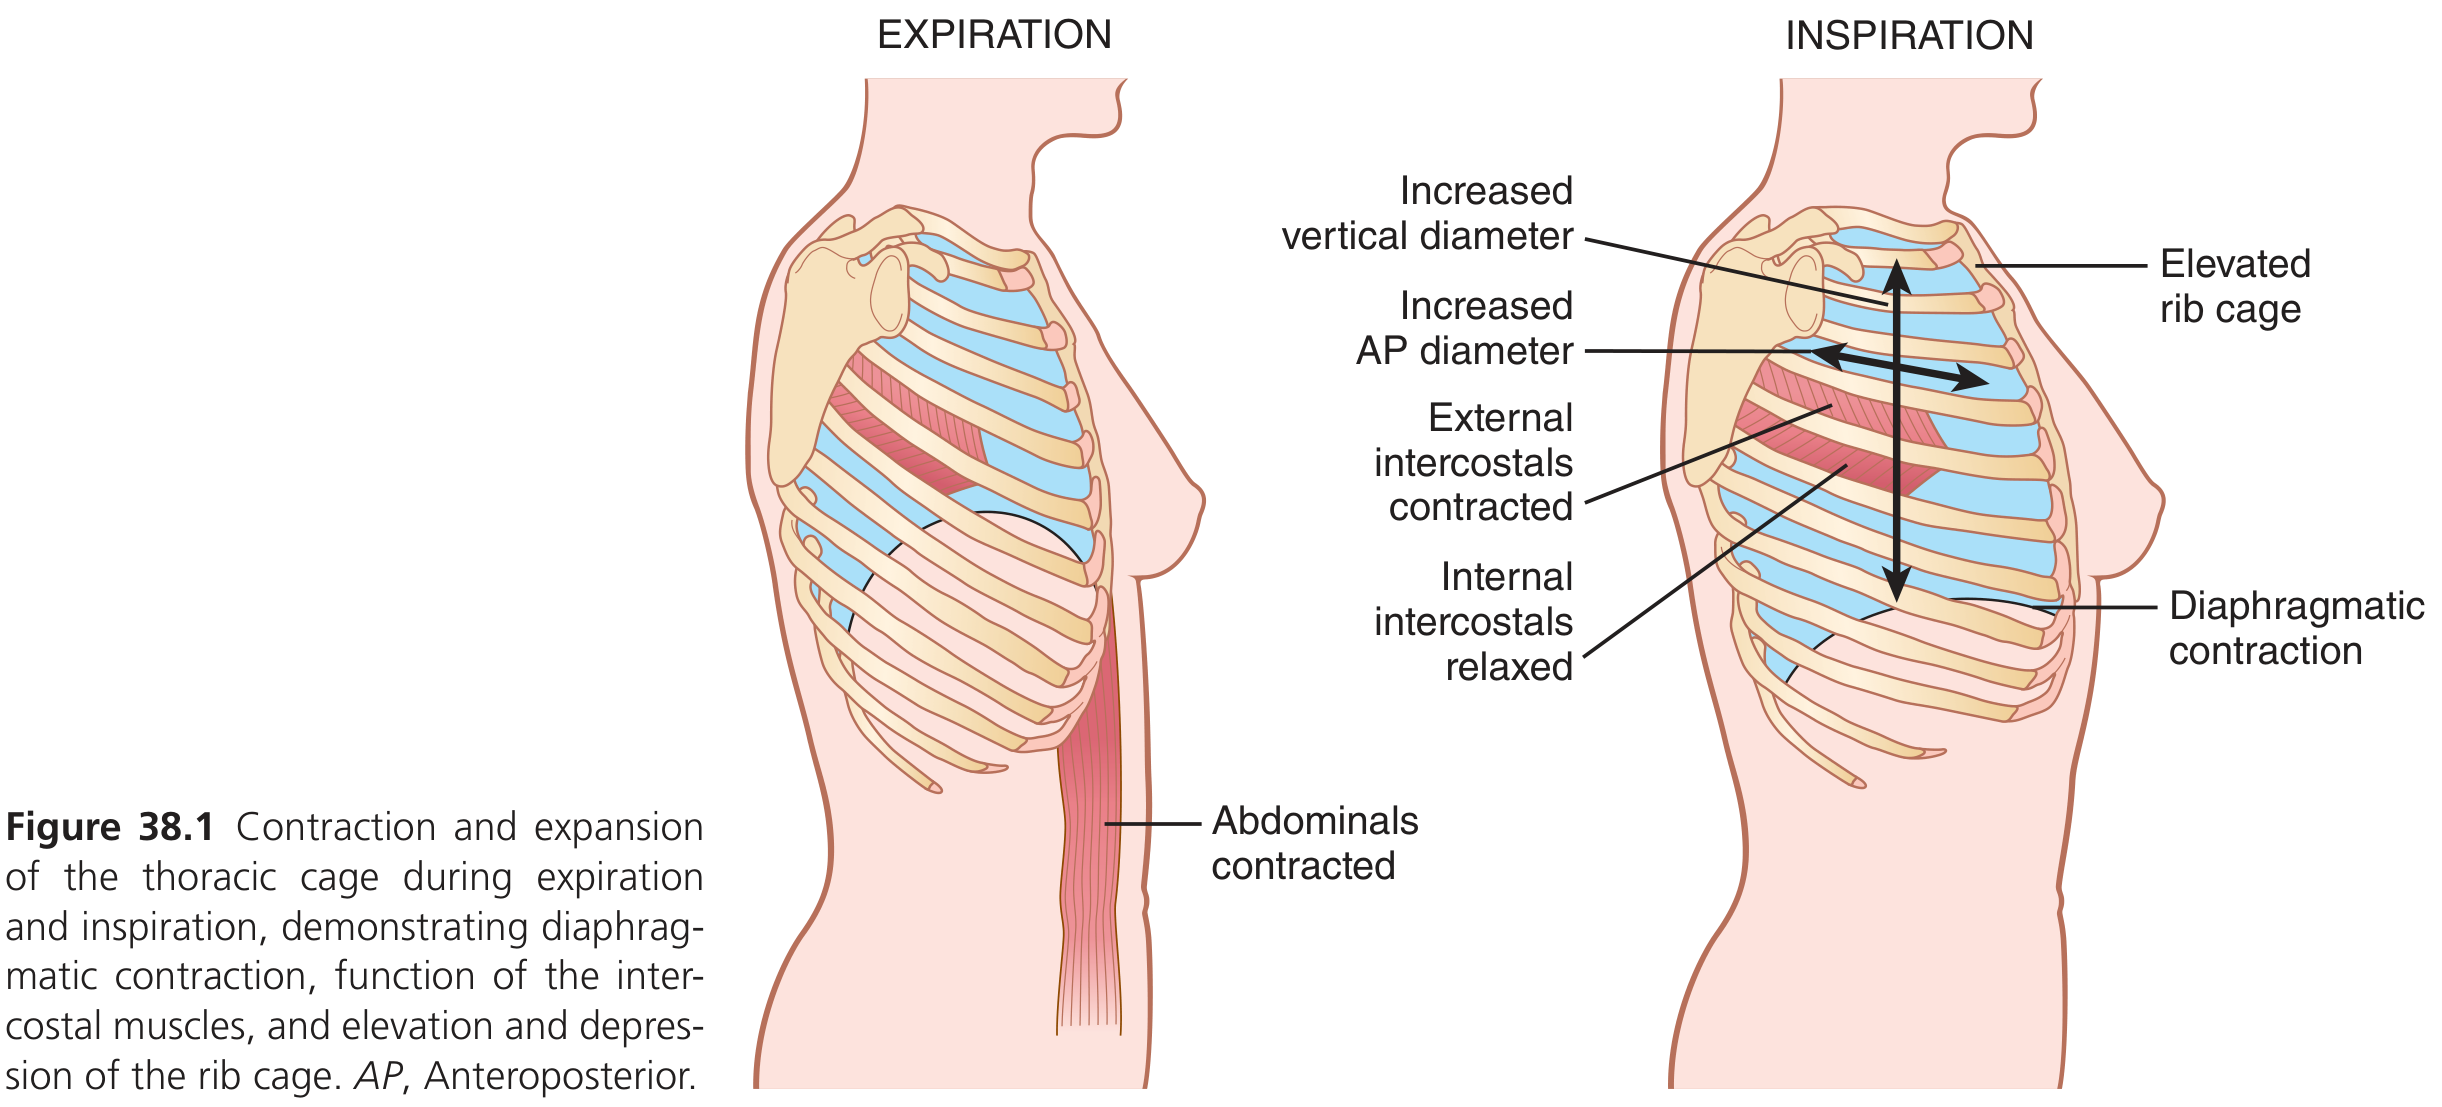
Muscles of Inspiration
- Diaphragm — primary muscle; its contraction pulls the lung bases downward.
- External intercostals — pull upper ribs forward, raising the rib cage.
- Accessory muscles (used in heavy breathing): sternocleidomastoid (lifts sternum), anterior serrati (lifts ribs), scaleni (lifts first two ribs).
Muscles of Expiration
- Normal quiet expiration is passive — driven by elastic recoil of lungs and chest wall.
- Forced expiration recruits: abdominal recti (pull lower ribs down, compress abdomen upward) and internal intercostals.
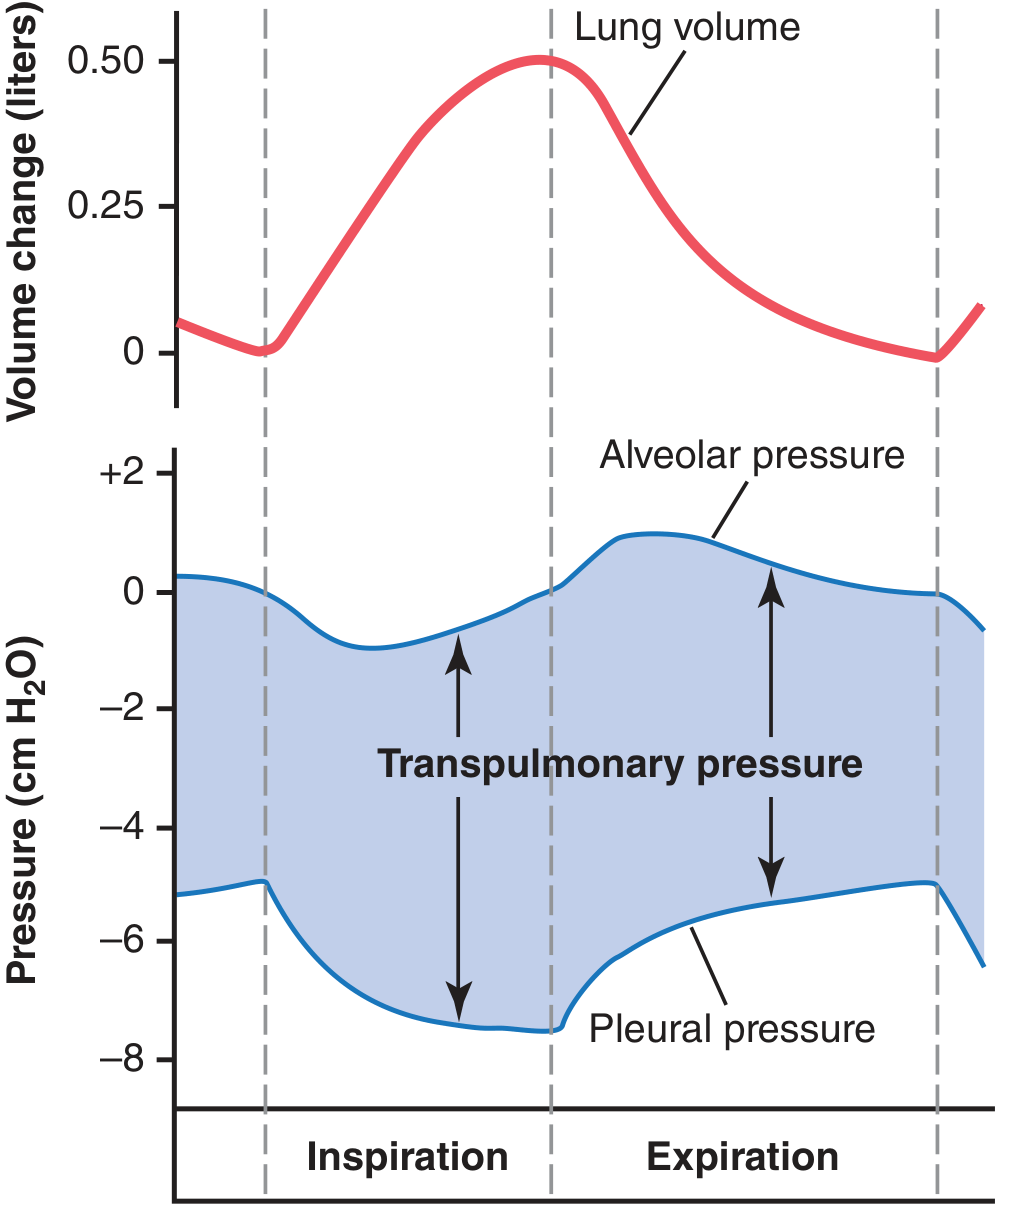
2. Pressures Governing Airflow
| Pressure | Resting | Inspiration | Expiration |
|---|---|---|---|
| Pleural pressure | −5 cm H₂O | −7.5 cm H₂O | returns to −5 |
| Alveolar pressure | 0 (= atm) | −1 cm H₂O | +1 cm H₂O |
| Transpulmonary pressure | ~5 cm H₂O | increases | decreases |
- Pleural pressure is a slight suction (negative) that holds the lung apposed to the chest wall. During inspiration, thoracic expansion pulls this to a more negative value, expanding the lungs.
- Alveolar pressure must drop below atmospheric (−1 cm H₂O) to draw 0.5 L of air in during quiet inspiration; it rises to +1 cm H₂O during expiration to push air out.
- Transpulmonary pressure = alveolar pressure − pleural pressure; it represents the elastic recoil force tending to collapse the lung.
3. Lung Compliance
Compliance = the volume change per unit change in transpulmonary pressure.
- Normal lungs alone: ~200 mL/cm H₂O
- Lungs + thoracic cage together: ~110 mL/cm H₂O (about half, because the chest wall adds its own resistance to expansion)
Two components determine lung elastic forces:
- Tissue elasticity — elastin and collagen fibers in lung parenchyma.
- Surface tension of alveolar fluid — the dominant factor (~2/3 of total); counteracted by surfactant (secreted by type II pneumocytes), which dramatically lowers surface tension and prevents alveolar collapse (atelectasis).
4. Work of Breathing
The work of inspiration has three fractions:
- Compliance (elastic) work — expanding lungs and chest against elastic recoil.
- Tissue resistance work — overcoming viscosity of lung and chest wall.
- Airway resistance work — overcoming friction of airflow through airways.
At rest, respiration uses only 3–5% of total body energy expenditure. During heavy exercise, this can rise up to 50-fold, becoming a limiting factor when airway resistance is elevated or compliance is reduced.
5. Pulmonary Volumes and Capacities (Spirometry)
| Parameter | Typical Value |
|---|---|
| Tidal volume (TV) | ~500 mL |
| Inspiratory reserve volume (IRV) | ~3,000 mL |
| Expiratory reserve volume (ERV) | ~1,100 mL |
| Residual volume (RV) | ~1,200 mL |
| Inspiratory capacity (IC) | TV + IRV ≈ 3,500 mL |
| Functional residual capacity (FRC) | ERV + RV ≈ 2,300 mL |
| Vital capacity (VC) | IRV + TV + ERV ≈ 4,600 mL |
| Total lung capacity (TLC) | ~5,800 mL |
Factors Controlling Respiration
1. The Respiratory Center
Located bilaterally in the medulla oblongata and pons, it is divided into three main groups:
| Group | Location | Function |
|---|---|---|
| Dorsal Respiratory Group (DRG) | Dorsal medulla (nucleus tractus solitarius) | Generates inspiratory rhythm; receives input from chemoreceptors, baroreceptors, lung receptors |
| Ventral Respiratory Group (VRG) | Ventrolateral medulla | Active in both inspiration and expiration; drives accessory muscles during heavy breathing |
| Pneumotaxic Center | Superior pons (dorsal) | Limits duration of inspiration → increases respiratory rate; "switches off" inspiration |
The pre-Bötzinger complex (rostral VRG) contains spontaneously firing pacemaker neurons and is considered the key component of the central pattern generator for respiratory rhythm.
2. Chemical Control — CO₂ and H⁺ (Central Chemoreceptors)
The most important chemical driver of ventilation is CO₂/H⁺, acting on central chemoreceptors located on the ventral surface of the medulla.
- CO₂ diffuses across the blood–brain barrier → combines with water → carbonic acid → H⁺
- Rising H⁺ (falling pH) powerfully stimulates the respiratory center → increased rate and depth.
- A rise of just a few mm Hg in arterial PCO₂ can double ventilation.
- Conversely, CO₂ changes have virtually no direct effect on O₂ sensing at the central level — that is handled peripherally.
3. Peripheral Chemoreceptors — O₂, CO₂, H⁺
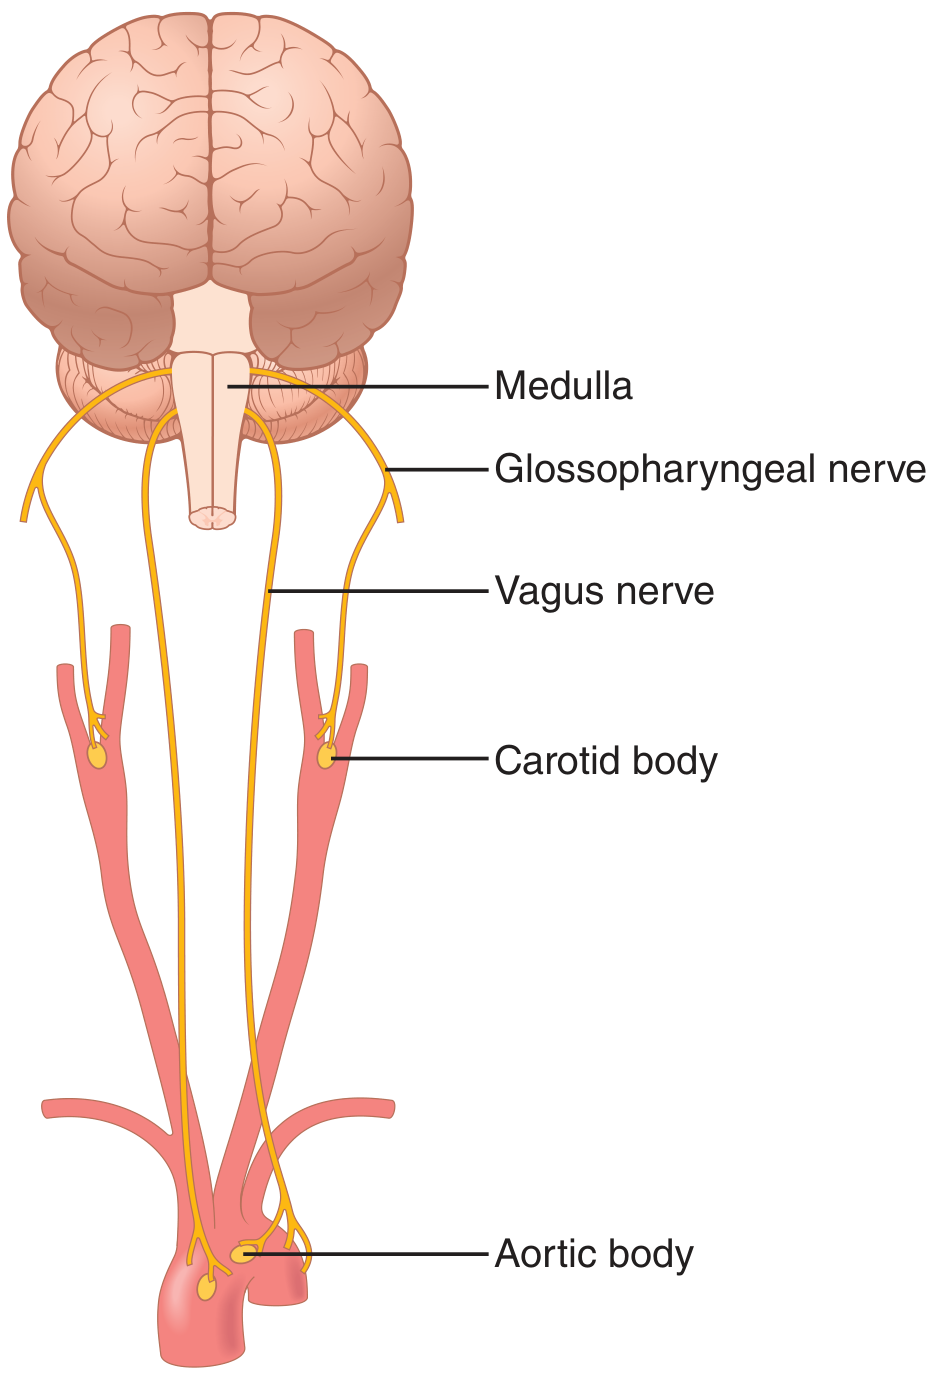
Located in the carotid bodies (at carotid bifurcations, signaling via CN IX) and aortic bodies (along aortic arch, signaling via CN X vagus).
- Stimulated primarily by low arterial PO₂ — response is most sensitive when PO₂ falls below 60 mm Hg.
- Also respond to elevated PCO₂ and elevated H⁺ (though these are secondary roles compared with central chemoreceptors).
- Receive direct arterial blood supply; blood flow is ~20× their body weight per minute, so they always sample arterial (not venous) blood.
Why O₂ is a secondary controller: Hemoglobin's buffering capacity means that adequate O₂ delivery to tissues is maintained across a wide range of pulmonary PO₂ (60–1000 mm Hg). CO₂, by contrast, changes directly and proportionally with ventilation rate — making it the primary feedback signal.
4. Hering–Breuer Inflation Reflex
Stretch receptors in bronchial/bronchiolar walls → signals via the vagus to the DRG → terminate inspiration when lungs are over-inflated. This reflex is strongest in infants; in adults it plays only a minor role during normal breathing but becomes active during tidal volumes >1.5 L.
5. Other Factors Affecting Respiration
| Factor | Effect |
|---|---|
| Exercise | Ventilation rises 20-fold; largely neurogenic (motor cortex collateral signals); also arterial PCO₂ is tightly maintained near 40 mm Hg by a learned cortical response |
| Irritant receptors (airway epithelium) | Triggered by capsaicin, particulates, inflammatory mediators → cough, sneeze, bronchospasm (relevant in asthma) |
| J receptors (juxtacapillary, alveolar wall) | Stimulated by pulmonary capillary engorgement/edema → dyspnea and increased respiratory rate |
| Brain edema | Compresses cerebral arteries → depresses respiratory center → hypoventilation |
| Anesthetics / narcotics | Depress respiratory center; overdose → respiratory arrest |
| High altitude | Low PO₂ stimulates peripheral chemoreceptors → hyperventilation → blows off CO₂ → respiratory alkalosis → partially limits hyperventilation |
| Voluntary cortical control | Cerebral cortex can override the automatic rhythm (e.g., breath-holding, speech, singing) |
Source: Guyton and Hall Textbook of Medical Physiology, Chapters 38 & 42
Clinical application of oxygen dissociation curve, bohr and double bohr effect
Finding Sources
Finding Sources
Reading File
Reading File
Finding Sources
Reading File
Reading File
Reading File
Reading File
Reading File
Reading File
Loading Image
Loading Image
Loading Image
Now I have all the material needed. Let me compile the comprehensive answer.
Oxygen–Haemoglobin Dissociation Curve, Bohr Effect & Double Bohr Effect
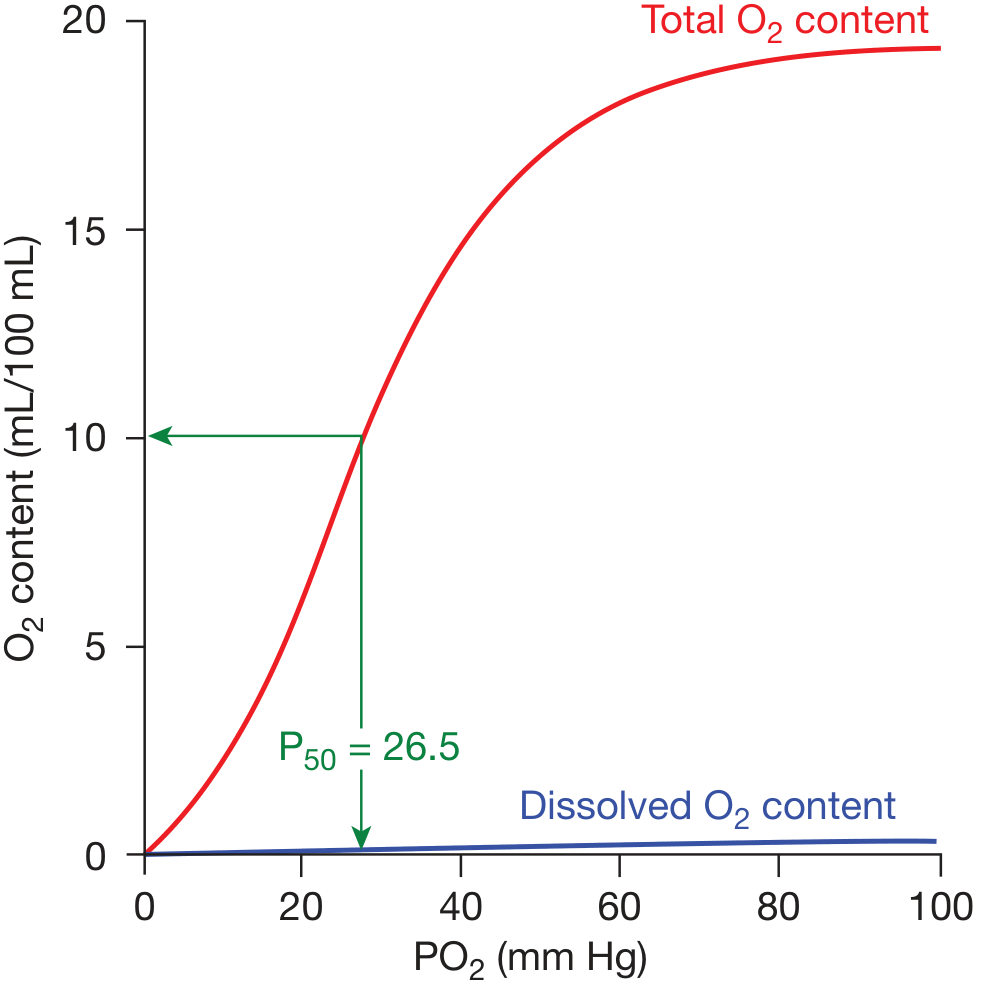
1. The Oxygen–Haemoglobin Dissociation Curve
Shape and Significance
The ODC plots the percentage saturation of haemoglobin (or O₂ content in mL/dL) against the partial pressure of oxygen (PO₂). The curve is sigmoid (S-shaped), not hyperbolic, because of the cooperative binding of O₂ to Hb — as one heme group binds O₂, the quaternary structure of the Hb tetramer shifts from the low-affinity T (tense) state toward the high-affinity R (relaxed) state, progressively increasing the affinity of remaining heme groups.
Key Reference Points
| Point | PO₂ | SpO₂ | Clinical meaning |
|---|---|---|---|
| Arterial blood | ~95 mm Hg | ~97% | Normal loading plateau |
| P50 | 26.5 mm Hg | 50% | Standard measure of Hb–O₂ affinity |
| Mixed venous blood (rest) | ~40 mm Hg | ~75% | Only ~25% of delivered O₂ extracted at rest |
| Heavy exercise (muscle) | ~15 mm Hg | ~19% | Up to 75% of O₂ unloaded |
The Two Functional Zones of the Curve
-
Upper flat portion (PO₂ 60–100 mm Hg): Even with significant falls in arterial PO₂ (e.g., due to lung disease or altitude), Hb saturation changes very little. Clinical advantage: SpO₂ stays near-normal until PO₂ drops below ~60 mm Hg — a safety buffer for lung disease patients.
-
Lower steep portion (PO₂ 20–60 mm Hg): Small drops in PO₂ cause large releases of O₂. Clinical advantage: Metabolically active tissues can extract large O₂ quantities with only a moderate fall in tissue PO₂, maintaining diffusion gradients into cells.
Oxygen Carrying Capacity
Each gram of Hb binds 1.34 mL O₂. With normal Hb of 15 g/dL:
- O₂ capacity = 15 × 1.34 = ~20 mL O₂/100 mL blood (20 vol%)
- At rest, ~5 mL/100 mL is delivered (difference between 97% and 75% saturation)
- During heavy exercise, delivery can rise to ~15 mL/100 mL
2. Factors Shifting the ODC — The P50 Concept
The P50 (PO₂ at 50% Hb saturation, normally 26.5 mm Hg) quantifies the shift. The curve's sigmoid shape is retained; it moves along the PO₂ axis.
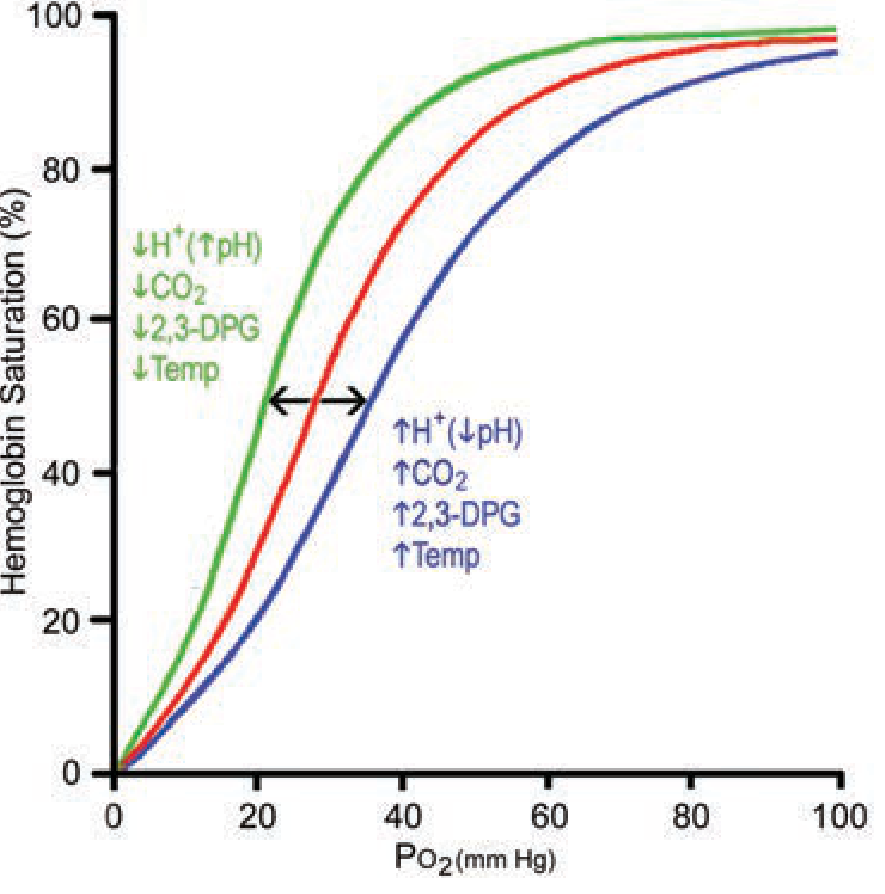
| Factor | Curve shift | Effect on tissues | Effect in lungs |
|---|---|---|---|
| ↑ H⁺ (↓ pH) | Right | More O₂ unloaded | Less O₂ loaded |
| ↑ PCO₂ | Right | More O₂ unloaded | Less O₂ loaded |
| ↑ Temperature | Right | More O₂ unloaded | Less O₂ loaded |
| ↑ 2,3-DPG | Right | More O₂ unloaded | Less O₂ loaded |
| ↓ pH / ↑ CO₂ / ↑ Temp / ↑ 2,3-DPG | Left (reverse) | Less unloading | More loading |
3. The Bohr Effect
Definition
Described by Christian Bohr in 1904: an increase in CO₂ or H⁺ (fall in pH) decreases haemoglobin's affinity for O₂, shifting the ODC to the right.
The overall Bohr effect has two separable components:
a) pH-Bohr Effect (dominant component)
Deoxy-Hb has a greater affinity for H⁺ than oxy-Hb. This is because ionisable groups (particularly His-146 of the β-chain and Val-1 of the α-chain) have higher pK values in the T-state than the R-state. As tissues produce acid:
Hb(O₂)₄ + 2H⁺ ⇌ Hb(H⁺)₂ + 4O₂
The binding of H⁺ stabilises the T-state → lowers O₂ affinity → O₂ unloaded.
b) CO₂-Bohr Effect (minor component)
CO₂ directly binds to terminal amino groups of Hb, forming carbamino compounds, and this too stabilises the T-state and reduces O₂ affinity. Studying this at fixed pH isolates the true CO₂-Bohr effect, which accounts for a small fraction of the overall shift.
Physiological Role in the Tissues
As erythrocytes enter systemic capillaries:
- Metabolically active cells release CO₂ → enters RBCs → ↑ intracellular PCO₂ → ↑ H₂CO₃ → ↑ H⁺
- H⁺ binds Hb → right shift → more O₂ unloaded to tissues
- Heat from metabolism (especially in exercising muscle, up to 40°C) amplifies this right shift
As erythrocytes enter pulmonary capillaries:
- CO₂ diffuses into alveoli → ↓ PCO₂ and ↓ H⁺ in blood
- Left shift of ODC → enhanced O₂ loading from alveoli
This is the operational Bohr effect at every breath — a self-regulating system that supplies more O₂ precisely where and when it is most needed.
Clinical Relevance of Bohr Effect
| Clinical Scenario | Direction | Consequence |
|---|---|---|
| Metabolic acidosis (DKA, sepsis) | Right shift | Enhanced O₂ delivery to tissues; but SpO₂ appears lower for same PO₂ |
| Respiratory acidosis (COPD, hypoventilation) | Right shift | Same; may compensate partially for tissue hypoxia |
| Alkalosis (hyperventilation, over-correction of acidosis) | Left shift | Hb holds O₂ tighter → impaired O₂ release to tissues despite normal SpO₂ |
| Carbon monoxide poisoning | Extreme left shift | HbCO stabilises R-state → remaining O₂ is held tightly, not released to tissues |
| Stored bank blood (↓ 2,3-DPG) | Left shift | Transfused RBCs load O₂ well but unload poorly for ~24h |
4. 2,3-Diphosphoglycerate (2,3-DPG/BPG)
- A glycolytic intermediate abundant in RBCs (~5 mM).
- Binds electrostatically to the widened gap between β-chains in the T-state, stabilising deoxy-Hb and shifting ODC to the right.
- Normal function: keeps the baseline ODC shifted moderately right to facilitate tissue O₂ delivery.
- Hypoxia: 2,3-DPG levels rise within hours → right shift → extra O₂ unloaded at ~10 mm Hg higher tissue PO₂ than without the adaptation.
- Clinical relevance: high altitude acclimatisation, chronic anaemia, chronic lung disease all raise 2,3-DPG as a compensatory mechanism.
5. The Double Bohr Effect
Setting: The Placenta
This is a specialised application of the Bohr effect operating simultaneously in two circulations at the placenta, making O₂ transfer from mother to fetus far more efficient.
Mechanism
At the placenta, fetal blood arrives carrying large amounts of CO₂ (high PCO₂). As the two circulations interface:
-
CO₂ diffuses from fetal blood → maternal blood
- Fetal blood loses CO₂ → becomes more alkaline → left shift of fetal ODC → fetal Hb picks up more O₂
- Maternal blood gains CO₂ → becomes more acidic → right shift of maternal ODC → maternal Hb releases more O₂
-
The Bohr effect therefore operates in opposite directions simultaneously:
- In fetal blood: ↑ pH → left shift → enhanced O₂ uptake
- In maternal blood: ↓ pH → right shift → enhanced O₂ release
"These two effects make the Bohr shift twice as important here as it is for oxygen exchange in the lungs; therefore, it is called the double Bohr effect." — Guyton and Hall Textbook of Medical Physiology
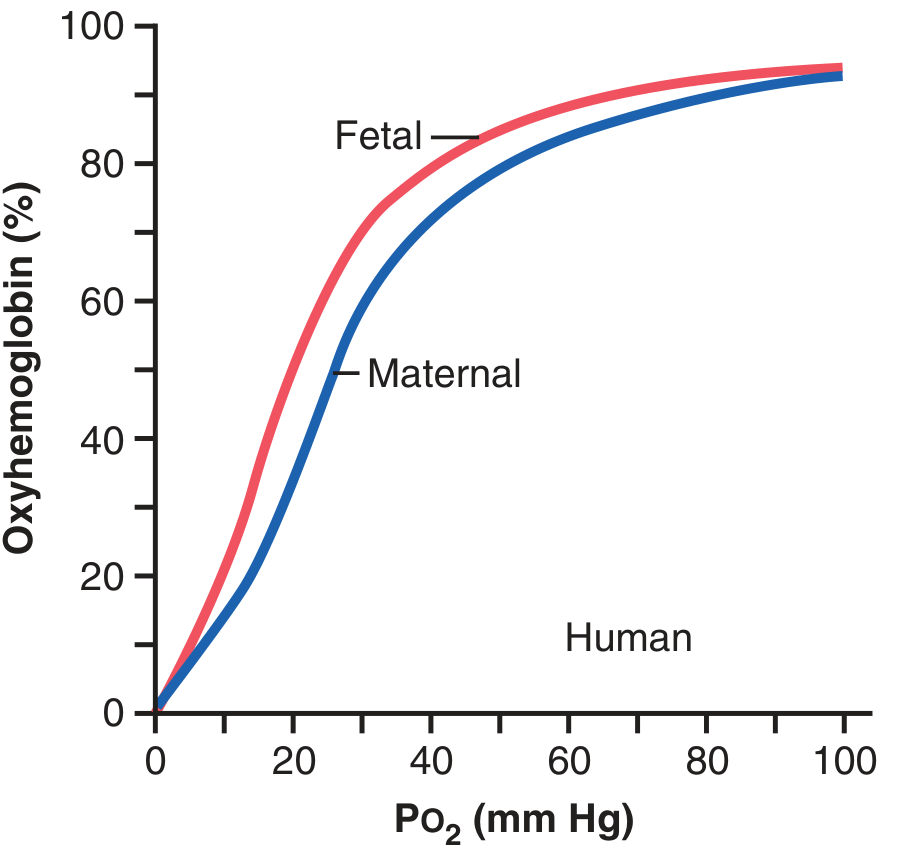
Three Mechanisms Helping Fetal O₂ Transport
| Mechanism | Advantage |
|---|---|
| Fetal HbF (γ-chains instead of β-chains; binds 2,3-DPG less avidly) | Left-shifted ODC; carries 20–50% more O₂ at low PO₂ |
| Higher fetal Hb concentration (~50% greater than maternal) | Greater O₂ carrying capacity |
| Double Bohr effect | Simultaneous enhancement of maternal O₂ release and fetal O₂ uptake |
By these three mechanisms, the fetus receives sufficient O₂ even though fetal blood leaves the placenta at a PO₂ of only ~30 mm Hg.
Summary Table
| Concept | Core Mechanism | Shift | Key Clinical Application |
|---|---|---|---|
| ODC sigmoid shape | Cooperative O₂ binding (T↔R states) | — | SpO₂ safe until PO₂ <60; steep tissue unloading zone |
| Bohr effect | ↑H⁺/↑CO₂ stabilise T-state → ↓O₂ affinity | Right | Tissue hypoxia, exercise, acidosis, CO poisoning |
| 2,3-DPG effect | Binds deoxy-Hb β-chains, stabilises T-state | Right | Altitude adaptation; stored blood problem |
| Left-shift causes | ↑pH, ↓CO₂, ↓temp, ↓DPG, HbF, HbCO | Left | Alkalosis, hypothermia, neonatal physiology, CO poisoning |
| Double Bohr effect | Simultaneous opposite Bohr shifts at placenta | Bidirectional | Fetal O₂ acquisition at low placental PO₂ |
Sources: Fishman's Pulmonary Diseases and Disorders, p. 255–256 · Guyton and Hall Textbook of Medical Physiology, Chapters 41 & 83 · Medical Physiology (Boron & Boulpaep), Chapter 29
This is a shared conversation. Sign in to Orris to start your own chat.