
structure of virus
virus structure diagram capsid envelope nucleic acid
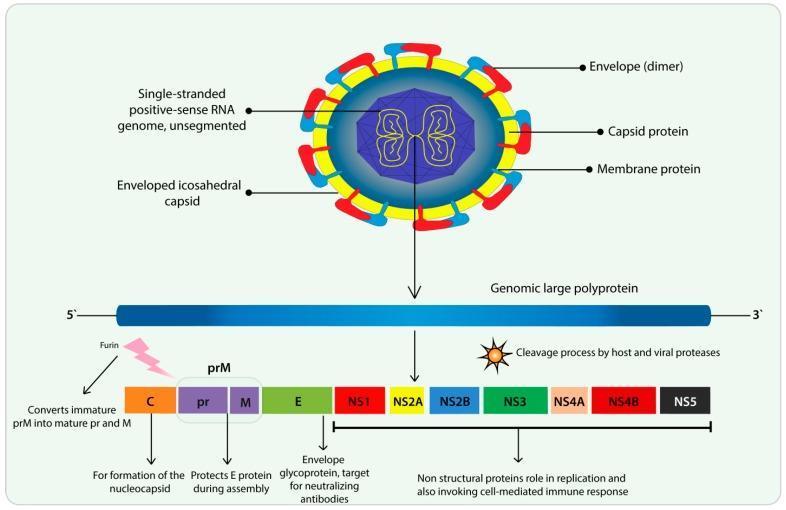
This medical illustration details the structure and genomic organization of the Zika virus (ZIKV). The upper section features a cross-sectional diagram of the virion, depicting an enveloped icosahedral capsid containing a single-stranded, unsegmented positive-sense RNA genome. Key components include the surface envelope protein dimers, the underlying membrane protein, and the internal capsid protein. The lower section illustrates the viral life cycle's translation phase, showing the genomic large polyprotein (5' to 3'). It demonstrates the cleavage process by host and viral proteases into specific structural and non-structural proteins. The structural segment includes Capsid (C), precursor Membrane (prM), and Envelope (E) proteins. The maturation of prM into pr and M by the Furin protease is specifically highlighted. Seven non-structural proteins (NS1, NS2A, NS2B, NS3, NS4A, NS4B, and NS5) are shown, which are critical for viral replication and the host cell-mediated immune response. This diagram serves as an educational resource for understanding Flaviviridae virology, protein synthesis, and potential targets for neutralizing antibodies.
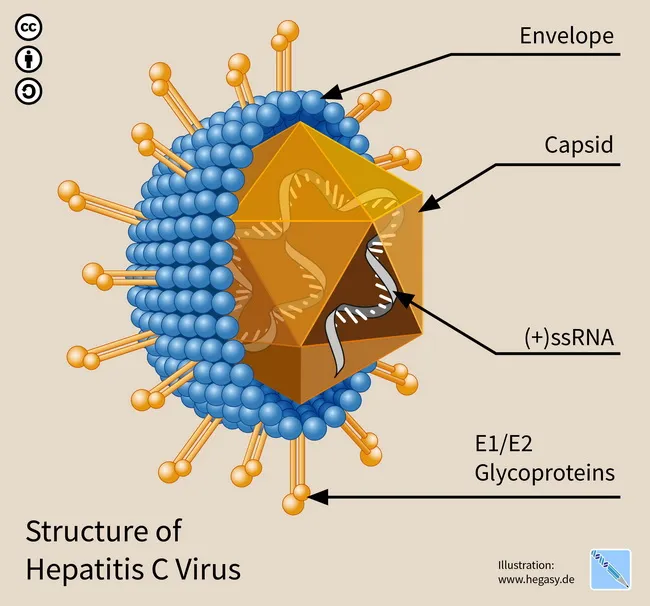
Imaging Modality: Educational digital illustration illustrating the structure of Hepatitis C virus (HCV). Technique: Digital vector rendering with color coding to distinguish the envelope, capsid, nucleic acid, and surface glycoproteins. This is not a clinical radiograph or microscopic image but a schematic cross‑section designed for teaching virology and infectious disease concepts. Location/Anatomical Context: depiction of a single enveloped virion, representing the extracellular particle rather than infected tissue; the virion comprises an outer envelope (lipid bilayer) containing E1/E2 glycoproteins surrounding the core capsid and the positive-sense single-stranded RNA genome. The RNA genome is depicted internally with associated nucleocapsid; annotations indicate (+)ssRNA, genome organization, and virion polarity. Pathological/Clinical Significance: emphasizes HCV biology relevant to pathogenesis and clinical disease, including its hepatotropism and reported associations with B-cell non-Hodgkin lymphomas such as extranodal marginal zone lymphoma (MALT lymphoma); antiviral therapy can clear infection and, in some cases, correlate with lymphoma regression. Diagnostic/educational relevance: supports molecular virology, vaccine design, antiviral targets (RNA polymerase, protease), and interpretation of host–virus interactions in hepatology and hematology. Use cases include medical education, conference materials, and research reviews on HCV structure–function relationships. (Credit: Guido4; CC BY-SA 4.0) Educational context includes virology exam prep, lecture slides, and online educational repositories for medical learners.
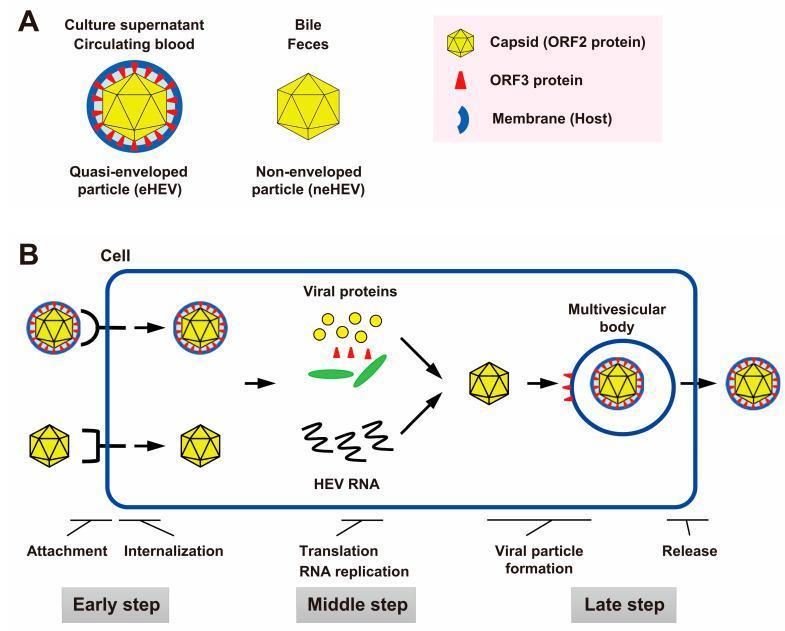
Educational medical diagram illustrating the Hepatitis E virus (HEV) particle structure and life cycle. Section A compares two distinct viral forms: the non-enveloped particle (neHEV), a simple yellow polyhedral capsid (ORF2 protein) found in bile and feces; and the quasi-enveloped particle (eHEV), found in circulating blood and culture supernatant, which features the same yellow capsid surrounded by a host-derived blue lipid membrane punctuated with red ORF3 proteins. Section B details the HEV cellular life cycle in three stages: the early step (attachment and internalization into the host cell); the middle step (translation of viral proteins and RNA replication); and the late step (viral particle formation where the capsid acquires an envelope from the multivesicular body, followed by virion release). The diagram serves as a model for understanding viral pathogenesis and identifying potential drug targets at various stages of the viral cycle, emphasizing the role of the ORF3 protein in the exit of quasi-enveloped particles.
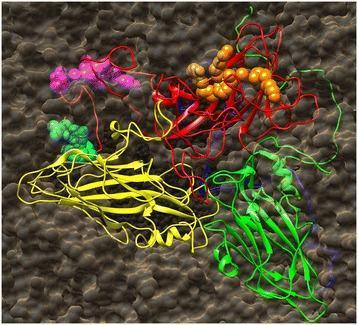
This molecular diagram illustrates the structural organization of the Mengo virus (a member of the Picornaviridae family) capsid and its antigenic epitopes. The visualization, generated via UCSF Chimera, depicts the viral capsid proteins as ribbons against a dark, textured surface representing the viral particle. The proteins are color-coded as follows: VP1 (red ribbon), VP2 (yellow ribbon), VP3 (green ribbon), and VP4 (blue ribbon, largely obscured). Three specific immunodominant epitopes are represented as spheres to show their relative spatial accessibility: the V(2)ENAEK(7) epitope is shown in cyan, the F(19)VAQPVY(25) epitope in magenta, and the P(42)IGAFTVK(49) epitope in orange. The cyan and magenta epitopes appear partially recessed or buried within the capsid structure, while the orange epitope is prominently displayed on the surface near the five-fold icosahedral axis of symmetry. This diagram is a critical educational tool for understanding viral immunology, epitope mapping, and the structural basis for monoclonal antibody (McAb) reactivity in Encephalomyocarditis virus (EMCV) research.
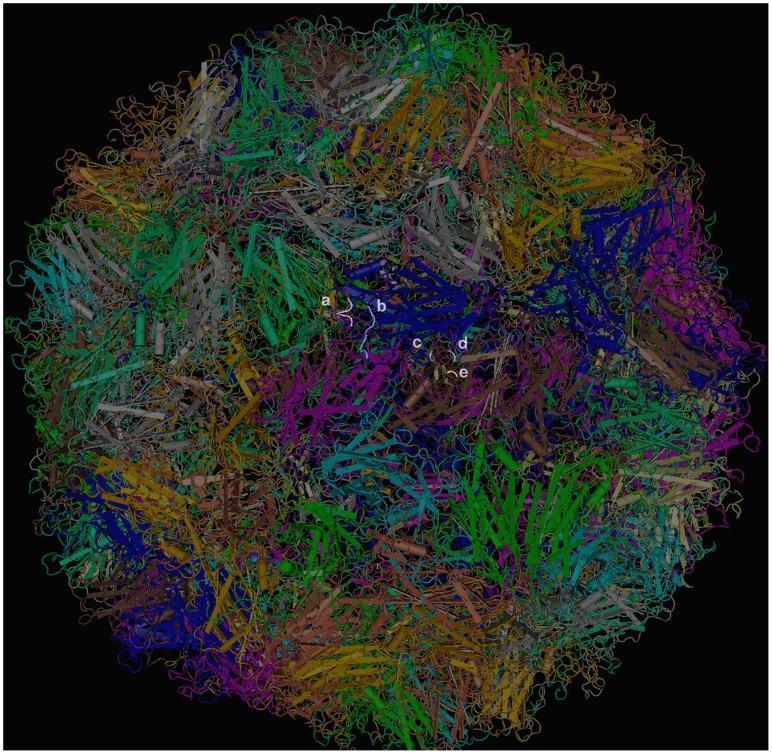
This diagnostic diagram presents the 3D crystal structure of the Enterovirus 71 (EV71) C4 whole virus particle, visualized using molecular modeling software. The image depicts a spherical viral capsid composed of intricately arranged protein subunits represented by a dense network of multicolored ribbons and cylinders, signifying different viral capsid proteins (VP1, VP2, and VP3). Key epitopes and mutation sites are mapped onto the virion surface using a color-coding system indicated by lowercase labels (a–e). Label 'a' (grey) identifies the neutralizing epitope of monoclonal antibody (mAb) 51 on VP1. Label 'b' (blue) marks the epitope of mAb 7C7 on VP2. Labels 'c' (purple), 'd' (pink), and 'e' (yellow) represent critical escape mutation sites (62A, 67E, and 59P respectively) on the VP3 protein 'knob' region associated with mAb 10D3. This visualization serves as an educational tool for understanding viral structural biology, antigenic site localization, and the molecular mechanisms of viral escape from antibody neutralization in Hand, Foot, and Mouth Disease (HFMD).
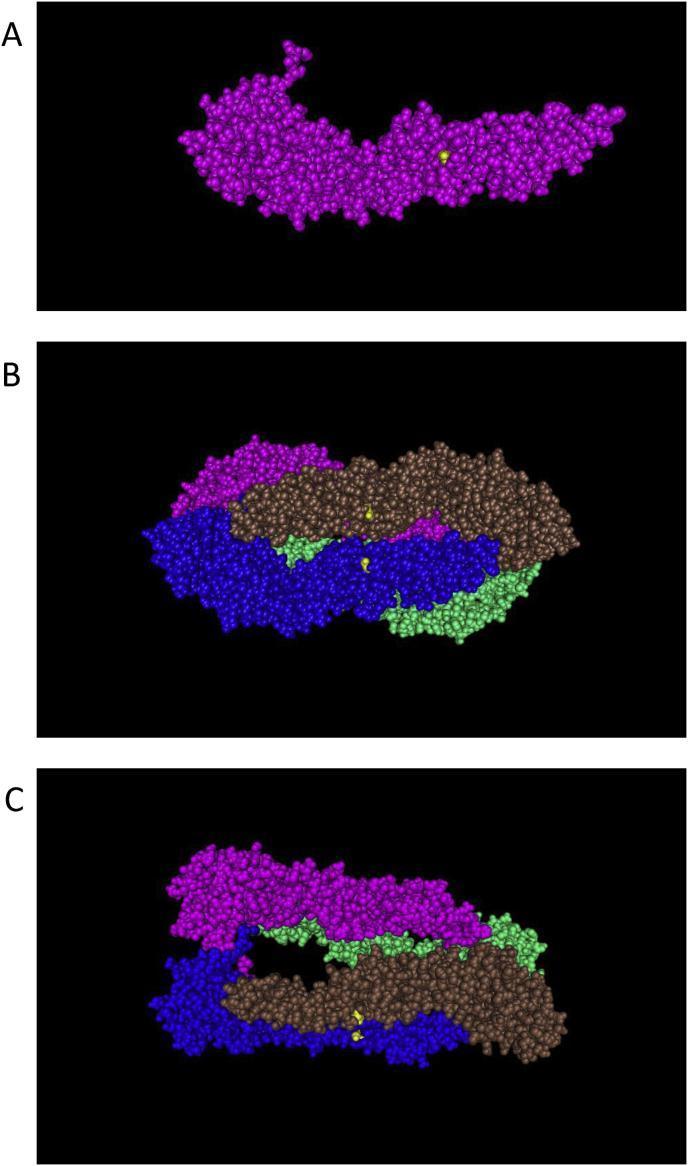
This molecular graphics illustration depicts the protein structure of the Japanese encephalitis virus (JEV) Envelope (E) protein, derived from PDB accession code 3P54. The visualization is divided into three panels (A, B, and C) using a space-filling model to represent molecular volume and surface topology. Panel A displays the asymmetric unit as an elongated, purple-colored monomer, highlighting the location of a specific amino acid residue (serine) at position 123 with a distinct yellow sphere on its surface. Panels B and C represent the biological unit as a tetramer, consisting of four individual E protein monomers color-coded in purple, green, brown, and blue. These panels illustrate the complex quaternary arrangement and inter-monomer interactions. Panel B shows a compact top-down view, while Panel C provides an alternative perspective, demonstrating the spatial orientation of the serine 123 residues (yellow spheres) within the larger molecular assembly. This diagram serves as an educational tool for virology and structural biology, emphasizing the surface accessibility of residue 123, which is a critical site for determining viral virulence and pathogenicity.
Structure of a Virus
1. Viral Genome (Nucleic Acid Core)
- Viruses contain either DNA or RNA - never both simultaneously.
- The genome may be:
- Single-stranded (ss) or double-stranded (ds)
- Linear or circular
- Segmented (e.g., influenza - 8 RNA segments) or non-segmented
- DNA genome size: 3.2 kbp (hepadnaviruses) to 375 kbp (poxviruses)
- RNA genome size: ~4 kb (picobirnaviruses) to 32 kb (coronaviruses)
- Positive-sense RNA (e.g., picornaviruses, togaviruses): acts directly as mRNA; isolated RNA is infectious
- Negative-sense RNA (e.g., rhabdoviruses, orthomyxoviruses): must be first transcribed; the isolated RNA is NOT infectious on its own
2. Capsid
- The protein shell surrounding and protecting the nucleic acid.
- Built from repeated protein subunits called capsomeres, which self-assemble.
- The capsid + enclosed nucleic acid = the nucleocapsid.
- "Packaging sequences" on viral nucleic acid guide assembly into capsids.
- Empty capsid shells can form without nucleic acid ("virus-like particles"), which are exploited in vaccine design (e.g., HPV vaccine).
Types of Capsid Symmetry
| Type | Description | Example Viruses |
|---|---|---|
| Cubic (Icosahedral) | 20 equilateral triangular faces, 12 vertices; most efficient closed shell; appears spherical | Adenovirus, Poliovirus, Herpesvirus |
| Helical | Protein subunits wind periodically around the RNA in a helix; always enveloped in animal viruses | Influenza, Rabies (rhabdovirus), Measles |
| Complex | Irregular, not simple cubic or helical | Poxvirus (brick-shaped, with ridges, core, and lateral bodies) |
3. Viral Envelope (present in some viruses)
- A lipid bilayer membrane acquired when the nucleocapsid buds through a host cell membrane (plasma membrane, nuclear membrane, or ER/Golgi).
- The phospholipid composition reflects the specific host cell membrane involved - e.g., herpesviruses bud through the nuclear membrane, so their envelope lipids mirror the nuclear membrane.
- Enveloped viruses are sensitive to ether and organic solvents (lipid disruption = loss of infectivity).
- Non-enveloped (naked) viruses are generally resistant to ether and detergents.
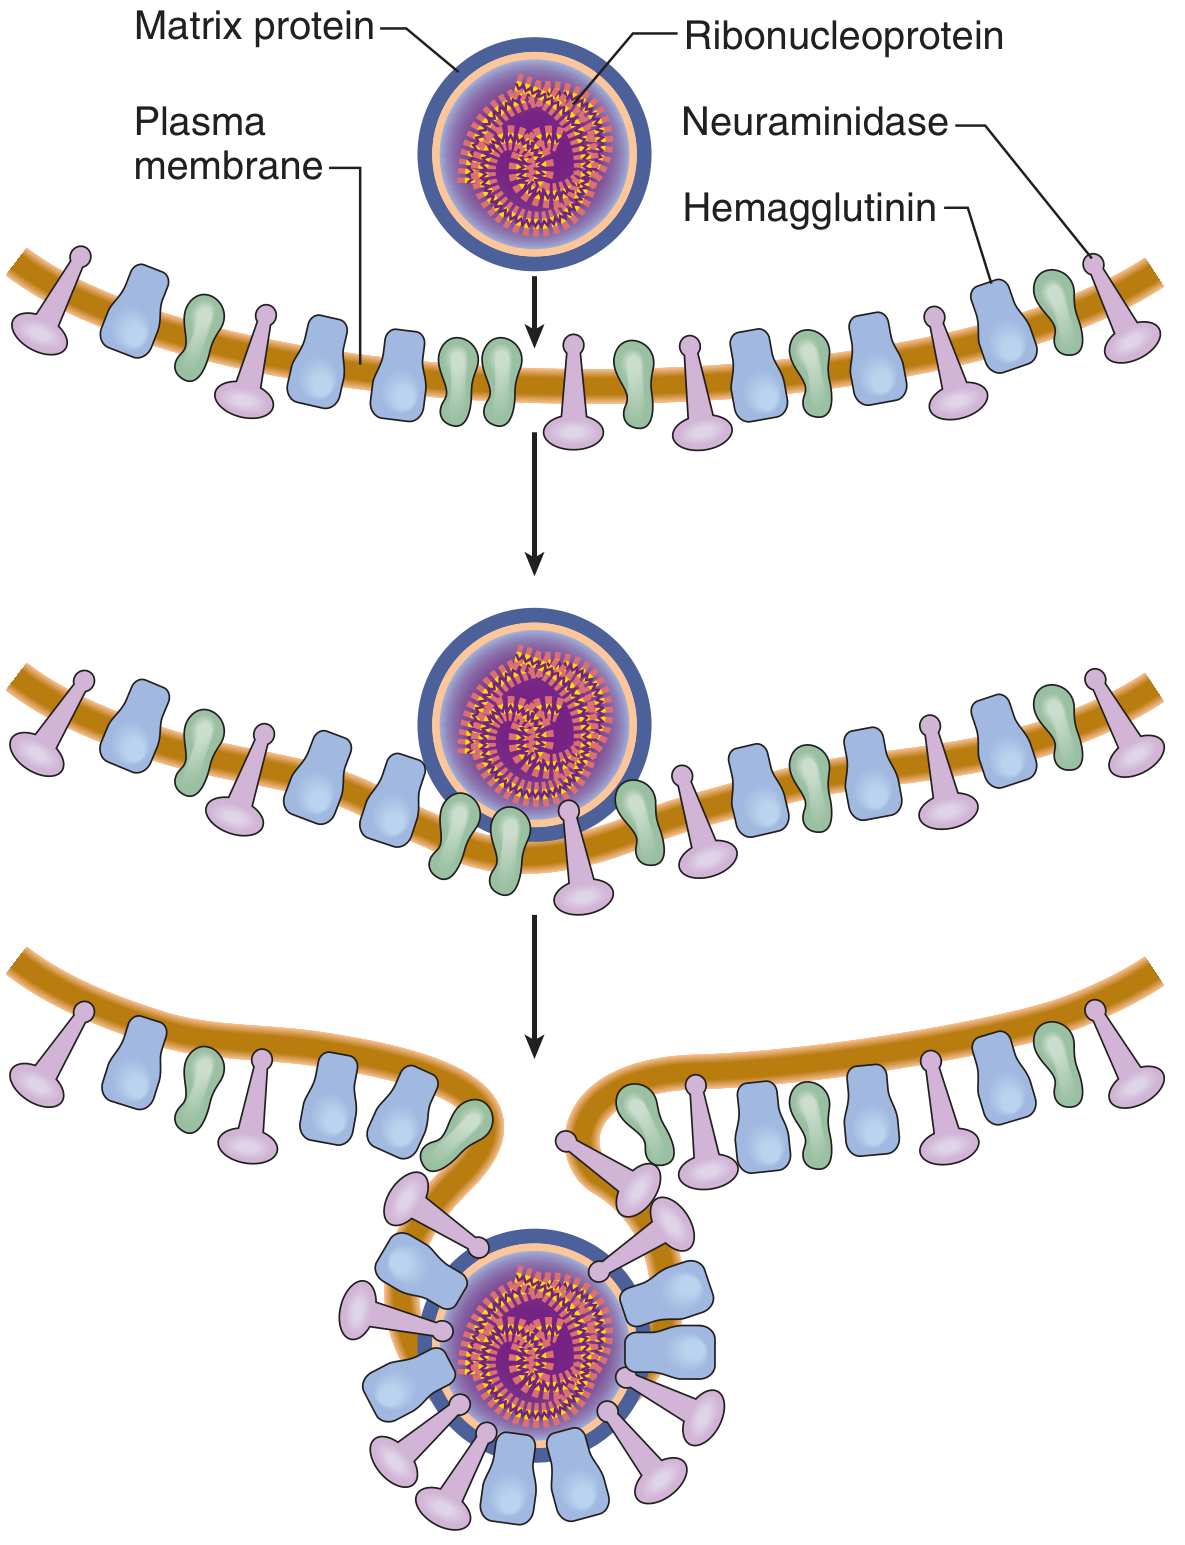
4. Viral Glycoproteins (Envelope Spikes)
- Virus-encoded glycoproteins are embedded in the lipid envelope, projecting as surface spikes.
- The sugars added to glycoproteins reflect the host cell type.
- Functions:
- Attachment to host cell surface receptors (tropism)
- Membrane fusion during cell entry
- Major antigens - target of neutralizing antibodies
- Examples: Hemagglutinin (HA) and Neuraminidase (NA) of influenza; gp120/gp41 of HIV; Spike protein of SARS-CoV-2.
5. Matrix Protein (in enveloped viruses)
- A layer of protein (the matrix) lies between the inner surface of the envelope and the nucleocapsid.
- It provides structural rigidity and links the envelope to the nucleocapsid.
- Also plays a role in viral assembly and budding.
6. Viral Enzymes (carried inside some virions)
| Enzyme | Virus | Function |
|---|---|---|
| RNA-dependent RNA polymerase | Orthomyxovirus, Rhabdovirus (negative-sense RNA viruses) | Transcribes genomic RNA into mRNA |
| Reverse transcriptase | Retroviruses (HIV) | Makes a DNA copy of the RNA genome |
| Multiple enzymes (transcriptional system) | Poxvirus | Complete transcription apparatus is packaged |
Summary Diagram (Conceptual)
NAKED (Non-enveloped) VIRUS          ENVELOPED VIRUS
┌──────────────────────────┐         ┌──────────────────────────────┐
│   CAPSID (capsomeres)    │         │  Lipid Envelope              │
│  ┌────────────────────┐  │         │  with Glycoprotein Spikes    │
│  │   NUCLEIC ACID     │  │         │  ┌──────────────────────┐    │
│  │  (DNA or RNA)      │  │         │  │  Matrix Protein      │    │
│  └────────────────────┘  │         │  │  ┌────────────────┐  │    │
└──────────────────────────┘         │  │  │  NUCLEOCAPSID  │  │    │
Examples: Adenovirus,                │  │  │ (Capsid + NA)  │  │    │
Poliovirus, Rotavirus                │  │  └────────────────┘  │    │
                                     │  └──────────────────────┘    │
                                     └──────────────────────────────┘
                                     Examples: Influenza, HIV, Herpes
Size of Viruses
- Parvovirus (smallest DNA virus): ~20 nm
- Poxvirus (largest): ~300 nm
- HIV: ~120 nm
- SARS-CoV-2: ~100 nm
classify virus
Baltimore classification virus DNA RNA groups chart
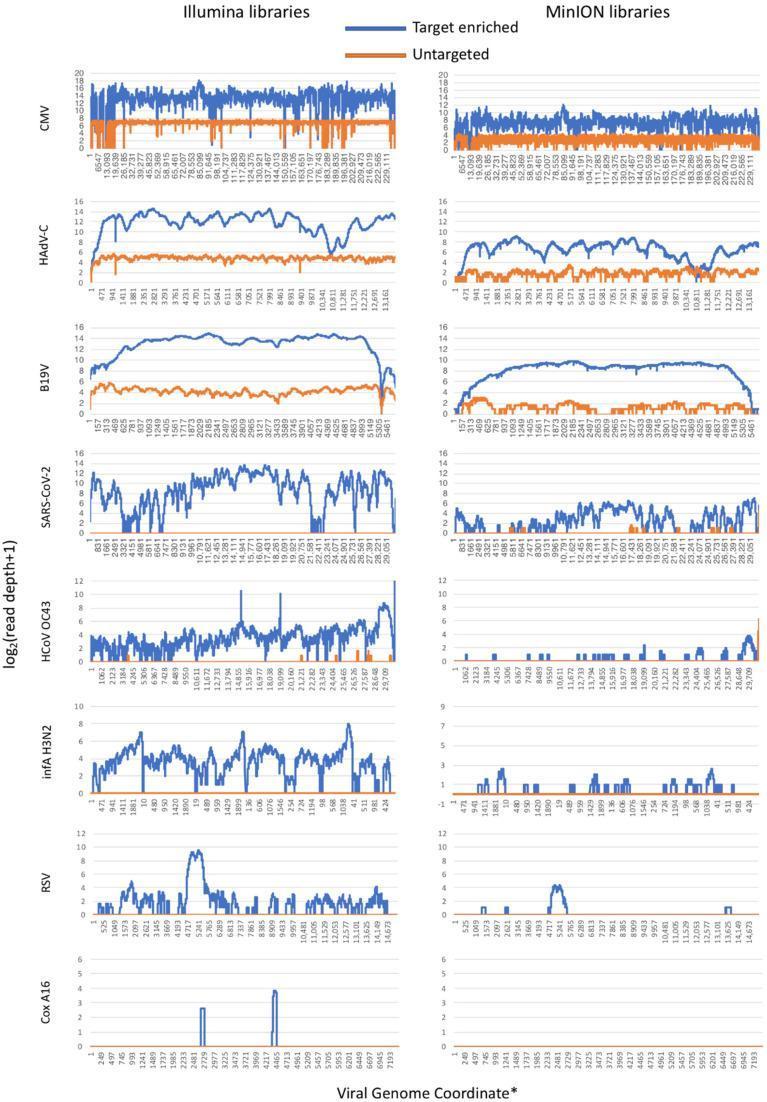
This Comparison Chart illustrates the read depth across various viral genomes, comparing Illumina and MinION sequencing libraries. The visualization consists of multiple horizontal line plots arranged by virus type: Cytomegalovirus (CMV), Human Adenovirus C (HAdV-C), B19 virus (B19V), SARS-CoV-2, Human Coronavirus OC43 (HCoV-OC43), Influenza A (infA H3N2), Respiratory Syncytial Virus (RSV), and Coxsackievirus A16 (Cox A16). For each virus, the x-axis represents the viral genome coordinate, and the y-axis shows the log2(read depth+1). Two libraries are depicted: target-enriched (blue) and untargeted (orange). The left column displays results from Illumina libraries, while the right column shows MinION libraries. The graphs demonstrate that target-enriched libraries consistently achieve higher and more uniform genome coverage compared to untargeted libraries across both platforms. Notably, DNA viruses like CMV and B19V show high coverage, while some RNA viruses like Cox A16 show minimal enrichment. This data is relevant for evaluating metagenomic diagnostic methods and the efficacy of viral sequence capture platforms in clinical genomics.
![This pathophysiology diagram and genomic profile distribution chart illustrate the small RNA interference response to Cucumber Green Mottle Mosaic Virus (CGMMV). The top panel provides a genomic schematic identifying the RNA-dependent RNA polymerase (RdRp), movement protein (MP), and coat protein (CP) regions across 6422 nucleotides. Panels A, B, and C present profile distributions of virus-derived small interfering RNAs (vsiRNAs) for three experimental groups: (A) Mock-treated [CGMMV], (B) dsRNA-treated [dsRNA+CGMMV], and (C) Non-inoculated [dsRNA]. The y-axis represents vsiRNA abundance, with peaks above the x-axis indicating sense orientation (blue) and peaks below indicating antisense orientation (red). A highlighted grey shadowed area indicates the specific genomic target of the applied dsRNA within the CP region. The data demonstrates how therapeutic dsRNA treatment (Panel B) alters the accumulation and distribution of vsiRNAs compared to the high-viral load control (Panel A), and the baseline processing of exogenous dsRNA in uninfected plants (Panel C). This visual helps explain mechanisms of plant immune responses and RNAi-mediated antiviral strategies relevant to comparative pathology and biotechnology.](https://cdn.orris.care/cdss_images/pmc_clinical_VQA_566aa1dcbd0375ffa07731f83a60306998267c364747d8ca57507989ca0b231f.jpg)
This pathophysiology diagram and genomic profile distribution chart illustrate the small RNA interference response to Cucumber Green Mottle Mosaic Virus (CGMMV). The top panel provides a genomic schematic identifying the RNA-dependent RNA polymerase (RdRp), movement protein (MP), and coat protein (CP) regions across 6422 nucleotides. Panels A, B, and C present profile distributions of virus-derived small interfering RNAs (vsiRNAs) for three experimental groups: (A) Mock-treated [CGMMV], (B) dsRNA-treated [dsRNA+CGMMV], and (C) Non-inoculated [dsRNA]. The y-axis represents vsiRNA abundance, with peaks above the x-axis indicating sense orientation (blue) and peaks below indicating antisense orientation (red). A highlighted grey shadowed area indicates the specific genomic target of the applied dsRNA within the CP region. The data demonstrates how therapeutic dsRNA treatment (Panel B) alters the accumulation and distribution of vsiRNAs compared to the high-viral load control (Panel A), and the baseline processing of exogenous dsRNA in uninfected plants (Panel C). This visual helps explain mechanisms of plant immune responses and RNAi-mediated antiviral strategies relevant to comparative pathology and biotechnology.
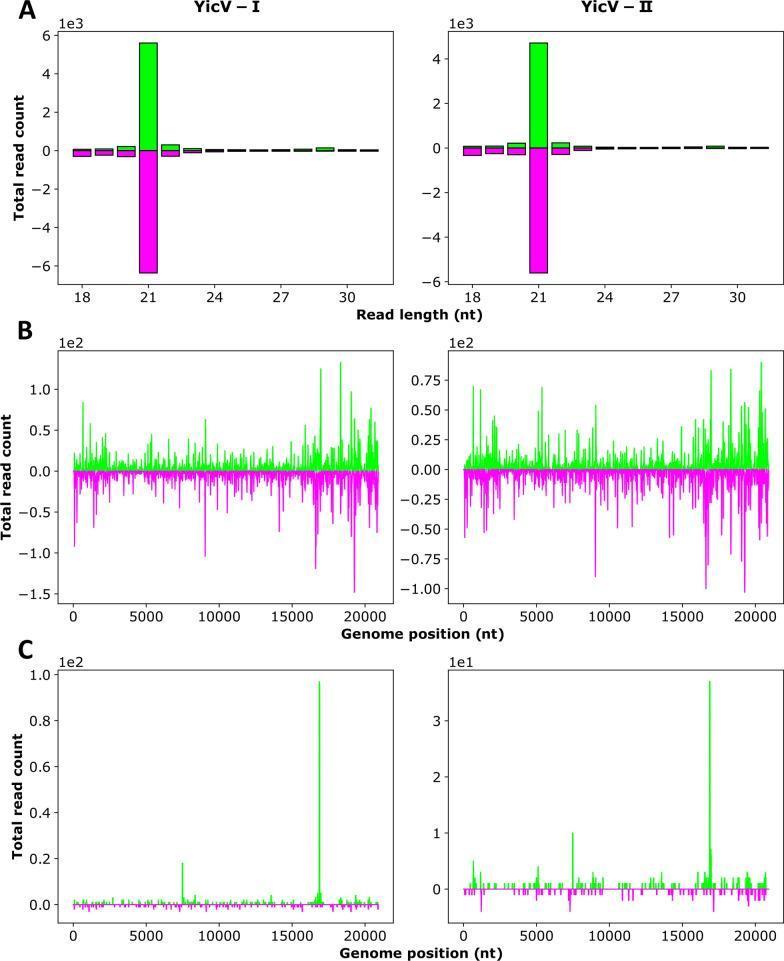
Scientific chart illustrating the production of Yichang virus (YicV)-specific small RNAs (sRNAs) in Aedes aegypti (Aag2) cells acutely infected with a viral mix. The multi-panel figure displays data from two independent experiments (I and II). Panel A shows bar graphs of the absolute frequency of sRNAs by nucleotide (nt) length (18–31 nt), revealing a dominant peak at 21 nt for both sense (green, positive Y-axis) and antisense (purple, negative Y-axis) reads, characteristic of small interfering RNAs (siRNAs). Panels B and C depict the mapping of sRNAs along the YicV genome (approximately 20,000 nt). Panel B focuses on the distribution of 21-nt siRNAs, showing a relatively uniform distribution across the entire genome and antigenome. Panel C illustrates the distribution of 26–30 nt piRNA-sized sRNAs, which show lower read counts and specific peaks compared to the 21-nt class. The data demonstrates that YicV triggers a robust RNA interference response in mosquito cells, primarily characterized by 21-nt siRNA production.
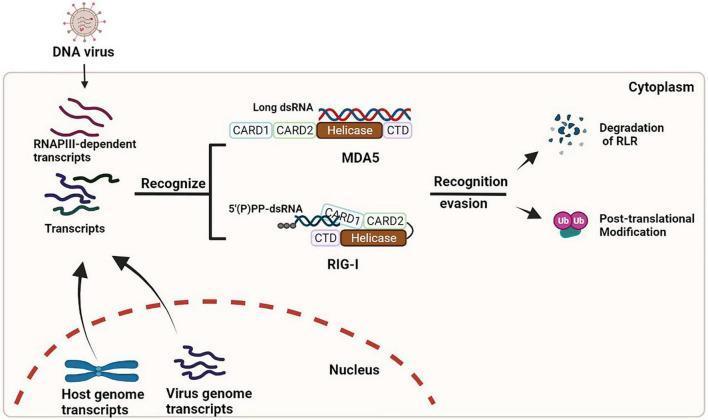
This pathophysiology diagram illustrates the RIG-I-like receptor (RLR) signaling pathway and its evasion by DNA viruses within the human cytoplasm. The left side depicts the 'Recognition' phase, where DNA virus infection leads to the production of RNAPIII-dependent transcripts, host genome transcripts, and virus genome transcripts. These RNAs are recognized by specific RLRs: MDA5, which binds to long double-stranded RNA (dsRNA), and RIG-I, which binds to 5'(P)PP-dsRNA. Both proteins are shown with their characteristic domain architecture, including CARD1, CARD2, Helicase, and C-terminal domains (CTD). The right side of the diagram illustrates 'Recognition evasion' strategies employed by viruses to dampen innate immune responses. Two primary mechanisms are shown: the degradation of RLR proteins into fragmented components and the inhibition via post-translational modifications, specifically ubiquitination (indicated by Ub tags). This infographic serves as an educational summary of how the innate immune system detects viral genetic material and the counter-mechanisms used by pathogens to escape immune surveillance.
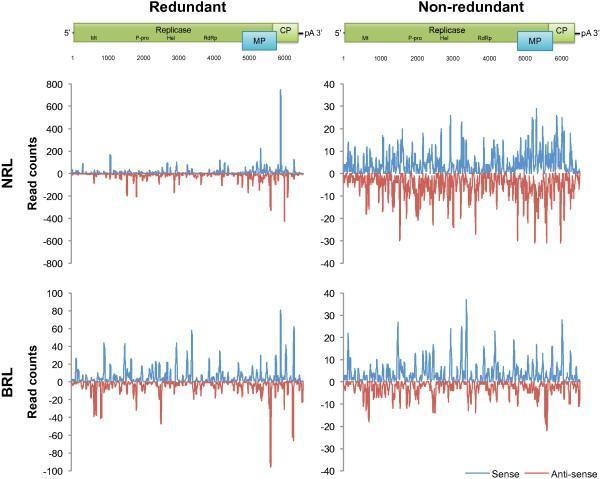
This Comparison Chart illustrates virus-derived small interfering RNA (vsiRNA) profiles for the Apple stem grooving virus (ASGV) genetic variant ASGV-AC, comparing Narrow Range Library (NRL) and Broad Range Library (BRL) datasets. The figure is organized into a 2x2 grid: the top row represents NRL data and the bottom row represents BRL data, while the left and right columns distinguish between redundant and non-redundant reads. Each plot displays read counts on the y-axis against the viral genomic coordinates (1 to ~6500 nt) on the x-axis. A schematic of the ASGV genome is provided above the graphs, indicating functional domains including Methyltransferase (Mt), Replicase (comprising P-pro, Hel, and RdRp), Movement Protein (MP), and Coat Protein (CP). Within the plots, blue peaks represent sense-strand reads (positive) and red peaks represent antisense-strand reads (negative). The redundant read profiles show significantly higher peaks, particularly at the 3' end near the MP and CP genes, while non-redundant profiles show a more uniform distribution. This visual data demonstrates the hotspots of viral RNA cleavage by Dicer-like proteins and the impact of library preparation on small RNA sequencing depth and distribution.
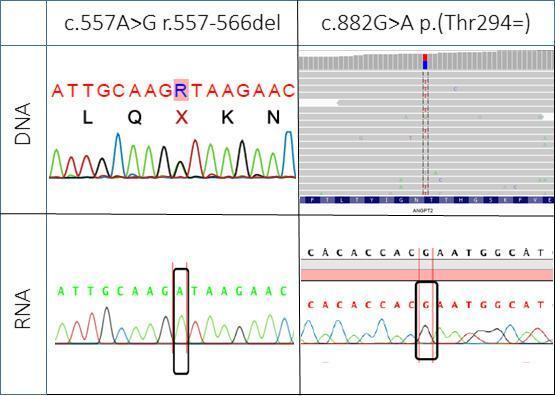
A multi-panel genetic comparison chart illustrating nonsense-mediated mRNA decay (NMD) in the ANGPT2 gene. The image compares DNA sequencing (top row) with RNA sequencing (bottom row) for two specific variants: c.557A>G (a pathogenic splice-site variant) and c.882G>A (a benign marker variant). The DNA column for c.557A>G shows a Sanger sequencing chromatogram with a heterozygous 'R' peak (overlapping A and G signals). In contrast, the corresponding RNA chromatogram shows only a single 'A' peak (wild-type), indicating the mutant transcript is absent. The c.882G>A column displays DNA via a Next-Generation Sequencing (NGS) coverage plot showing heterozygosity (mixed blue/red reads), while the RNA panel utilizes a Sanger chromatogram showing monoallelic expression of the G-allele. Black rectangles highlight the variant sites in the RNA rows to emphasize the loss of the mutant allele. This visual serves as diagnostic evidence of NMD, where premature termination codons lead to the degradation of mutant mRNA transcripts, leaving only the wild-type allele detectable in functional RNA analysis.
Classification of Viruses
I. Basis of Classification
| # | Criterion | Details |
|---|---|---|
| 1 | Virion morphology | Size, shape, capsid symmetry, peplomers (spikes), envelope |
| 2 | Genome properties | DNA or RNA; ss or ds; linear/circular; polarity (+/−); segmented or not; GC content |
| 3 | Genome organization & replication | Gene order, ORF number, transcription strategy, assembly site |
| 4 | Protein properties | Number, size, modifications (glycosylation, phosphorylation), functional activities (reverse transcriptase, neuraminidase) |
| 5 | Antigenic properties | Reactions to antisera |
| 6 | Physicochemical properties | Buoyant density, pH/thermal stability, ether sensitivity |
| 7 | Biologic properties | Host range, mode of transmission, vector, tropism, pathogenicity |
II. ICTV Taxonomic Hierarchy
| Rank | Suffix | Example |
|---|---|---|
| Family | -viridae | Herpesviridae |
| Subfamily | -virinae | Herpesvirinae |
| Genus | -virus | Simplexvirus |
| Species | (common name) | Herpes simplex virus 1 |
III. Classification by Nucleic Acid Type
A. DNA Viruses
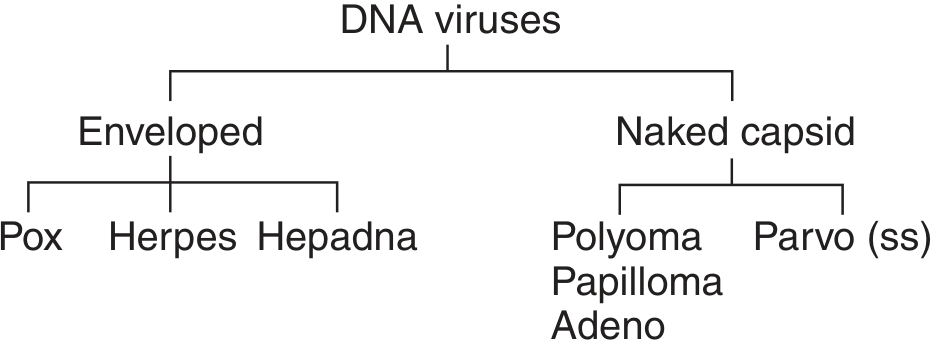
| Family | Envelope | Capsid | Nucleic Acid | Key Members |
|---|---|---|---|---|
| Poxviridae | Enveloped | Complex | dsDNA (130–375 kbp) | Smallpox, Vaccinia, Monkeypox, Molluscum contagiosum |
| Herpesviridae | Enveloped | Icosahedral | dsDNA (125–240 kbp) | HSV-1, HSV-2, VZV, EBV, CMV, HHV-6, HHV-7, HHV-8 |
| Hepadnaviridae | Enveloped | Icosahedral | Partial dsDNA/circular (3.2 kbp) | Hepatitis B virus (HBV) |
| Adenoviridae | Naked | Icosahedral | dsDNA (26–45 kbp) | Adenovirus (pharyngitis, conjunctivitis, pneumonia) |
| Papillomaviridae | Naked | Icosahedral | dsDNA circular (7–8 kbp) | HPV (warts, cervical cancer) |
| Polyomaviridae | Naked | Icosahedral | dsDNA circular (5 kbp) | JC virus, BK virus |
| Parvoviridae | Naked | Icosahedral | ssDNA linear (4–6 kb) | Parvovirus B19 (fifth disease) |
B. RNA Viruses
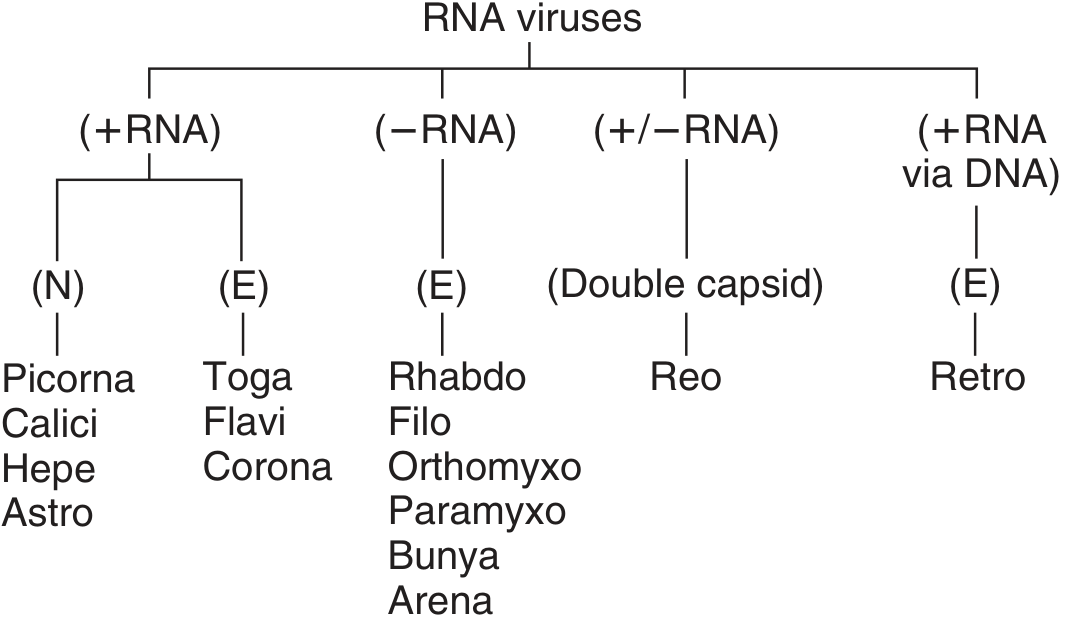
Positive-sense ssRNA (+RNA) - Naked
| Family | Size | Key Members |
|---|---|---|
| Picornaviridae | 22–30 nm | Poliovirus, Coxsackievirus, Echovirus, HAV, Rhinovirus |
| Caliciviridae | 27–38 nm | Norovirus, Sapovirus |
| Hepeviridae | 27–34 nm | Hepatitis E virus (HEV) |
| Astroviridae | 28–38 nm | Human astrovirus |
Positive-sense ssRNA (+RNA) - Enveloped
| Family | Size | Key Members |
|---|---|---|
| Flaviviridae | 40–50 nm | Dengue, Yellow fever, Zika, West Nile, HCV |
| Togaviridae | 70 nm | Rubella, Chikungunya, Western/Eastern equine encephalitis |
| Coronaviridae | 80–220 nm | SARS-CoV-1, SARS-CoV-2 (COVID-19), MERS-CoV, common cold coronaviruses |
Negative-sense ssRNA (−RNA) - Enveloped
| Family | Key Members |
|---|---|
| Rhabdoviridae | Rabies virus |
| Filoviridae | Ebola, Marburg |
| Orthomyxoviridae | Influenza A, B, C (segmented - 8 segments) |
| Paramyxoviridae | Measles, Mumps, RSV, Parainfluenza, Nipah |
| Bunyaviridae | Hantavirus, Rift Valley fever |
| Arenaviridae | Lassa fever, Lymphocytic choriomeningitis |
Double-stranded RNA (dsRNA) - Naked, double capsid
| Family | Key Members |
|---|---|
| Reoviridae | Rotavirus (leading cause of infantile gastroenteritis), Reovirus |
Special: +RNA via DNA intermediate - Enveloped
| Family | Key Members |
|---|---|
| Retroviridae | HIV-1, HIV-2, HTLV-1, HTLV-2 (use reverse transcriptase) |
IV. Baltimore Classification System (1971)
| Group | Genome | Strategy | Examples |
|---|---|---|---|
| I | dsDNA | dsDNA → mRNA | Adenovirus, Herpesvirus, Poxvirus |
| II | ssDNA | ssDNA → dsDNA → mRNA | Parvovirus |
| III | dsRNA | dsRNA → mRNA | Reovirus, Rotavirus |
| IV | +ssRNA | Genome IS mRNA | Picornavirus, Flavivirus, Coronavirus |
| V | −ssRNA | −RNA transcribed → mRNA | Influenza, Rabies, Measles |
| VI | +ssRNA (via DNA) | RNA → DNA (RT) → mRNA | HIV (Retroviruses) |
| VII | dsDNA (via RNA) | DNA → RNA → DNA → mRNA | Hepatitis B (Hepadnavirus) |
V. Other Classification Schemes
| Basis | Examples |
|---|---|
| By host | Animal viruses, plant viruses, bacteriophages (phages) |
| By tissue tropism | Neurotropic (rabies, HSV), hepatotropic (HBV, HCV), pneumotropic (influenza), enterotropic (rotavirus) |
| By transmission | Arboviruses (arthropod-borne: dengue, yellow fever), respiratory (influenza), fecal-oral (poliovirus), sexually transmitted (HIV, HPV) |
| By disease | Encephalitis viruses, hepatitis viruses, hemorrhagic fever viruses |
| By capsid symmetry | Icosahedral, helical, complex |