
Epsp graph
Reading File
Finding Sources
Searching Images
EPSP excitatory postsynaptic potential graph trace
Searching the Web
EPSP graph excitatory postsynaptic potential membrane potential vs time
Finding Sources
Reading File
query_images_db
Reading File
Loading Image
EPSP (Excitatory Postsynaptic Potential) Graph
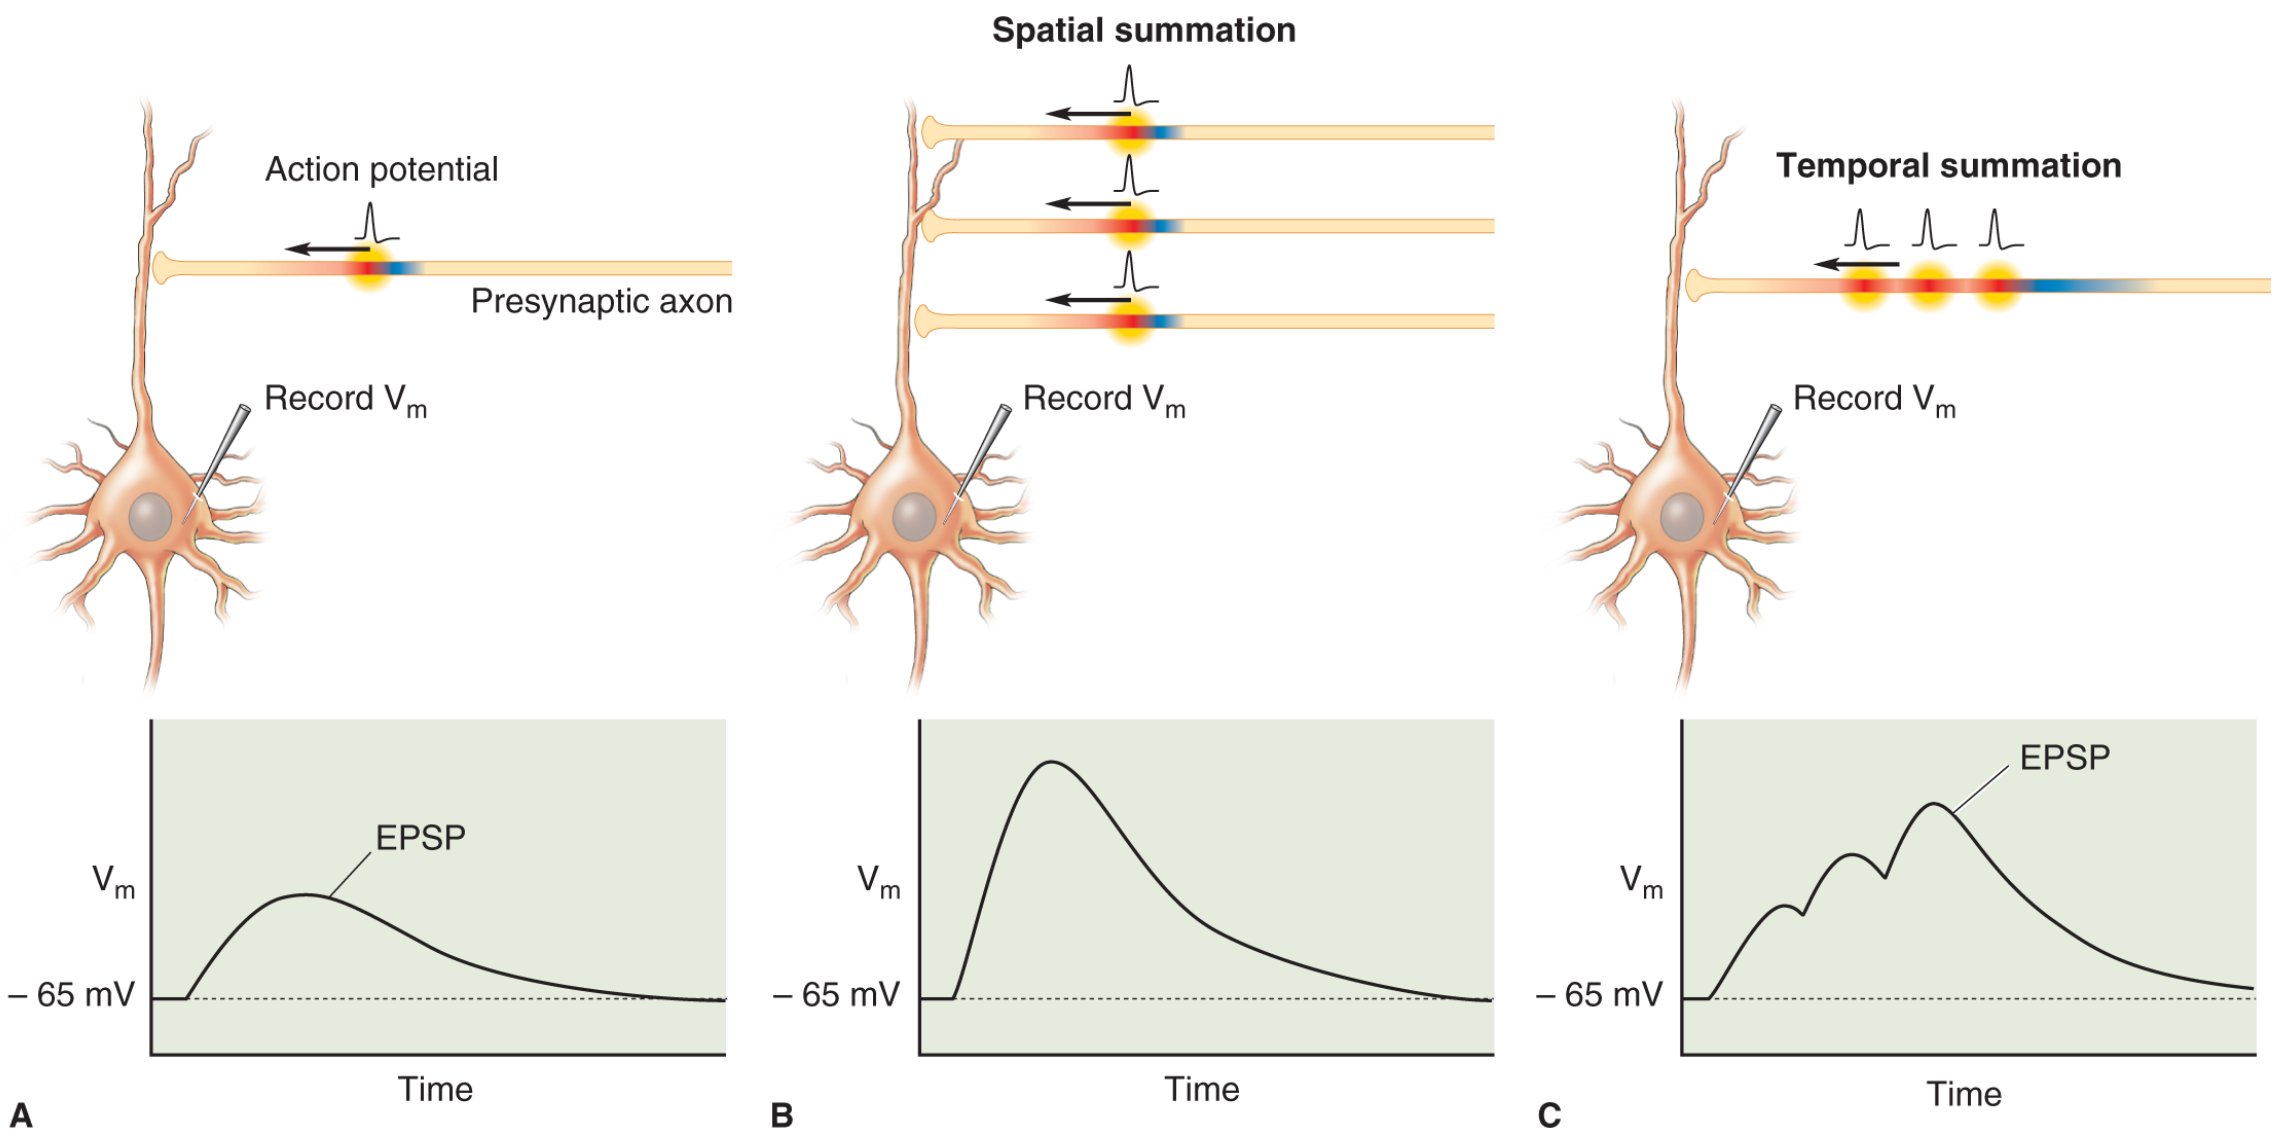
Here is the classic graph used to illustrate an EPSP, showing membrane potential (Vm) plotted against time, from a resting potential of -65 mV:
How to read it
- Y-axis: membrane potential (Vm), starting at rest (around -65 mV, shown as a dashed line).
- X-axis: time.
- Shape: a single EPSP looks like a rounded hump - a rapid rise (depolarization, caused by Na⁺ influx through ligand-gated channels opened by an excitatory neurotransmitter) followed by a slower exponential decay back to resting potential as the channels close and the membrane's leak conductance restores baseline. It never overshoots into a spike by itself; it's a graded, decremental potential, unlike an all-or-none action potential.
The three panels shown above
- Panel A - single EPSP: One presynaptic action potential arrives, releases neurotransmitter, and produces one modest EPSP hump that rises and decays back to baseline.
- Panel B - spatial summation: Several synapses on the dendrite are activated simultaneously (different presynaptic axons firing at the same time). Their individual EPSPs add together, producing a taller combined peak than any single EPSP alone.
- Panel C - temporal summation: A single synapse fires repeatedly in rapid succession (within about 15 ms, before the prior EPSP has fully decayed). Each new EPSP "piles on top" of the previous one's still-decaying tail, producing a staircase-like climb toward threshold.
Both summation mechanisms are how a neuron integrates weak, subthreshold inputs into a depolarization large enough to cross threshold at the axon hillock and fire an action potential - Neuroscience: Exploring the Brain, 5th ed., Fig. 5.23, p. 439-440.
EPSP vs IPSP and real ganglionic recording
In a real neuron, EPSPs (depolarizing, Na⁺-driven) and IPSPs (hyperpolarizing, typically Cl⁻ or K⁺-driven) can occur in sequence. A well-known physiology figure records this from an autonomic ganglion cell: two EPSPs occur after ACh release (the first subthreshold, the second suprathreshold and triggering a spike), followed by a slower IPSP, then a slower muscarinic EPSP, and even a slower peptide-mediated EPSP - illustrating how a single postsynaptic cell integrates multiple, overlapping graded potentials of different time courses - Ganong's Review of Medical Physiology, 26th ed., Fig. 13-4, p. 269.
If you meant something different by "EPSP graph" - for example, a field EPSP (fEPSP) slope-vs-time plot used in long-term potentiation (LTP) experiments, or you want it for a specific exam/course context - let me know and I can pull that specific version.
This is a shared conversation. Sign in to Orris to start your own chat.