
Describe what anatomical structures the doctor interpreting Xray will be looking at when assessing hip X-rays with OA
hip X-ray osteoarthritis radiological features anatomical structures assessment
https://radiopaedia.org/articles/osteoarthritis-of-the-hip?l…
Anatomical Structures Assessed on Hip X-ray for Osteoarthritis
Views Obtained
- AP pelvis (weight-bearing, feet internally rotated 15-20°) - this is the standard
- Cross-table lateral or frog-leg lateral view - for the femoral head and neck profile
The 4 Classic Radiographic Features (LOSS mnemonic)
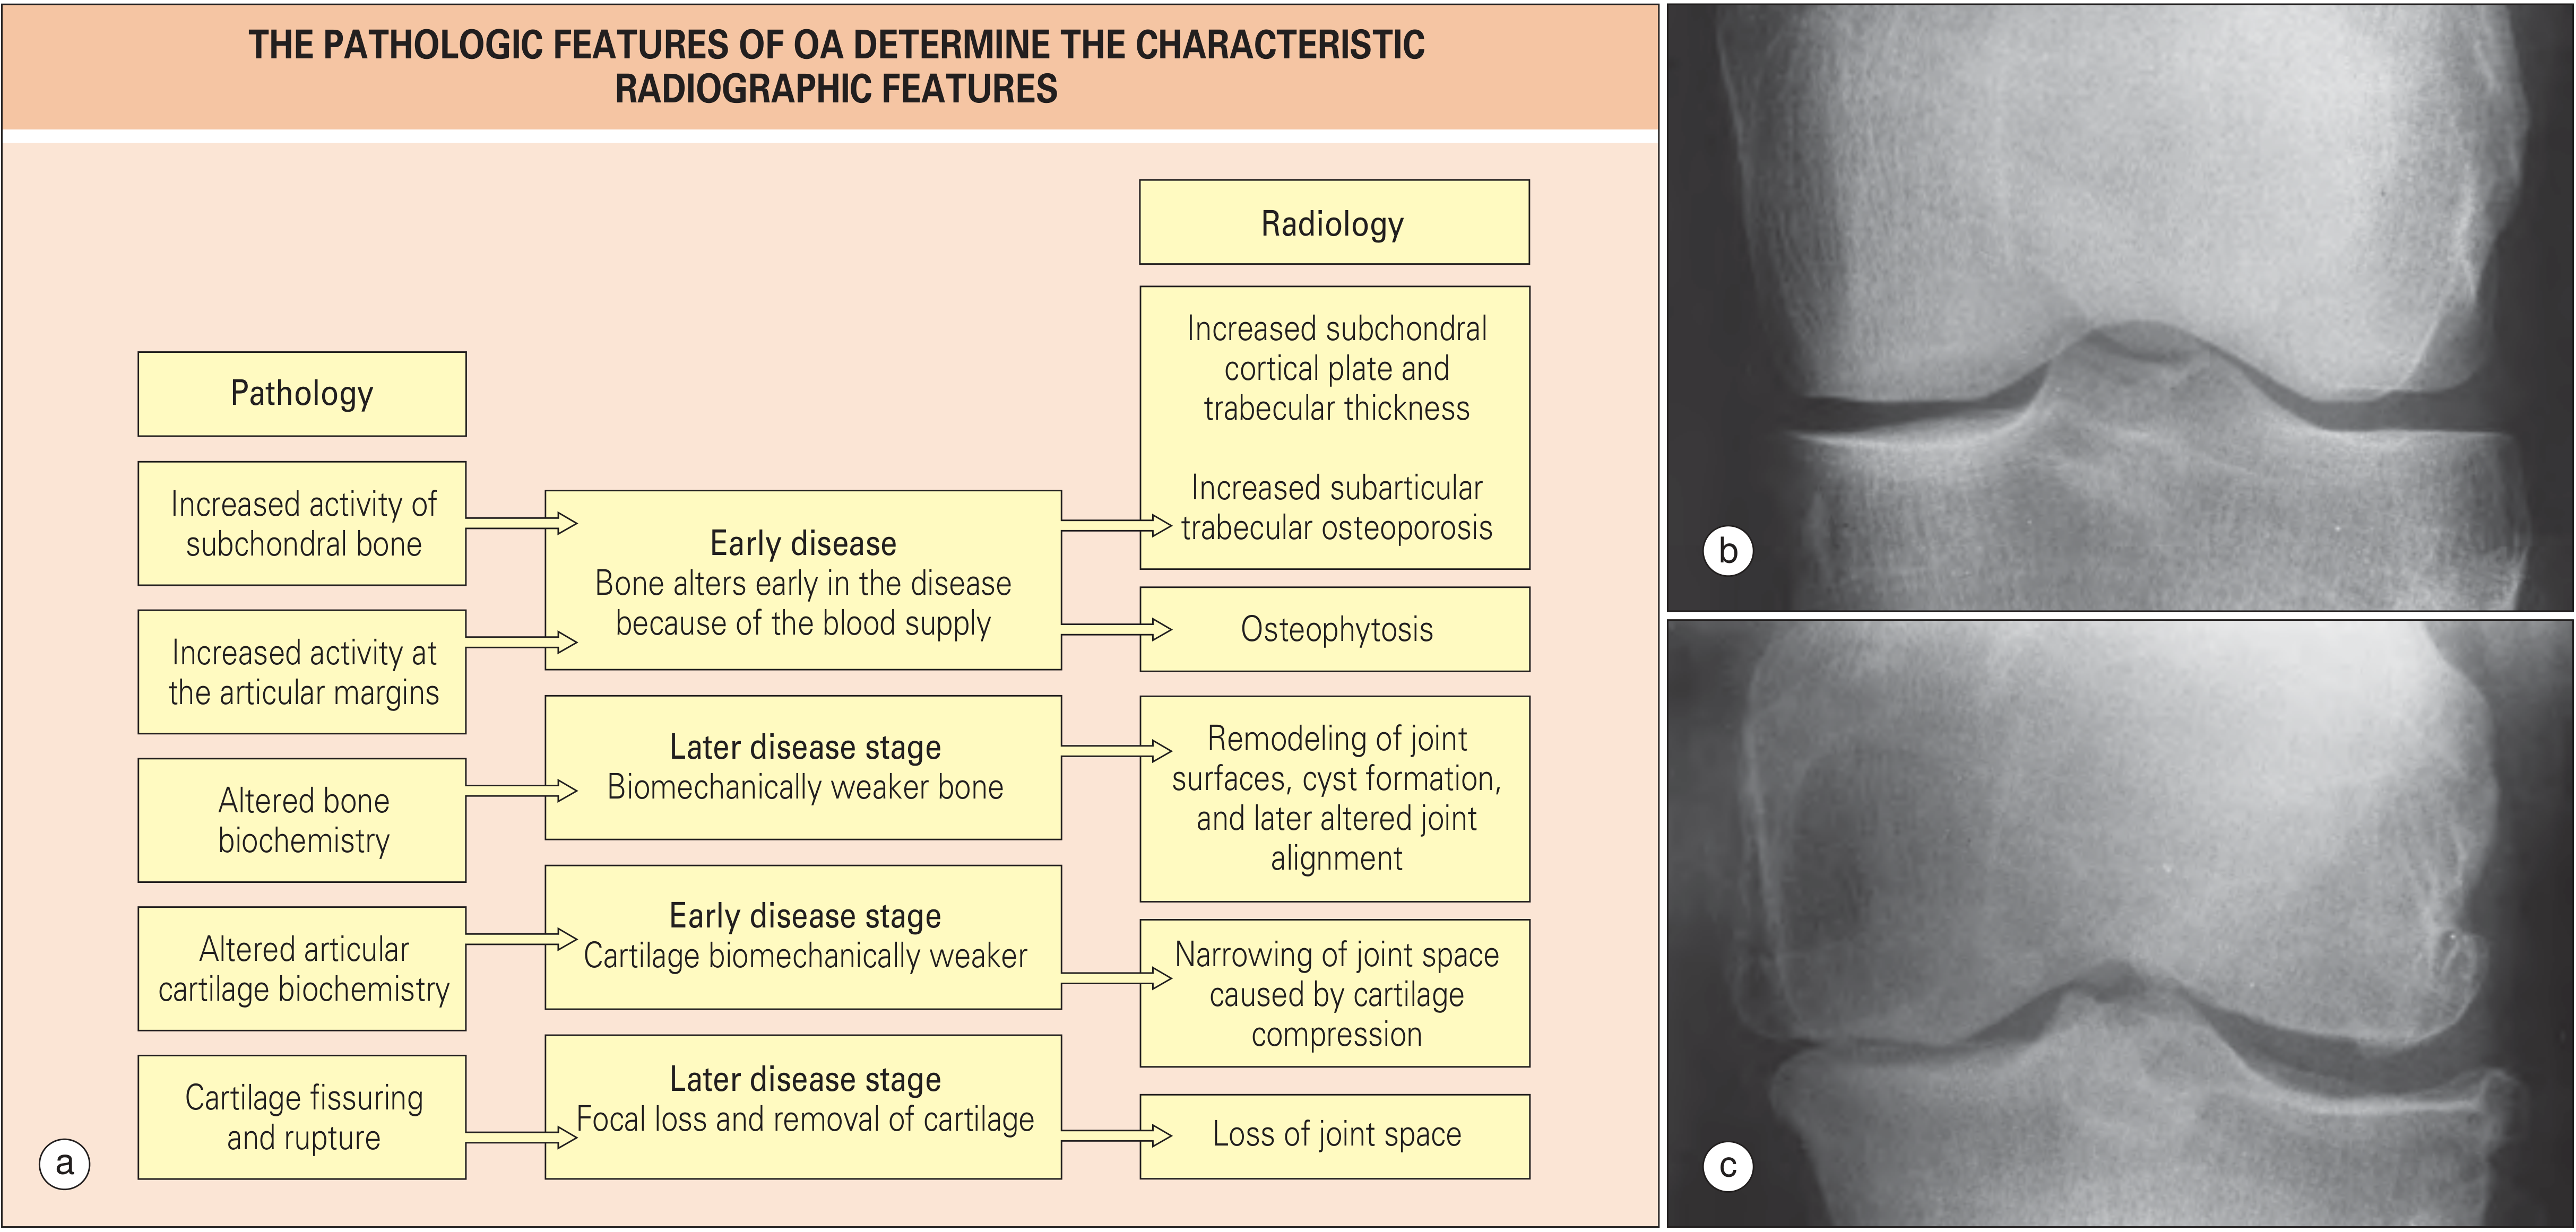
1. Joint Space (Articular Cartilage Proxy)
- The doctor measures the minimum joint space width (mJSW) between the femoral head and the acetabular sourcil (the weight-bearing subchondral arc of the acetabulum, typically the superolateral roof)
- A joint space width ≤2 mm (or <2.5 mm) combined with osteophytes is indicative of OA
- Pattern of narrowing is diagnostically important:
- Superolateral narrowing - most common in primary hip OA; the femoral head migrates superolaterally
- Superomedial (axial/concentric) narrowing - associated with inflammatory arthropathy (e.g., SpA, RA) but also seen in hypertrophic primary OA
- Medial migration - less common, seen in some cases of inflammatory arthritis
2. Subchondral Bone
- Subchondral sclerosis - increased whiteness/density of the subchondral bone plate due to trabecular thickening and new bone formation in response to increased mechanical load; seen in both femoral head and acetabular roof
- Subchondral cysts (geodes) - radiolucent cavities within the subchondral bone, formed by intrusion of synovial fluid through cartilage defects; typically seen in the femoral head and/or acetabulum in advanced OA
- Subchondral cortical plate irregularity - surface corrugations, pitting, or flattening
3. Articular Margins - Osteophytes
- Femoral head margin osteophytes - at the medial, lateral, and inferior margins of the femoral head; the inferior osteophyte ("teardrop" or "buttressing" osteophyte) is especially characteristic
- Acetabular margin osteophytes - around the rim of the acetabulum, particularly superolaterally
- Femoral neck osteophytes - at the junction of the femoral head and neck
4. Femoral Head Shape and Alignment
- Femoral head deformity - flattening, loss of normal sphericity (coxa plana), or mushrooming in advanced OA
- Femoral head migration - direction and degree of migration relative to the acetabulum (superolateral is most common in primary OA)
- Femoral head-neck junction - checked for cam morphology (non-spherical head-neck junction causing femoroacetabular impingement as a secondary OA cause)
5. Acetabulum
- Acetabular depth and coverage - shallow acetabulum (dysplasia) predisposes to secondary OA; assessed by the center-edge angle (normally >25°)
- Acetabular retroversion - assessed on AP view by the "crossover sign" (a cause of pincer-type femoroacetabular impingement)
- Acetabular sourcil - the weight-bearing horizontal subchondral line; its integrity, sclerosis, and any deformity are noted
- Acetabular cysts - in the roof or medial wall
6. Periarticular Structures
- Femoral neck - assessed for Shenton's line continuity (disruption indicates superior migration); also assessed for neck-shaft angle (coxa vara or coxa valga which can predispose to OA)
- Greater and lesser trochanters - may show enthesophytes
- Soft tissues - checked for joint effusion (capsular distension), calcification (chondrocalcinosis, which can coexist with OA), and loose bodies (free osteochondral fragments)
Classification Systems Used During Reporting
| System | What it grades |
|---|---|
| Kellgren-Lawrence (KL) grade 0-4 | JSN, osteophytes, sclerosis, deformity combined |
| Tönnis classification 0-3 | Severity from normal to severe destruction |
| Croft score | Joint space, osteophytes, sclerosis, cysts |
Hypertrophic vs. Atrophic OA - an important distinction
- Hypertrophic OA - prominent osteophytosis with concentric joint space narrowing and subchondral sclerosis (robust bony reaction)
- Atrophic/destructive OA - rapid destruction of subchondral bone with relative paucity of osteophytes; may suggest rapidly destructive hip OA or inflammatory cause
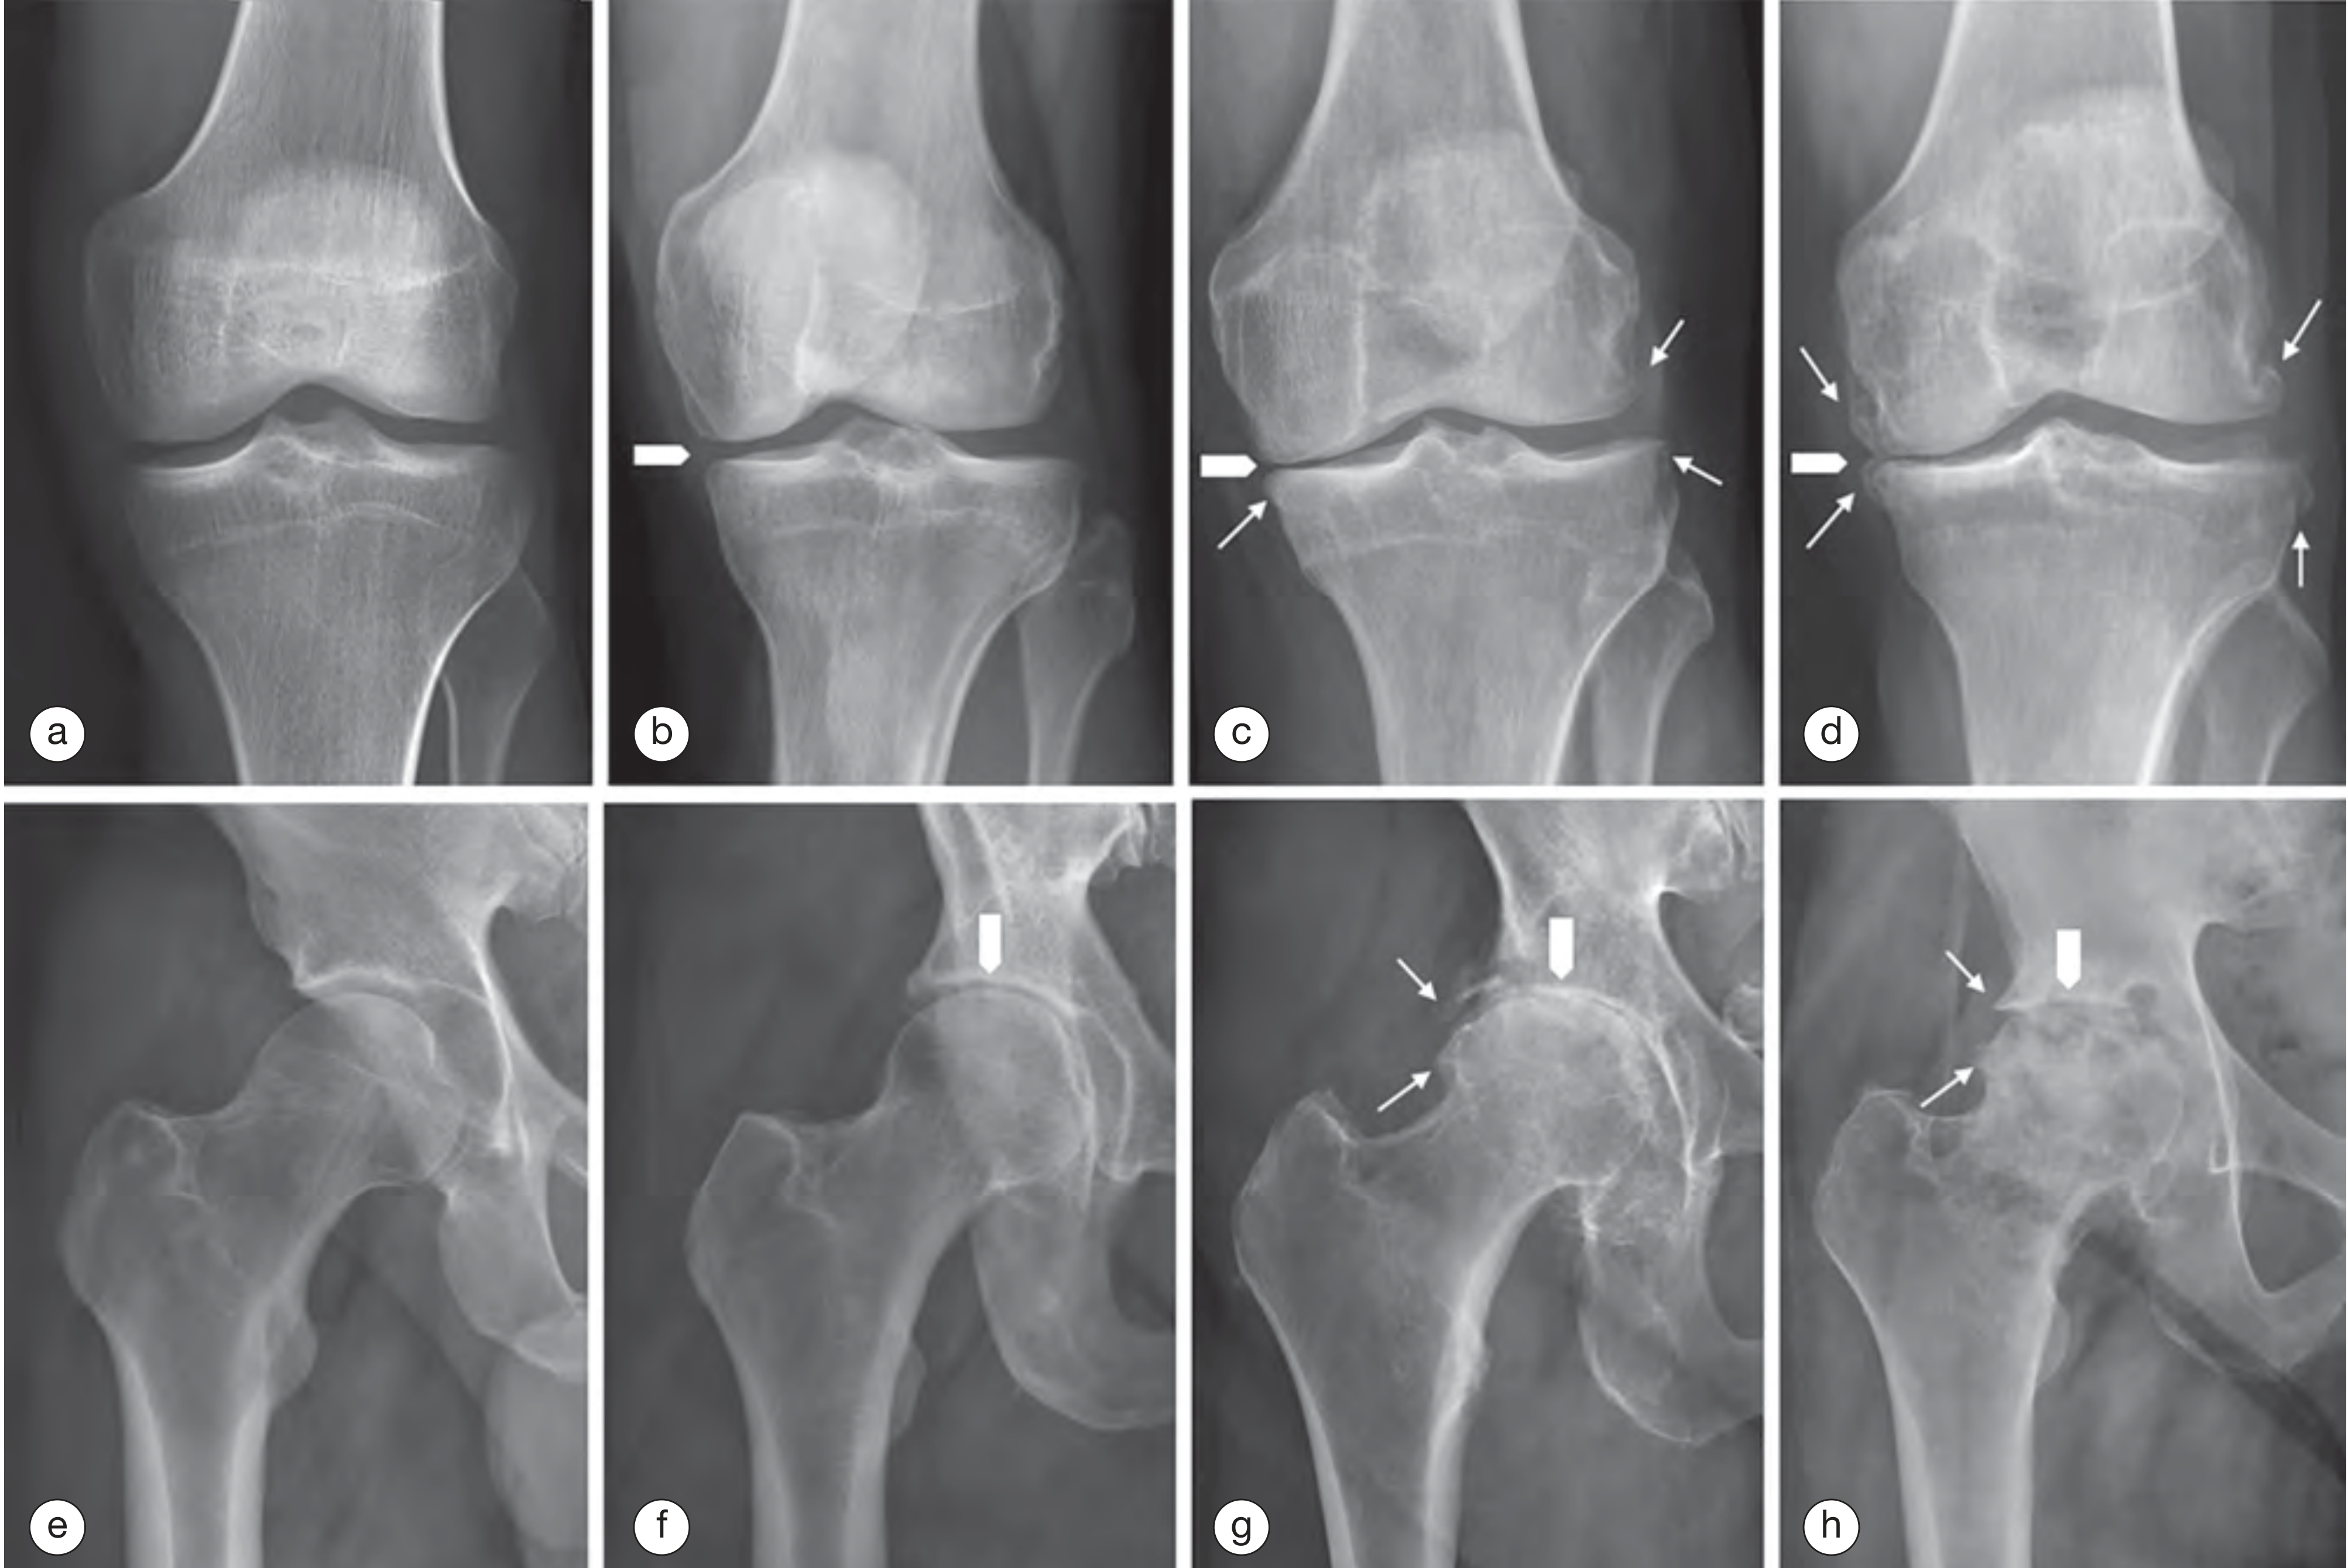
Summary Table
| Structure | What the doctor looks for |
|---|---|
| Joint space (femoral head - acetabular sourcil gap) | Width, pattern of narrowing (superolateral, concentric, medial) |
| Subchondral bone (femoral head and acetabulum) | Sclerosis, cysts (geodes), cortical irregularity |
| Articular margins | Osteophytes - size, number, location (femoral head, acetabular rim, femoral neck) |
| Femoral head | Shape (sphericity, flattening), migration direction, cam deformity |
| Acetabulum | Depth, coverage (CE angle), retroversion, sourcil integrity |
| Femoral neck | Neck-shaft angle, Shenton's line |
| Periarticular soft tissues | Effusion, calcification, loose bodies |
- Rheumatology 2-Volume Set (Elsevier 2022), Figs. 185.2, 187.6, 187.7
- Radiopaedia: Osteoarthritis of the hip
- Radiology Masterclass: Imaging of OA
Outline the typical radiographic changes of degenerative arthritis and correlate this with the imaging of the right
Which joint or region are you referring to? 'Correlate with the imaging of the right...'

this image
Radiographic Changes of Degenerative Arthritis - Correlated with the Right Hip
Standard Radiographic Features of OA (Degenerative Arthritis)
| Feature | Pathological Basis |
|---|---|
| L - Joint space Loss (narrowing) | Articular cartilage thinning and focal loss |
| O - Osteophytes | Marginal new bone formation at the articular rim |
| S - Subchondral Sclerosis | Increased trabecular density beneath denuded cartilage |
| S - Subchondral cySts (geodes) | Synovial fluid forced through cartilage defects into bone |
Correlation with the Right Hip on This X-ray
1. Joint Space Narrowing
- Typical feature: The joint space (representing combined articular cartilage thickness of femoral head + acetabulum) should be ≥3 mm; ≤2 mm is diagnostic of OA. Primary hip OA most commonly produces superolateral narrowing.
- This image (right hip): There is severe, near-complete loss of the superolateral joint space - the femoral head and the acetabular sourcil are almost in contact. This represents advanced, near end-stage cartilage loss. The left hip, by comparison, retains reasonable joint space, showing only mild narrowing.
2. Osteophytes
- Typical feature: Bone spurs form at the margins of the articular surface - at the lateral and inferior femoral head margins, the acetabular rim, and the femoral neck.
- This image (right hip): Prominent osteophyte formation is visible at the lateral acetabular margin and at the femoral head-neck junction, with characteristic marginal "lipping." This represents active periosteal new bone formation in response to joint stress. The left hip shows only minimal osteophyte formation.
3. Subchondral Sclerosis
- Typical feature: The subchondral bone plate increases in density (appears whiter on X-ray) due to trabecular thickening and remodeling in response to abnormal load distribution through denuded cartilage.
- This image (right hip): Marked subchondral sclerosis is present along the weight-bearing surface of the acetabular roof (sourcil) and the opposing superior femoral head - seen as dense, bright white bone in these regions. This is a hallmark of hypertrophic OA pattern.
4. Subchondral Cysts (Geodes)
- Typical feature: Well-defined, rounded radiolucent (dark) areas within the subchondral bone. They form when synovial fluid is forced under pressure through cartilage defects into the bone, or from focal bone necrosis.
- This image (right hip): Multiple well-defined subchondral cysts are visible within the superior femoral head and the adjacent acetabulum - appearing as rounded lucencies within the sclerotic bone. This is a sign of established, advanced OA.
5. Femoral Head Deformity and Migration
- Typical feature: In advanced OA, the femoral head loses its normal spherical shape; it may flatten, develop an irregular contour, or migrate superolaterally out of the acetabulum.
- This image (right hip): The femoral head shows mild flattening and surface irregularity due to remodeling and bone collapse, though it remains largely seated within the acetabulum. No frank superior migration (yet), but the loss of joint space indicates impending contact.
Kellgren-Lawrence Grading - Right Hip
| Grade | Criteria |
|---|---|
| 0 | Normal |
| 1 | Doubtful JSN, possible osteophytes |
| 2 | Definite osteophytes, possible JSN |
| 3 | Moderate multiple osteophytes, definite JSN, mild sclerosis |
| 4 | Large osteophytes, severe JSN, marked sclerosis, bony deformity |
Other Findings on This Film
- Lumbar spine: Severe degenerative disc disease at L4-L5 and L5-S1 with disc space narrowing, large bridging osteophytes, and facet joint arthropathy. Mild degenerative scoliosis is present - this is common as patients compensate for hip pain by shifting weight.
- Sacroiliac joints: Mild bilateral degenerative sclerosis; no fusion or erosion to suggest inflammatory arthritis.
- Pubic symphysis: Mild degenerative sclerosis.
- Calcified densities in the pelvis: Pelvic phleboliths (benign); note also a lobulated calcified density in the right lower quadrant/pelvic region that should be correlated clinically (possible calcified lymph node or ureteric calculus).
- Generalised bone density: Mildly reduced overall, consistent with age-related osteopenia.
Summary

Outline the typical radiographic changes of degenerative arthritis and correlate this with the imaging of the right
Radiographic Features of Degenerative Arthritis - Correlated with the Right Hip
The Four Classical Features of OA on X-ray (LOSS)
| Feature | Pathological Basis | Radiographic Appearance |
|---|---|---|
| Joint space Loss | Articular cartilage thinning and destruction | Narrowed gap between femoral head and acetabulum |
| Osteophytes | Marginal new bone formation at joint margins | Bone "spurs" or "lipping" at articular edges |
| Subchondral Sclerosis | Trabecular thickening beneath denuded cartilage | Increased whiteness/density at subchondral bone |
| Subchondral cysts (geodes) | Synovial fluid forced through cartilage defects into bone | Rounded radiolucent areas within subchondral bone |
Correlation with the RIGHT Hip on This Film
1. Joint Space Narrowing
- Classic pattern: Primary hip OA characteristically shows superolateral joint space narrowing - the femoral head migrates upward and outward as the superior weight-bearing cartilage is preferentially destroyed. A joint space ≤2 mm is consistent with advanced OA.
- This image: The right hip shows moderate-to-severe superolateral joint space narrowing, with the superior joint space significantly reduced compared to the left side. The femoral head is approaching the acetabular sourcil (the weight-bearing subchondral arc of the roof).
2. Osteophytes
- Classic pattern: Bone spurs form at the periphery of the articular surface - at the lateral and inferior femoral head margin, the acetabular rim, and the femoral neck base. They represent attempted joint stabilisation through periosteal new bone formation.
- This image: Prominent lateral acetabular rim osteophyte and a moderate medial femoral head-neck osteophyte are visible on the right side. These are significantly larger than any osteophyte formation on the left hip, which shows only minimal marginal changes.
3. Subchondral Sclerosis
- Classic pattern: Increased bone density immediately beneath the articular surface results from osteoblastic activity in response to abnormal load concentration through cartilage-depleted regions.
- This image: There is marked, dense subchondral sclerosis along the superior acetabular roof and the corresponding superior femoral head on the right - appearing as a bright, white band at the weight-bearing surfaces. This confirms established, chronic load-related remodelling.
4. Subchondral Cysts
- Classic pattern: Well-defined rounded radiolucencies (geodes) within the subchondral bone, typically seen at the femoral head and acetabulum. They represent areas of focal bone necrosis or fluid intrusion under pressure.
- This image: Multiple small-to-medium subchondral cysts are visible within the superior femoral head and adjacent acetabulum on the right side. No such cysts are identified on the left.
5. Femoral Head Deformity and Migration
- Classic pattern: As OA progresses, the femoral head loses its normal sphericity - it may flatten, develop surface irregularity, or migrate superolaterally.
- This image: The right femoral head shows mild flattening and surface deformity along its superior margin due to advanced remodelling and osteophytosis, with mild superolateral migration within the acetabulum. The left femoral head retains normal spherical shape and is well-centred.
Kellgren-Lawrence Grading
| Grade | Criteria |
|---|---|
| 0 | Normal |
| 1 | Doubtful joint space narrowing, possible osteophytes only |
| 2 | Definite osteophytes, possible joint space narrowing |
| 3 | Moderate multiple osteophytes, definite JSN, some sclerosis, possible deformity |
| 4 | Large osteophytes, marked JSN, severe sclerosis, definite bony deformity |
Asymmetry and Additional Findings
- Marked asymmetry between the hips is typical of primary OA - it frequently develops unilaterally or asymmetrically, unlike inflammatory arthropathies (RA, SpA) which tend to be more symmetric.
- Lumbar spine: Severe degenerative changes at L4-L5 and L5-S1 with disc space narrowing, bridging osteophytes, and endplate sclerosis - consistent with multilevel lumbar spondylosis, a common comorbidity with hip OA.
- Sacroiliac joints: Mild bilateral degenerative sclerosis; no ankylosis or erosions to suggest an inflammatory cause for the hip changes.
- Pelvic phleboliths: Multiple small calcified densities with lucent centres in the lower pelvis - benign incidental finding.
- Right paravertebral region: A well-defined calcified density near L3/L4 - likely a renal calculus or calcified lymph node; warrants clinical correlation.
Summary
What is sarcopenia?
sarcopenia definition diagnosis criteria 2024
Sarcopenia
Definition
Types
| Type | Cause |
|---|---|
| Primary (age-related) | Aging alone, no other identifiable cause |
| Secondary | Disease-related (cancer, heart failure, renal failure, liver cirrhosis), malnutrition-related, or disuse/inactivity-related |
Pathophysiology
- Hormonal decline - reduced testosterone, oestrogen, growth hormone, and IGF-1 (insulin-like growth factor-1). IGF-1 is essential for muscle regeneration and integrity; low IGF-1 levels directly correlate with lower muscle strength and power
- Chronic low-grade inflammation ("inflammaging") - elevated IL-6, TNF-α, and CRP promote muscle catabolism; IL-6 reduces IGF-1 synthesis, creating a dual negative effect on muscle maintenance
- Motor neuron loss - progressive denervation of fast-twitch (Type II) muscle fibres leads to fibre atrophy and loss
- Mitochondrial dysfunction - reduced oxidative capacity and increased reactive oxygen species in ageing muscle
- Reduced satellite cell activity - impaired muscle regeneration capacity
- Nutritional deficiency - inadequate protein intake, vitamin D deficiency, and malabsorption
- Physical inactivity - disuse atrophy from sedentary behaviour or immobility
Diagnostic Criteria (EWGSOP2)
| Stage | Criteria | Diagnostic Label |
|---|---|---|
| Step 1 | Low muscle strength (grip strength <27 kg men, <16 kg women; or chair stand >15 sec for 5 rises) | Probable sarcopenia |
| Step 2 | Step 1 + low muscle mass/quality (DXA, BIA, CT, or MRI) | Confirmed sarcopenia |
| Step 3 | Steps 1+2 + low physical performance (gait speed ≤0.8 m/s, SPPB ≤8, TUG ≥20 sec) | Severe sarcopenia |
- Grip strength (hand dynamometer) - primary strength screening tool
- Chair stand test (5 rises) - lower limb strength proxy
- DXA (DEXA) - gold standard for muscle mass quantification (appendicular lean mass index)
- Bioelectrical impedance analysis (BIA) - practical bedside tool
- Gait speed / SPPB (Short Physical Performance Battery) / Timed Up and Go (TUG) - physical performance
Clinical Consequences
- Falls and fractures - reduced lower limb strength and balance
- Disability and loss of independence - impaired activities of daily living
- Increased surgical risk and poor recovery - a major concern in orthopaedic, cardiac, and transplant surgery
- Metabolic complications - sarcopenia is independently associated with insulin resistance and type 2 diabetes
- Increased mortality - in cancer, heart failure, cirrhosis, and post-operative settings, sarcopenia is an independent predictor of death
- Frailty - sarcopenia is a core component of the frailty syndrome
Relevance to Musculoskeletal/Orthopaedic Practice
Management
| Intervention | Evidence |
|---|---|
| Resistance exercise training | Best evidence - progressive resistance training increases muscle mass and strength |
| Protein supplementation | 1.2-1.5 g/kg/day recommended (higher than standard RDA of 0.8 g/kg/day) |
| Vitamin D supplementation | Particularly if deficient (supports muscle function and fall prevention) |
| Treatment of underlying disease | Addressing heart failure, renal disease, malignancy |
| Pharmacological (emerging) | Testosterone, selective androgen receptor modulators (SARMs), myostatin inhibitors - under investigation |
What strategies can be employed to reduce the risk of developing sarcopenia or slow its progression?
sarcopenia prevention treatment exercise nutrition
sarcopenia prevention strategies 2024 guidelines exercise nutrition
https://www.frontiersin.org/journals/nutrition/articles/10.3…
Strategies to Prevent and Slow Sarcopenia
1. Exercise - The Most Powerful Intervention
Resistance (Strength) Training - First-line
- The single most effective intervention supported by high-quality evidence
- Works by mechanical loading that activates the mTORC1 signalling pathway, stimulating muscle protein synthesis and satellite cell activation
- Prescription: 2-3 sessions per week, 2-4 sets of 8-12 repetitions at 60-80% of 1-rep max, targeting major muscle groups (legs, hips, back, chest, arms)
- Produces measurable gains in muscle mass and strength even in people aged 80-90+
- Progressive overload is essential - resistance must increase as the person gets stronger
Aerobic Exercise - Complementary
- Improves mitochondrial function, reduces chronic inflammation (lowers IL-6), and enhances cardiovascular fitness
- Walking, cycling, swimming: 150+ minutes/week of moderate intensity
- Aerobic exercise alone does not significantly increase muscle mass but improves muscle quality and reduces the inflammatory milieu that accelerates sarcopenia
Multicomponent Training - Optimal for Older Adults
- Combines resistance + aerobic + balance training
- Addresses all domains - strength, endurance, fall prevention, and function
- The EWGSOP2 and international guidelines consistently recommend multicomponent exercise as the preferred approach in clinical practice
2. Nutritional Strategies
Protein Intake - Most Important Nutritional Factor
| Population | Recommended Intake |
|---|---|
| General adults (RDA) | 0.8 g/kg/day |
| Older adults (prevention) | 1.0-1.2 g/kg/day |
| Older adults with sarcopenia | 1.2-1.5 g/kg/day |
| Sarcopenia + acute illness | Up to 2.0 g/kg/day |
- High-quality protein sources rich in essential amino acids (particularly leucine) are most effective - leucine is the primary trigger for mTOR-mediated muscle protein synthesis
- Best sources: whey protein, eggs, lean meat, fish, dairy, legumes
- Protein distribution matters: spreading intake evenly across 3-4 meals (25-40 g/meal) is superior to consuming most protein in one meal
Whey Protein and Leucine Supplementation
- Whey protein has the highest leucine content and fastest absorption rate of all protein sources
- Leucine threshold to trigger muscle protein synthesis: ~2-3 g per meal
- Supplementation with whey + leucine has been shown to improve gait speed and muscle mass in sarcopenic older adults
Beta-Hydroxy Beta-Methylbutyrate (HMB)
- A metabolite of leucine; inhibits muscle protein breakdown and stimulates synthesis
- Studies show HMB (3 g/day) can improve grip strength, ASMI, and gait speed, especially in hospitalised older adults and those with hip fractures
- Particularly useful when exercise is not possible (e.g., post-surgical immobility)
Vitamin D
- Low vitamin D is independently associated with muscle weakness and sarcopenia
- Acts on muscle via the vitamin D receptor (VDR), supporting muscle fibre size (especially Type II fast-twitch fibres) and neuromuscular function
- Target serum 25(OH)D: >50 nmol/L (ideally >75 nmol/L)
- Supplementation: typically 800-2000 IU/day, higher doses if severely deficient
- Combined whey protein + vitamin D supplementation shows additive benefit on gait speed
Omega-3 Fatty Acids
- Anti-inflammatory effects reduce the chronic low-grade inflammation driving sarcopenia
- May enhance muscle protein synthesis by sensitising muscle to anabolic stimuli
- Dose studied: 2-4 g/day EPA+DHA
Creatine Supplementation
- Increases phosphocreatine stores in muscle, supporting high-intensity muscle contractions during resistance training
- Evidence supports modest gains in muscle mass and strength when combined with resistance training in older adults
- Typical dose: 3-5 g/day (maintenance phase)
3. Lifestyle Modifications
Avoid Prolonged Inactivity
- Even short periods of bed rest (5-7 days) can cause significant muscle loss in older adults
- "Use it or lose it" - any increase in physical activity, even walking, is beneficial
- Breaking up prolonged sitting is independently associated with better muscle function
Smoking Cessation
- Smoking promotes oxidative stress and systemic inflammation, both accelerating muscle catabolism
Alcohol Reduction
- Excess alcohol directly impairs muscle protein synthesis and is a direct myotoxin
4. Management of Contributing Medical Conditions
| Condition | Why it matters | Action |
|---|---|---|
| Vitamin D deficiency | Impairs muscle fibre function | Supplement to replete |
| Chronic inflammation (CVD, CKD, cancer) | Elevated IL-6 drives catabolism | Optimise disease management |
| Insulin resistance / T2DM | Impairs anabolic signalling | Glycaemic control |
| Hypogonadism (low testosterone) | Reduces muscle anabolic drive | Consider hormonal assessment |
| Malnutrition / malabsorption | Protein deficit | Dietician-guided nutritional support |
| Depression / cognitive decline | Reduces motivation for activity | Treat and support |
5. Pharmacological Approaches (Emerging - Not Yet Standard)
- Testosterone - increases muscle mass in older hypogonadal men but carries cardiovascular and prostate risks; not routinely recommended for sarcopenia alone
- Selective androgen receptor modulators (SARMs) - under investigation; aim to produce anabolic effects in muscle without androgenic side effects
- Myostatin inhibitors - myostatin is a negative regulator of muscle growth; inhibitors (e.g. bimagrumab) are in clinical trials
- GLP-1 receptor agonists - currently investigated for sarcopenic obesity; concern that they may cause muscle loss alongside fat loss, making concurrent resistance exercise and protein intake essential
Summary: Hierarchy of Evidence-Based Strategies
| Strategy | Evidence Level | Primary Benefit |
|---|---|---|
| Resistance training | High | Muscle mass + strength |
| Combined exercise + protein supplementation | High | All sarcopenia outcomes |
| Adequate protein intake (1.2-1.5 g/kg/day) | High | Muscle protein synthesis |
| Vitamin D optimisation | Moderate | Muscle function, fall prevention |
| Multicomponent exercise | High | Strength + function + fall prevention |
| Aerobic exercise | Moderate | Muscle quality, inflammation |
| HMB supplementation | Moderate | Anti-catabolic (especially when immobile) |
| Omega-3 fatty acids | Moderate | Anti-inflammatory |
| Creatine | Moderate | Synergistic with resistance training |
| Treating underlying disease | Contextual | Reduces secondary catabolism |
how can it be tested
sarcopenia diagnostic tests EWGSOP2 SARC-F grip strength DXA cutoff values 2024
https://www.mdpi.com/2072-6643/16/3/436
How Sarcopenia is Tested
Stage 1: Screening - Find Cases
SARC-F Questionnaire
| Question | Score |
|---|---|
| Strength - How much difficulty do you have lifting/carrying 5 kg? | 0-2 |
| Assistance walking - How much difficulty walking across a room? | 0-2 |
| Rise from a chair - How much difficulty transferring from chair/bed? | 0-2 |
| Climb stairs - How much difficulty climbing 10 steps? | 0-2 |
| Falls - How many times have you fallen in the past year? | 0-2 |
- Sensitivity ~35%, Specificity ~85% against EWGSOP2 criteria - it is a case-finding, not a diagnostic tool
- Quick to administer in any setting (GP, clinic, ward, community)
Stage 2: Confirm Low Muscle Strength (Probable Sarcopenia)
1. Handgrip Strength (Dynamometry)
- The most widely used and validated strength test
- Patient squeezes a handheld dynamometer with maximum effort; best of 2-3 attempts recorded
- EWGSOP2 Cutoffs:
- Men: <27 kg = low strength
- Women: <16 kg = low strength
- Fast, cheap, reproducible, and predicts disability, hospitalisation, and mortality
2. Chair Stand Test (5-Times Sit-to-Stand)
- Patient rises from a standard chair 5 times as fast as possible without using their arms
- Tests lower limb muscle strength and power
- EWGSOP2 Cutoff: >15 seconds for 5 repetitions = low strength
- Practical alternative when grip dynamometer is unavailable; also a good functional proxy
Stage 3: Confirm Low Muscle Mass/Quality (Confirmed Sarcopenia)
1. Dual-Energy X-ray Absorptiometry (DXA) - Gold Standard for Clinical Use
- Measures appendicular lean mass (ALM) - the combined lean mass of both arms and both legs
- Reported as the Appendicular Skeletal Muscle Mass Index (ASMI) = ALM ÷ height² (kg/m²)
- EWGSOP2 Cutoffs:
- Men: <7.0 kg/m²
- Women: <5.5 kg/m²
- Widely available, low radiation, accurate, reproducible
- Also measures bone density simultaneously (useful as hip OA patients are often assessed for osteoporosis)
2. Bioelectrical Impedance Analysis (BIA)
- A small electrical current is passed through the body; impedance differs between lean mass, fat, and water
- Estimates total and segmental muscle mass
- EWGSOP2 Cutoffs (BIA-derived ALM):
- Men: <7.0 kg/m²
- Women: <5.5 kg/m²
- Advantages: portable, cheap, bedside-friendly, no radiation
- Limitations: results affected by hydration status, recent exercise, and body temperature
3. CT / MRI (Specialist/Research Settings)
- CT at the L3 vertebral level is the research gold standard for muscle mass quantification - measures cross-sectional area of skeletal muscle
- MRI provides the most detailed assessment of muscle quantity AND quality (fatty infiltration, fibrosis)
- Not routine due to cost, availability, and radiation (CT)
- Particularly useful in cancer and critical illness where sarcopenia has prognostic value
4. Ultrasound (Emerging)
- Can measure muscle thickness, cross-sectional area, and echo intensity (a marker of fat infiltration/quality)
- Portable and radiation-free; increasingly used in bedside and point-of-care settings
- Not yet in main diagnostic algorithms but gaining evidence
Stage 4: Assess Severity - Physical Performance (Severe Sarcopenia)
1. Gait Speed (4-Metre Walk Test)
- Patient walks 4 metres at usual pace; timed with stopwatch
- EWGSOP2 Cutoff: ≤0.8 m/sec = severe sarcopenia
- Quickest and most practical performance test; predicts falls, disability, institutionalisation, cognitive decline, and mortality
2. Short Physical Performance Battery (SPPB)
- A composite of three tests scored 0-4 each (total 0-12):
- Balance test (standing in tandem, semi-tandem, and side-by-side positions)
- 4-metre gait speed
- 5-times chair stand
- EWGSOP2 Cutoff: ≤8 = severe sarcopenia
- More comprehensive than gait speed alone; commonly used in research
3. Timed Up and Go (TUG)
- Patient rises from a standard chair, walks 3 metres, turns, walks back, sits down
- EWGSOP2 Cutoff: ≥20 seconds = severe sarcopenia
- Integrates strength, balance, and mobility; predicts mortality and fall risk
4. 400-Metre Walk Test
- Patient walks 400 metres as quickly as possible without running
- Cutoff: >6 minutes or unable to complete = poor performance
- Predicts mobility limitation and mortality; requires a corridor >20 metres
Summary Diagnostic Algorithm (EWGSOP2)
SARC-F ≥4 (or clinical suspicion)
↓
Grip strength / Chair stand
├─ Normal → No sarcopenia (reassess if deteriorates)
└─ LOW → PROBABLE SARCOPENIA
↓
DXA / BIA (muscle mass)
├─ Normal → Not confirmed (investigate other causes)
└─ LOW → CONFIRMED SARCOPENIA
↓
Gait speed / SPPB / TUG
├─ Normal → Confirmed Sarcopenia
└─ LOW → SEVERE SARCOPENIA
Cutoff Reference Table
| Test | Men | Women | Stage |
|---|---|---|---|
| SARC-F | ≥4/10 | ≥4/10 | Screening |
| Grip strength | <27 kg | <16 kg | Probable |
| Chair stand (5x) | >15 sec | >15 sec | Probable |
| ASMI (DXA) | <7.0 kg/m² | <5.5 kg/m² | Confirmed |
| ASMI (BIA) | <7.0 kg/m² | <5.5 kg/m² | Confirmed |
| Gait speed | ≤0.8 m/s | ≤0.8 m/s | Severe |
| SPPB | ≤8/12 | ≤8/12 | Severe |
| TUG | ≥20 sec | ≥20 sec | Severe |
if i have to test it on a patient, walk me through the steps and how to allocate points
Step-by-Step Clinical Assessment for Sarcopenia
STEP 1: Screening - SARC-F Questionnaire
| Answer | Score |
|---|---|
| None | 0 |
| Some | 1 |
| A lot / unable | 2 |
| Answer | Score |
|---|---|
| None | 0 |
| Some | 1 |
| A lot / use aids / unable | 2 |
| Answer | Score |
|---|---|
| None | 0 |
| Some | 1 |
| A lot / need help / unable | 2 |
| Answer | Score |
|---|---|
| None | 0 |
| Some | 1 |
| A lot / unable | 2 |
| Answer | Score |
|---|---|
| None | 0 |
| 1-3 falls | 1 |
| 4 or more falls | 2 |
SARC-F Total: add all 5 scores → Maximum = 10
| Total Score | Interpretation |
|---|---|
| 0-3 | Negative screen - sarcopenia unlikely |
| ≥4 | Positive screen → proceed to Step 2 |
STEP 2: Test Muscle Strength (Probable Sarcopenia)
Test A - Handgrip Strength
- Patient sits upright in a chair, elbow bent to 90°, wrist in neutral
- Place the dynamometer in the patient's dominant hand
- Instruct: "Squeeze as hard as you can - squeeze, squeeze, squeeze!"
- Record the result in kg
- Rest 1 minute, repeat twice more
- Use the highest reading of the 3 attempts
| Sex | Low Strength (abnormal) |
|---|---|
| Men | <27 kg |
| Women | <16 kg |
Test B - 5-Times Chair Stand Test
- Patient sits in the middle of the chair, arms folded across their chest (not allowed to use arms)
- Instruct: "Stand up fully, then sit back down. Do this 5 times as fast as you can. I'll start timing when you begin to stand."
- Start the timer when they begin to rise
- Stop the timer when they complete the 5th sit-down
- Record time in seconds
| Result | Interpretation |
|---|---|
| ≤15 seconds | Normal |
| >15 seconds | Low strength → probable sarcopenia |
| Unable to complete | Low strength → probable sarcopenia |
Decision after Step 2:
- Normal grip AND normal chair stand → sarcopenia unlikely; reassess if symptoms develop
- Low grip OR slow chair stand → PROBABLE SARCOPENIA → proceed to Step 3
STEP 3: Measure Muscle Mass (Confirmed Sarcopenia)
DXA Scan (most common in clinical practice)
- Refers to radiology/bone density service
- Measures Appendicular Lean Mass (ALM) = lean mass of both arms + both legs (in kg)
- Calculate: ASMI = ALM ÷ height² (kg/m²)
| Sex | Low Muscle Mass (abnormal) |
|---|---|
| Men | ASMI <7.0 kg/m² |
| Women | ASMI <5.5 kg/m² |
BIA (if DXA not available)
- Use a validated BIA device (e.g. Tanita, InBody)
- Patient fasted, voided bladder, no exercise in prior 12 hours
- Device calculates ALM automatically
- Apply the same ASMI cutoffs above
Decision after Step 3:
- Normal muscle mass → not confirmed; investigate other causes of weakness
- Low muscle mass + low strength → CONFIRMED SARCOPENIA → proceed to Step 4 to grade severity
STEP 4: Assess Physical Performance (Severe Sarcopenia)
Test A - 4-Metre Gait Speed
- Mark a 4-metre straight walkway with tape on the floor
- Allow 2 metres before the start line for the patient to build up normal walking pace
- Instruct: "Walk at your usual comfortable pace. I'll time you over this 4-metre section."
- Start timer when leading foot crosses the start line
- Stop timer when leading foot crosses the end line
- Calculate: speed (m/s) = 4 ÷ time in seconds
- Repeat twice, use the faster result
| Result | Interpretation |
|---|---|
| >0.8 m/s | Normal performance |
| ≤0.8 m/s | Poor performance → severe sarcopenia |
Test B - Short Physical Performance Battery (SPPB)
Sub-test 1: Balance (scored 0-4)
| Position | Score if held 10 sec |
|---|---|
| Side-by-side stand (feet together) | Must pass to continue |
| Semi-tandem stand (one foot half in front) | 1 point |
| Full tandem stand (heel-to-toe) | 2 points |
- Held tandem <3 sec = 0; 3-9.99 sec = 1; 10 sec = 2
- Didn't attempt or held semi-tandem <10 sec = 0 overall
Sub-test 2: 4-Metre Gait Speed (scored 0-4)
| Speed | Score |
|---|---|
| Unable | 0 |
| <0.43 m/s | 1 |
| 0.43-0.60 m/s | 2 |
| 0.61-0.99 m/s | 3 |
| ≥1.00 m/s | 4 |
Sub-test 3: 5-Times Chair Stand (scored 0-4)
| Time | Score |
|---|---|
| Unable | 0 |
| >16.7 sec | 1 |
| 13.7-16.69 sec | 2 |
| 11.2-13.69 sec | 3 |
| <11.2 sec | 4 |
| Total Score | Interpretation |
|---|---|
| 9-12 | Normal |
| ≤8 | Poor performance → severe sarcopenia |
Test C - Timed Up and Go (TUG)
- Patient sits with back against chair, arms resting on thighs (or armrests)
- On "Go" - start timer
- Patient rises, walks 3 metres to a line, turns around, walks back, sits down fully
- Stop timer when they are seated
- Patient may use their usual walking aid if needed
| Result | Interpretation |
|---|---|
| <12 seconds | Normal mobility |
| 12-20 seconds | Borderline / reduced |
| ≥20 seconds | Poor performance → severe sarcopenia |
Final Classification Summary
| Finding | Diagnosis |
|---|---|
| SARC-F ≥4 only | Possible / at-risk - further test |
| Low strength (grip or chair stand) | Probable sarcopenia |
| Low strength + low muscle mass (DXA/BIA) | Confirmed sarcopenia |
| Low strength + low muscle mass + poor performance | Severe sarcopenia |
Quick Reference Card
SARC-F ≥4?
YES → Grip strength / Chair stand
LOW? → Probable sarcopenia
DXA / BIA
LOW ASMI? → Confirmed sarcopenia
Gait speed / SPPB / TUG
LOW? → SEVERE sarcopenia