
Acute chest pain ACS, MI, angina Non-cardiac causes of chest pain ECG basics in chest pain First-hour management reference from 11th edition Tintinalis & Rosen's Emergency Medicine (overview) prepare ppt presentation based on above information
STEMI ECG ST elevation myocardial infarction 12 lead
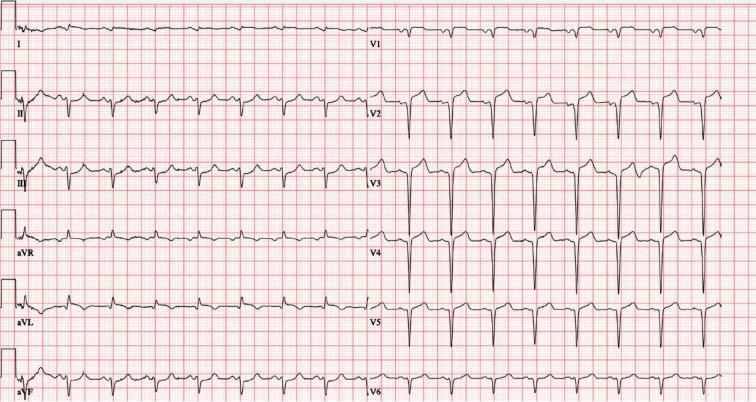
This is a 12-lead electrocardiogram (ECG) demonstrating an acute ST-segment elevation myocardial infarction (STEMI). The diagnostic hallmark is prominent ST-segment elevation across the precordial leads V1 through V6, with the most significant convex elevation appearing in leads V2, V3, and V4. These findings are highly characteristic of an acute anterior wall infarction, typically involving the left anterior descending (LAD) coronary artery. In the limb leads, mild ST-segment elevation is also visible in leads I, II, III, and aVF, accompanied by positive, upright T waves. Lead aVR shows expected global inversion. The tracing displays a sinus rhythm with regular morphology, but the ST-segment deviations from the isoelectric baseline indicate acute myocardial injury. This visual material is a critical educational tool for teaching the ECG localization of coronary occlusions and the identification of STEMI criteria in an emergency clinical context.
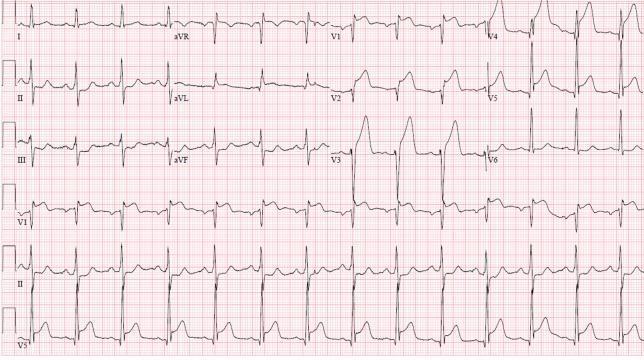
A 12-lead electrocardiogram (ECG) demonstrating an acute anterolateral ST-elevation myocardial infarction (STEMI). The tracing shows significant, convex-upward ST-segment elevation in the precordial leads (V1–V6), consistent with an anterior wall injury. Leads I and aVL also display ST-elevation, indicating lateral involvement. These changes are accompanied by hyperacute, peaked T-waves most prominent in V2 through V4. There is evidence of reciprocal ST-segment depression in the inferior leads (II, III, and aVF). The QRS complexes appear widened in the leads with maximal ST elevation. The heart rhythm is sinus. This ECG pattern is clinically significant for proximal left anterior descending (LAD) artery occlusion, necessitating urgent reperfusion therapy. The visual presentation focuses on teachable hallmarks of cardiac ischemia, including the relationship between anatomical lead distribution and corresponding vascular territories, as well as the identification of reciprocal changes in opposing leads.
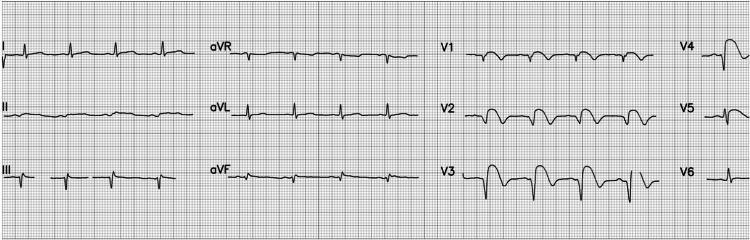
A 12-lead electrocardiogram (ECG) demonstrating an acute ST-elevation myocardial infarction (STEMI) with characteristic anterior and anterolateral findings. The tracing displays a normal sinus rhythm with a heart rate of approximately 84 beats per minute and normal P wave morphology. Significant pathology is localized to the precordial leads, specifically V2 through V5, which exhibit pronounced ST-segment elevation. This elevation presents with a convex 'tombstoning' morphology, a high-risk indicator of extensive myocardial injury. Additionally, evolving QS waves are visible in leads V2 and V3, indicating necrotic changes or transmural infarction. These findings are clinically consistent with an acute occlusion of the left anterior descending (LAD) coronary artery. The limb leads (I, II, III, aVR, aVL, aVF) show relatively stable baselines, though mild reciprocal changes or secondary ST-T wave abnormalities may be present in the inferior leads. This diagnostic image serves as a classic educational example of early-stage STEMI progression and the visual identification of localized ischemic injury on electrocardiography.
acute coronary syndrome pathophysiology plaque rupture thrombus
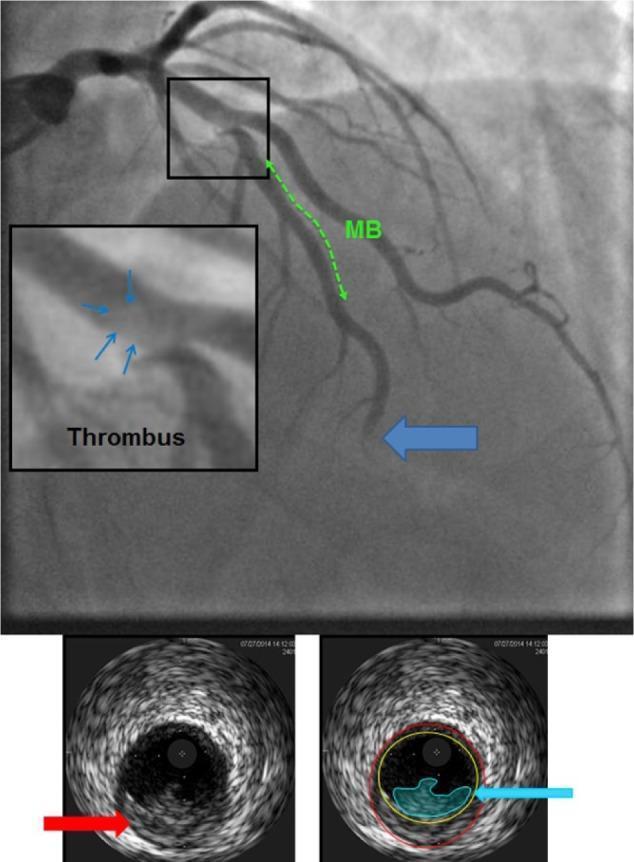
This composite clinical diagnostic image features a coronary angiogram and corresponding intravascular ultrasound (IVUS) frames depicting acute coronary syndrome. The large angiographic panel shows the Left Anterior Descending (LAD) artery. A proximal hazy filling defect, highlighted in a magnified inset, is consistent with an acute thrombus. A green dashed line identifies a myocardial bridge (MB) segment distal to the thrombus. A large blue arrow indicates a total distal occlusion of the LAD, suggestive of distal embolization from the proximal site. Below, two IVUS cross-sectional frames provide endovascular details. The left IVUS image uses a red arrow to denote a ruptured atherosclerotic plaque. The right IVUS image uses a blue arrow and light blue shading to highlight a luminal thrombus overlying the site of plaque rupture. This visual sequence demonstrates the pathophysiology of plaque rupture leading to local thrombus formation and subsequent distal coronary embolization in the setting of a myocardial bridge.
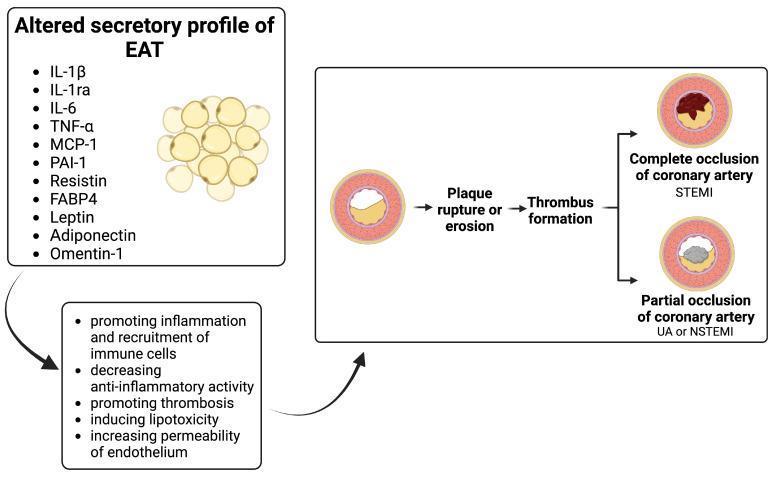
This pathophysiology diagram illustrates the link between the altered secretory profile of epicardial adipose tissue (EAT) and the pathogenesis of acute coronary syndrome (ACS). The left panel lists inflammatory cytokines and adipokines secreted by EAT, including IL-1β, IL-6, TNF-α, MCP-1, Resistin, FABP4, and Leptin, alongside anti-inflammatory factors like Adiponectin and Omentin-1. An arrow indicates how these secretions promote inflammation, immune cell recruitment, thrombosis, lipotoxicity, and increased endothelial permeability. The right panel depicts the progression of coronary artery disease: starting from an artery with a stable atherosclerotic plaque, the process advances through plaque rupture or erosion to thrombus formation. This culminates in two clinical outcomes: complete coronary artery occlusion, leading to ST-elevation myocardial infarction (STEMI), and partial occlusion, leading to unstable angina (UA) or non-ST-elevation myocardial infarction (NSTEMI). The diagram utilizes cross-sectional anatomical illustrations of coronary arteries to show varying degrees of luminal narrowing and thrombus size.
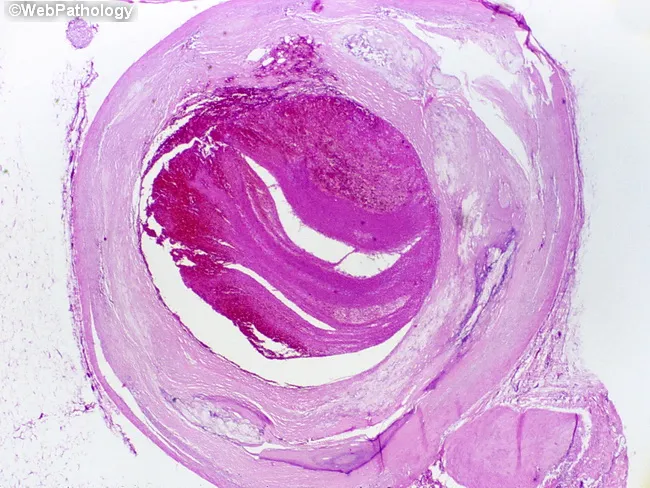
This is a light microscopic histopathology image of a human left anterior descending (LAD) coronary artery segment from autopsy. The specimen shows an atherosclerotic plaque with rupture of the fibrous cap and overlying luminal thrombosis, resulting in near-complete occlusion of the arterial lumen over approximately 1.0 cm. The arterial wall reveals intimal thickening with a lipid-rich necrotic core, cholesterol clefts, and inflammatory cells. The ruptured plaque exposes subendothelial thrombogenic material, provoking platelet aggregation and formation of an occlusive red thrombus that markedly narrows the lumen. The thrombus appears organized with layered eosinophilic material and fibrin, consistent with thrombotic components seen in acute coronary syndromes. The surrounding media may show early degenerative changes typical of atherosclerosis. This lesion corresponds to a fatal acute myocardial infarction in a patient with a history of ischemic heart disease and prior CAD. Clinically, the finding supports sudden cardiac death due to acute coronary occlusion from plaque rupture. The image emphasizes the pathophysiology of myocardial infarction: plaque instability, thrombosis, rapid flow limitation, and myocardial ischemia. It provides a classic autopsy correlate for education, teaching, and research on coronary atherosclerosis, plaque rupture, thrombosis, and sudden death. This histology image is ideal for autopsy teaching and cardiac pathology research.
non-cardiac causes chest pain differential diagnosis
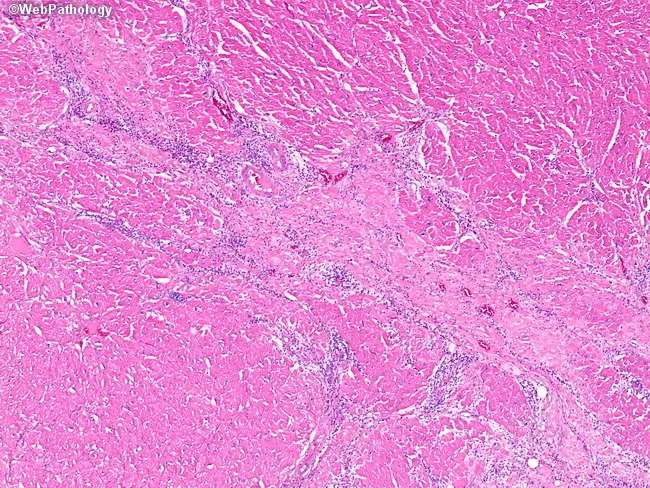
Histopathology with Hematoxylin and Eosin staining of cardiac myocardium. Low-power (4x–10x) view highlights ongoing inflammatory infiltrate within the myocardial interstitium and surrounding fibrous remodeling in the central portion of the field. In acute lymphocytic myocarditis, infiltrates are predominantly lymphocytes with accompanying macrophages, plasma cells, and occasional eosinophils in eosinophilic (hypersensitivity) variants. The myocardium shows non-ischemic myocyte destruction and interstitial fibrosis, consistent with Dallas criteria for myocarditis. The subepicardial and mid-wall distribution of inflammation and necrosis supports a non-coronary etiology, distinguishing from ischemic injury which concentrates within the subendocardium. Immunophenotyping may reveal a predominance of T-lymphocytes (CD3+) and, in hypersensitivity cases, marked eosinophilic involvement. Pathologic diagnosis of myocarditis carries prognostic significance, with potential progression to dilated cardiomyopathy or heart failure if inflammation persists. Clinically, findings may correlate with chest pain, troponin elevation, arrhythmias, and systolic dysfunction. Differential diagnoses include viral myocarditis, eosinophilic myocarditis, giant cell myocarditis, and ischemic cardiomyopathy. This image is relevant for education on histologic patterns of inflammatory heart disease, diagnostic pathology workflows, and research into inflammatory cardiomyopathies, immune-mediated injury, and treatment responses. It also serves as a reference for grading active inflammation versus chronic fibrotic scarring in myocardial tissue.
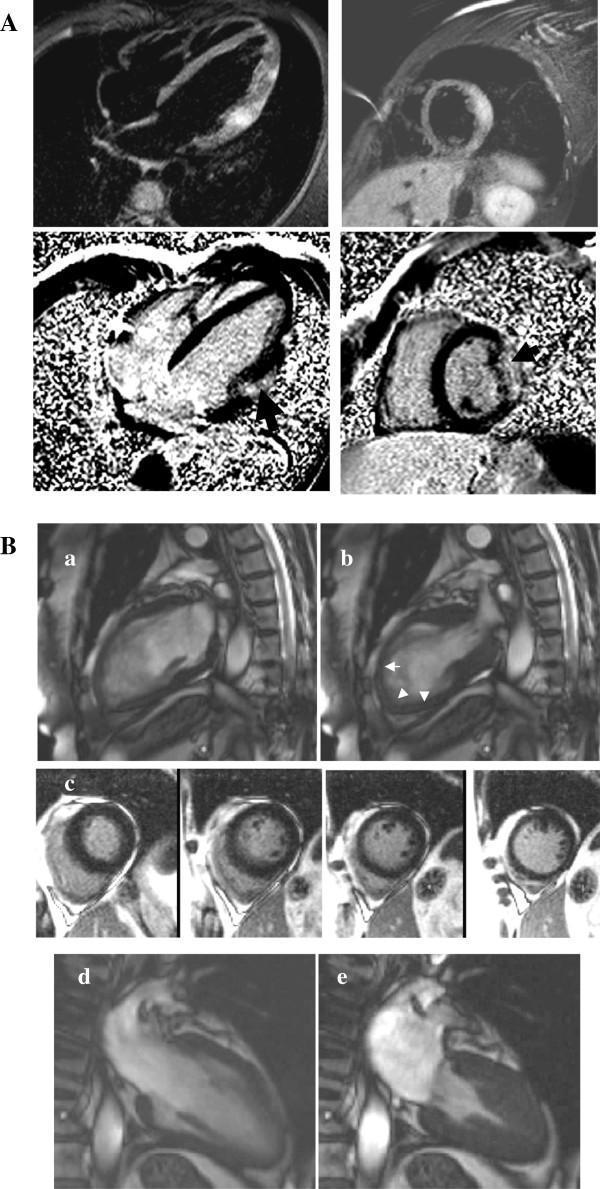
This diagnostic image provides a multi-panel Cardiac Magnetic Resonance (CMR) comparison of two acute chest pain syndromes: viral myocarditis and Tako-tsubo cardiomyopathy. Section A illustrates acute viral myocarditis using Short Tau Inversion Recovery (STIR) sequences (top) and Late Gadolinium Enhancement (LGE) sequences (middle). The STIR images (a-b) demonstrate myocardial edema as hyperintense (bright) signals in the lateral wall. Corresponding LGE images (c-d) reveal sub-epicardial enhancement (arrows), a hallmark of non-ischaemic inflammatory injury. Section B displays Tako-tsubo cardiomyopathy. The cine frames (a: diastole, b: systole) show classic 'apical ballooning' with systolic akinesia of the left ventricular apex (arrows). Middle row (c) shows a lack of LGE, distinguishing it from myocarditis or infarction. The bottom row (d-e) demonstrates full functional recovery at follow-up, with normal systolic contraction of the apex. This visual resource is designed for intermediate to advanced medical education in cardiology and radiology, focusing on differential diagnosis of cardiomyopathies through tissue characterization and wall motion analysis.
angina pectoris stable unstable classification
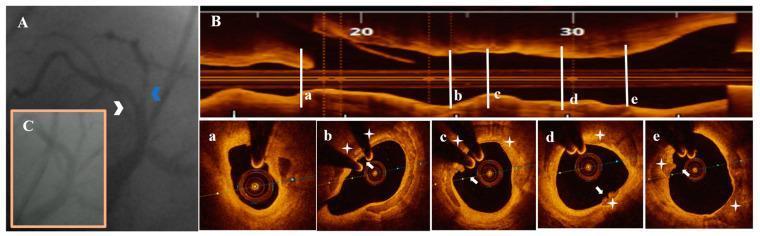
This composite figure illustrates diagnostic and therapeutic findings in a 74-year-old patient with unstable angina pectoris (UAP). Panel A is a coronary angiogram (CA) demonstrating multi-vessel involvement: a white arrowhead identifies borderline stenosis in the proximal left anterior descending (LAD) artery, and a blue arrowhead indicates significant stenosis in the proximal second diagonal branch. Panel B provides high-resolution optical coherence tomography (OCT) imaging of the LAD. The longitudinal top view shows the plaque extent, while cross-sections (a-e) reveal detailed morphology. Specifically, sections b through e highlight speckled echolucent plaque (SCP) consistent with plaque erosion (PE), characterized by an irregular lumen surface and white thrombi (white arrows) attached to the vessel wall. Section (a) quantifies severe area stenosis at 73.9%. Panel C shows the post-interventional CA result following percutaneous coronary intervention (PCI) with a 2.75 mm drug-eluting stent in the LAD and balloon angioplasty in the second diagonal branch, showing restored luminal patency.
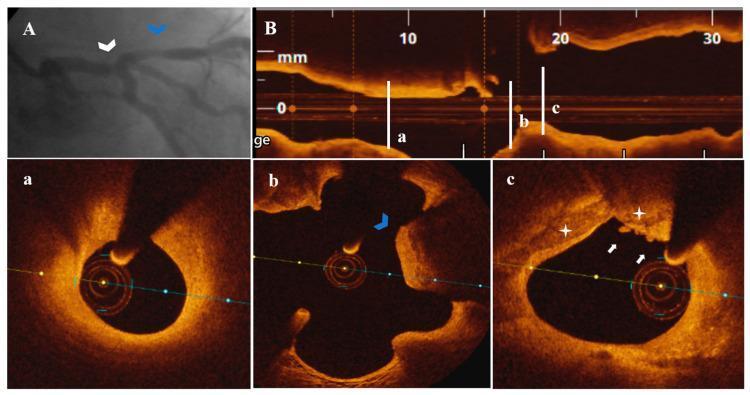
This composite medical image presents diagnostic findings for a 79-year-old patient with unstable angina pectoris (UAP), utilizing coronary angiography (CA) and optical coherence tomography (OCT). Panel A displays a CA of the left coronary system, identifying a borderline distal left main (LM) stenosis (white arrowhead) and a nonsignificant proximal left anterior descending (LAD) artery stenosis (blue arrowhead). Panel B provides a longitudinal OCT view of the LM-LAD segment with corresponding cross-sectional frames (a, b, c). Frame (a) shows a nonsignificant, uncomplicated LAD stenosis. Frame (b) highlights a calcified protrusion (blue arrowhead). Frame (c) demonstrates plaque erosion with superficial calcium protrusion (PE-SCP), indicated by white stars, accompanied by white thrombi (white arrows) within a nonsignificant LM stenosis (44.9% area stenosis). The imaging illustrates the utility of intravascular OCT in identifying specific high-risk plaque morphologies and thrombus formation in cases where angiography shows only borderline or nonsignificant coronary artery disease.
mkdir -p /tmp/workspace/acute-chest-pain-ppt && ls /tmp/workspace/
~/acute-chest-pain-ppt/build_ppt.py
"""
Acute Chest Pain - Emergency Medicine PPTX
Sources: Rosen's Emergency Medicine 9e & Tintinalli's Emergency Medicine 11e
"""
import subprocess, json, base64
from io import BytesIO
from pptx import Presentation
from pptx.util import Inches, Pt, Emu
from pptx.dml.color import RGBColor
from pptx.enum.text import PP_ALIGN, MSO_ANCHOR
from pptx.oxml.ns import qn
from lxml import etree

# ── Colours ──────────────────────────────────────────────────────────────
RED        = RGBColor(0xC0, 0x25, 0x2A)   # deep red (header accent)
DARK_NAVY  = RGBColor(0x14, 0x23, 0x4B)   # dark navy (title bg)
MID_NAVY   = RGBColor(0x1A, 0x3A, 0x6B)   # mid navy (section bg)
LIGHT_BLUE = RGBColor(0xE8, 0xF2, 0xFD)   # light blue (content bg)
WHITE      = RGBColor(0xFF, 0xFF, 0xFF)
GOLD       = RGBColor(0xF5, 0xA6, 0x23)
GRAY_TEXT  = RGBColor(0x33, 0x33, 0x33)
ORANGE     = RGBColor(0xE8, 0x6A, 0x1A)
GREEN      = RGBColor(0x1A, 0x7A, 0x3C)
TEAL       = RGBColor(0x0D, 0x7B, 0x8C)

W = Inches(13.333)
H = Inches(7.5)

prs = Presentation()
prs.slide_width  = W
prs.slide_height = H
blank = prs.slide_layouts[6]

# ── Helpers ───────────────────────────────────────────────────────────────
def add_rect(slide, x, y, w, h, fill_color, alpha=None):
    shape = slide.shapes.add_shape(1, x, y, w, h)
    shape.line.fill.background()
    shape.fill.solid()
    shape.fill.fore_color.rgb = fill_color
    return shape

def add_text(slide, text, x, y, w, h, font_size=18, bold=False,
             color=WHITE, align=PP_ALIGN.LEFT, italic=False,
             word_wrap=True, v_anchor=MSO_ANCHOR.TOP):
    tb = slide.shapes.add_textbox(x, y, w, h)
    tf = tb.text_frame
    tf.word_wrap = word_wrap
    tf.vertical_anchor = v_anchor
    tf.margin_left = Pt(4)
    tf.margin_right = Pt(4)
    tf.margin_top = Pt(2)
    tf.margin_bottom = Pt(2)
    p = tf.paragraphs[0]
    p.alignment = align
    r = p.add_run()
    r.text = text
    r.font.size = Pt(font_size)
    r.font.bold = bold
    r.font.italic = italic
    r.font.color.rgb = color
    r.font.name = "Calibri"
    return tf

def add_bullet_box(slide, items, x, y, w, h, font_size=15,
                   title=None, title_color=GOLD, title_size=17,
                   bullet_color=GRAY_TEXT, bg=None, indent=True):
    if bg:
        add_rect(slide, x, y, w, h, bg)
    tb = slide.shapes.add_textbox(x + Inches(0.1), y + Inches(0.08),
                                  w - Inches(0.2), h - Inches(0.1))
    tf = tb.text_frame
    tf.word_wrap = True
    tf.margin_left = Pt(4)
    tf.margin_right = Pt(4)
    tf.margin_top = Pt(2)
    first = True
    if title:
        p = tf.paragraphs[0] if first else tf.add_paragraph()
        first = False
        p.alignment = PP_ALIGN.LEFT
        r = p.add_run()
        r.text = title
        r.font.size = Pt(title_size)
        r.font.bold = True
        r.font.color.rgb = title_color
        r.font.name = "Calibri"
    for item in items:
        p = tf.add_paragraph() if not first else tf.paragraphs[0]
        first = False
        p.alignment = PP_ALIGN.LEFT
        if indent:
            p.level = 0
        r = p.add_run()
        r.text = ("• " if not item.startswith("  ") else "   ◦ ") + item.lstrip()
        r.font.size = Pt(font_size)
        r.font.color.rgb = bullet_color
        r.font.name = "Calibri"
    return tf

def fetch_image_b64(url):
    try:
        result = json.loads(subprocess.check_output(
            ["python", "/tmp/skills/shared/scripts/fetch_images.py", url],
            timeout=30
        ))
        if result and result[0].get("base64"):
            return result[0]["base64"]
    except Exception as e:
        print(f"Image fetch failed: {e}")
    return None

def add_image_from_url(slide, url, x, y, w, h):
    b64 = fetch_image_b64(url)
    if b64:
        # strip data:image/xxx;base64, prefix if present
        if "," in b64:
            b64 = b64.split(",", 1)[1]
        img_bytes = base64.b64decode(b64)
        slide.shapes.add_picture(BytesIO(img_bytes), x, y, w, h)
        return True
    return False

def divider_line(slide, y, color=GOLD):
    line = slide.shapes.add_shape(1, Inches(0.5), y, Inches(12.3), Pt(2))
    line.fill.solid()
    line.fill.fore_color.rgb = color
    line.line.fill.background()

# ══════════════════════════════════════════════════════════════
# SLIDE 1 — TITLE SLIDE
# ══════════════════════════════════════════════════════════════
sl = prs.slides.add_slide(blank)
add_rect(sl, 0, 0, W, H, DARK_NAVY)
# Red accent bar top
add_rect(sl, 0, 0, W, Inches(0.18), RED)
# Gold accent bar bottom
add_rect(sl, 0, H - Inches(0.18), W, Inches(0.18), GOLD)
# Central content area
add_rect(sl, Inches(1.0), Inches(1.2), Inches(11.3), Inches(5.1), MID_NAVY)
add_text(sl, "ACUTE CHEST PAIN", Inches(1.3), Inches(1.5), Inches(10.7), Inches(1.4),
         font_size=48, bold=True, color=WHITE, align=PP_ALIGN.CENTER)
add_text(sl, "Emergency Evaluation & Management", Inches(1.3), Inches(2.9), Inches(10.7), Inches(0.7),
         font_size=26, bold=False, color=GOLD, align=PP_ALIGN.CENTER, italic=True)
divider_line(sl, Inches(3.7), GOLD)
add_text(sl, "ACS  •  MI  •  Angina  •  Non-Cardiac Causes  •  ECG Basics  •  First-Hour Management",
         Inches(1.3), Inches(3.85), Inches(10.7), Inches(0.6),
         font_size=16, color=LIGHT_BLUE, align=PP_ALIGN.CENTER)
add_text(sl,
         "Reference: Rosen's Emergency Medicine, 9th Ed.\nTintinalli's Emergency Medicine, 11th Ed.",
         Inches(1.3), Inches(4.6), Inches(10.7), Inches(0.9),
         font_size=14, color=GOLD, align=PP_ALIGN.CENTER, italic=True)
add_text(sl, "Emergency Medicine  |  July 2026",
         Inches(1.3), Inches(5.55), Inches(10.7), Inches(0.5),
         font_size=13, color=RGBColor(0xAA, 0xBB, 0xCC), align=PP_ALIGN.CENTER)

# ══════════════════════════════════════════════════════════════
# SLIDE 2 — TABLE OF CONTENTS
# ══════════════════════════════════════════════════════════════
sl = prs.slides.add_slide(blank)
add_rect(sl, 0, 0, W, H, LIGHT_BLUE)
add_rect(sl, 0, 0, W, Inches(1.05), DARK_NAVY)
add_text(sl, "Contents", Inches(0.5), Inches(0.1), Inches(12), Inches(0.85),
         font_size=36, bold=True, color=WHITE, align=PP_ALIGN.LEFT)

topics = [
    ("1", "Approach to Acute Chest Pain",         "— Epidemiology, Risk Stratification, MONA"),
    ("2", "Acute Coronary Syndromes",              "— UA, NSTEMI, STEMI: Pathophysiology & Features"),
    ("3", "Angina Pectoris",                       "— Stable, Unstable, Variant (Prinzmetal's)"),
    ("4", "Non-Cardiac Causes of Chest Pain",      "— PE, Aortic Dissection, Pneumothorax, GI, MSK"),
    ("5", "ECG Basics in Chest Pain",              "— STEMI Localisation, LBBB, Ischaemia Patterns"),
    ("6", "First-Hour Management",                 "— STEMI vs NSTEMI Algorithms, Antiplatelet, Reperfusion"),
    ("7", "Risk Scores & Disposition",             "— HEART Score, TIMI, GRACE, Safe Discharge"),
]
colors = [RED, ORANGE, GREEN, TEAL, MID_NAVY, RGBColor(0x7B, 0x1F, 0xA2), RGBColor(0x1A, 0x6A, 0x5A)]
for i, (num, title, sub) in enumerate(topics):
    gy = Inches(1.2) + i * Inches(0.86)
    add_rect(sl, Inches(0.3), gy, Inches(0.55), Inches(0.7), colors[i])
    add_text(sl, num, Inches(0.3), gy, Inches(0.55), Inches(0.7),
             font_size=22, bold=True, color=WHITE, align=PP_ALIGN.CENTER,
             v_anchor=MSO_ANCHOR.MIDDLE)
    add_text(sl, title, Inches(1.0), gy, Inches(5.5), Inches(0.7),
             font_size=17, bold=True, color=DARK_NAVY, align=PP_ALIGN.LEFT,
             v_anchor=MSO_ANCHOR.MIDDLE)
    add_text(sl, sub, Inches(6.6), gy, Inches(6.3), Inches(0.7),
             font_size=14, bold=False, color=RGBColor(0x44, 0x44, 0x66),
             align=PP_ALIGN.LEFT, italic=True, v_anchor=MSO_ANCHOR.MIDDLE)

# ══════════════════════════════════════════════════════════════
# SLIDE 3 — APPROACH TO ACUTE CHEST PAIN
# ══════════════════════════════════════════════════════════════
sl = prs.slides.add_slide(blank)
add_rect(sl, 0, 0, W, H, RGBColor(0xF7, 0xF9, 0xFF))
add_rect(sl, 0, 0, W, Inches(1.05), DARK_NAVY)
add_text(sl, "Approach to Acute Chest Pain", Inches(0.5), Inches(0.1), Inches(11), Inches(0.85),
         font_size=30, bold=True, color=WHITE)
add_text(sl, "Rosen's EM 9e | Tintinalli 11e", Inches(11.0), Inches(0.1), Inches(2.1), Inches(0.85),
         font_size=11, color=GOLD, align=PP_ALIGN.RIGHT, italic=True)

# Left column
add_bullet_box(sl,
    ["Annual ED visits: >8 million in USA (chest pain is #2 chief complaint)",
     "Missed MI mortality rate: 2× vs. treated MI",
     "5–10% of patients with AMI are discharged home",
     "HEART score used for risk stratification in ED"],
    Inches(0.3), Inches(1.1), Inches(4.0), Inches(2.5),
    title="Epidemiology", title_color=RED, bg=RGBColor(0xFF, 0xF0, 0xF0),
    bullet_color=GRAY_TEXT, font_size=13)

add_bullet_box(sl,
    ["Onset, location, quality, radiation (jaw, arm, shoulder, back)",
     "Duration & timing; precipitating & relieving factors",
     "Associated symptoms: diaphoresis, dyspnoea, nausea, syncope",
     "Atypical presentations common in women, elderly, diabetics"],
    Inches(0.3), Inches(3.75), Inches(4.0), Inches(2.6),
    title="History", title_color=RED, bg=RGBColor(0xFF, 0xF0, 0xF0),
    bullet_color=GRAY_TEXT, font_size=13)

# Middle column — immediate actions
add_bullet_box(sl,
    ["IV access, cardiac monitor, pulse oximetry",
     "12-lead ECG within 10 minutes of arrival",
     "High-flow O₂ if SpO₂ <90%",
     "Serial troponins (0h and 1h or 0h and 3h)",
     "CXR, BMP, CBC, coagulation studies"],
    Inches(4.5), Inches(1.1), Inches(4.2), Inches(3.0),
    title="Immediate Actions", title_color=TEAL, bg=RGBColor(0xE0, 0xF7, 0xFA),
    bullet_color=GRAY_TEXT, font_size=13)

# MONA box
add_rect(sl, Inches(4.5), Inches(4.25), Inches(4.2), Inches(2.1), DARK_NAVY)
add_text(sl, "M-O-N-A (ACS Protocol)", Inches(4.6), Inches(4.3), Inches(4.0), Inches(0.45),
         font_size=15, bold=True, color=GOLD)
mona = [
    ("M", "Morphine", " — titrated IV for pain relief"),
    ("O", "Oxygen", " — if SpO₂ < 90%"),
    ("N", "Nitrates", " — SL nitroglycerin (avoid if RV infarct)"),
    ("A", "Aspirin", " — 162–325 mg chewable immediately"),
]
for j, (let, drug, desc) in enumerate(mona):
    yy = Inches(4.8) + j * Inches(0.35)
    add_text(sl, let, Inches(4.6), yy, Inches(0.35), Inches(0.35),
             font_size=16, bold=True, color=GOLD)
    add_text(sl, drug + desc, Inches(5.0), yy, Inches(3.55), Inches(0.35),
             font_size=13, color=WHITE)

# Right column — Life-threatening differential
add_bullet_box(sl,
    ["STEMI / NSTEMI",
     "Aortic dissection",
     "Pulmonary embolism",
     "Tension pneumothorax",
     "Cardiac tamponade",
     "Oesophageal rupture (Boerhaave)"],
    Inches(9.0), Inches(1.1), Inches(4.0), Inches(3.3),
    title="Life-Threatening Differentials", title_color=RED,
    bg=RGBColor(0xFF, 0xF0, 0xF0), bullet_color=GRAY_TEXT, font_size=13)

add_rect(sl, Inches(9.0), Inches(4.55), Inches(4.0), Inches(1.8), RGBColor(0xE8, 0xF5, 0xE9))
add_text(sl, "KEY PEARL", Inches(9.1), Inches(4.6), Inches(3.8), Inches(0.4),
         font_size=14, bold=True, color=GREEN)
add_text(sl,
         "Normal initial ECG & troponin do NOT exclude ACS.\n"
         "Serial testing and clinical risk scores are mandatory.",
         Inches(9.1), Inches(5.05), Inches(3.8), Inches(1.2),
         font_size=13, color=GRAY_TEXT, word_wrap=True)

# ══════════════════════════════════════════════════════════════
# SLIDE 4 — ACS PATHOPHYSIOLOGY
# ══════════════════════════════════════════════════════════════
sl = prs.slides.add_slide(blank)
add_rect(sl, 0, 0, W, H, RGBColor(0xF7, 0xF9, 0xFF))
add_rect(sl, 0, 0, W, Inches(1.05), DARK_NAVY)
add_text(sl, "Acute Coronary Syndromes — Pathophysiology", Inches(0.5), Inches(0.1), Inches(11), Inches(0.85),
         font_size=28, bold=True, color=WHITE)
add_text(sl, "Rosen's EM 9e, Ch. 64", Inches(11.0), Inches(0.1), Inches(2.1), Inches(0.85),
         font_size=11, color=GOLD, align=PP_ALIGN.RIGHT, italic=True)

# Pathophysiology flow
steps = [
    ("Stable Plaque", "Lipid-rich core\ncovered by intact\nfibrous cap", TEAL),
    ("Plaque Rupture\n/ Erosion", "Thin-cap fibroatheroma;\nplatelet activation;\nthrombogenic core exposed", ORANGE),
    ("Thrombus\nFormation", "Partial (NSTEMI/UA)\nor complete occlusion\n(STEMI)", RED),
    ("Myocardial\nIschaemia", "O₂ supply-demand\nmismatch; troponin\nleak (necrosis)", MID_NAVY),
]
for i, (title, body, col) in enumerate(steps):
    sx = Inches(0.3) + i * Inches(3.25)
    add_rect(sl, sx, Inches(1.15), Inches(3.0), Inches(1.05), col)
    add_text(sl, title, sx, Inches(1.15), Inches(3.0), Inches(1.05),
             font_size=15, bold=True, color=WHITE, align=PP_ALIGN.CENTER,
             v_anchor=MSO_ANCHOR.MIDDLE)
    add_rect(sl, sx, Inches(2.25), Inches(3.0), Inches(1.15), RGBColor(0xEE, 0xF4, 0xFF))
    add_text(sl, body, sx + Inches(0.05), Inches(2.3), Inches(2.9), Inches(1.05),
             font_size=13, color=GRAY_TEXT)
    # Arrow
    if i < 3:
        add_rect(sl, sx + Inches(3.05), Inches(1.55), Inches(0.2), Inches(0.35), col)
        add_text(sl, "▶", sx + Inches(3.0), Inches(1.5), Inches(0.35), Inches(0.45),
                 font_size=20, color=col)

# ACS Spectrum
add_rect(sl, Inches(0.3), Inches(3.55), Inches(12.7), Inches(0.55), DARK_NAVY)
add_text(sl, "ACS SPECTRUM", Inches(0.3), Inches(3.55), Inches(12.7), Inches(0.55),
         font_size=16, bold=True, color=GOLD, align=PP_ALIGN.CENTER, v_anchor=MSO_ANCHOR.MIDDLE)

spec = [
    ("STABLE ANGINA", "NOT ACS\nFixed stenosis\nExertional only",
     "No troponin rise\nST depression on\nexertion only", RGBColor(0x78, 0x90, 0xAA)),
    ("UNSTABLE ANGINA\n(UA)", "Rest pain or\nincreasing frequency;\nno troponin rise",
     "ECG: transient\nST/T changes\nor normal", ORANGE),
    ("NSTEMI", "Rest pain;\ntroponin elevated\n(myocyte necrosis)",
     "ECG: ST depression,\nT-wave inversions;\nno ST elevation", RED),
    ("STEMI", "Complete occlusion;\nrapid troponin rise;\nsevere ischaemia",
     "ECG: ≥1 mm ST\nelevation ≥2 leads\n(or new LBBB)", RGBColor(0x8B, 0x00, 0x00)),
]
for i, (name, feat, ecg, col) in enumerate(spec):
    sx = Inches(0.3) + i * Inches(3.25)
    add_rect(sl, sx, Inches(4.15), Inches(3.0), Inches(0.6), col)
    add_text(sl, name, sx, Inches(4.15), Inches(3.0), Inches(0.6),
             font_size=13, bold=True, color=WHITE, align=PP_ALIGN.CENTER, v_anchor=MSO_ANCHOR.MIDDLE)
    add_rect(sl, sx, Inches(4.8), Inches(3.0), Inches(2.55), RGBColor(0xF5, 0xF8, 0xFF))
    add_text(sl, feat, sx + Inches(0.05), Inches(4.85), Inches(2.9), Inches(1.1),
             font_size=12, color=GRAY_TEXT)
    add_rect(sl, sx, Inches(5.4), Inches(3.0), Inches(0.08), col)

# Image — ACS pathophysiology
ok = add_image_from_url(sl,
    "https://cdn.orris.care/cdss_images/pmc_clinical_VQA_de796df8c836557fec8258eae6ba9670fd25f32c0389b1a22fb8f9a7e9577719.jpg",
    Inches(9.3), Inches(4.15), Inches(3.7), Inches(3.1))
if not ok:
    add_rect(sl, Inches(9.3), Inches(4.15), Inches(3.7), Inches(3.1), RGBColor(0xDD, 0xEE, 0xFF))
    add_text(sl, "ACS Pathophysiology\n(Plaque → Thrombus)", Inches(9.3), Inches(4.15), Inches(3.7), Inches(3.1),
             font_size=13, color=MID_NAVY, align=PP_ALIGN.CENTER, v_anchor=MSO_ANCHOR.MIDDLE)

# ══════════════════════════════════════════════════════════════
# SLIDE 5 — STEMI: CLINICAL FEATURES & DIAGNOSIS
# ══════════════════════════════════════════════════════════════
sl = prs.slides.add_slide(blank)
add_rect(sl, 0, 0, W, H, RGBColor(0xFE, 0xF9, 0xF9))
add_rect(sl, 0, 0, W, Inches(1.05), RED)
add_text(sl, "STEMI — Clinical Features & Diagnosis", Inches(0.5), Inches(0.1), Inches(11), Inches(0.85),
         font_size=28, bold=True, color=WHITE)
add_text(sl, "Rosen's EM 9e, Ch. 64", Inches(11.0), Inches(0.1), Inches(2.1), Inches(0.85),
         font_size=11, color=GOLD, align=PP_ALIGN.RIGHT, italic=True)

add_bullet_box(sl,
    ["Crushing/pressure-like chest pain (>30 min)",
     "Radiation to left arm, jaw, shoulder, back",
     "Diaphoresis, nausea, vomiting, dyspnoea",
     "Pale, anxious, sense of impending doom",
     "Atypical: epigastric pain, isolated dyspnoea (women/elderly/DM)",
     "Killip Class stratifies severity (I–IV)"],
    Inches(0.3), Inches(1.15), Inches(4.5), Inches(3.3),
    title="Clinical Presentation", title_color=RED, bg=RGBColor(0xFF, 0xED, 0xED),
    bullet_color=GRAY_TEXT, font_size=13)

add_bullet_box(sl,
    ["ECG: ST elevation ≥1 mm in ≥2 contiguous leads",
     "New LBBB + ischaemic symptoms = STEMI-equivalent",
     "Serum troponin (hs-cTn): rises within 1–3 h",
     "Troponin T or I peaks at 12–24 h",
     "CKMB: less specific; useful for re-infarction",
     "CXR: pulmonary oedema, cardiomegaly",
     "Echocardiography: wall motion abnormalities"],
    Inches(0.3), Inches(4.55), Inches(4.5), Inches(2.8),
    title="Investigations", title_color=RED, bg=RGBColor(0xFF, 0xED, 0xED),
    bullet_color=GRAY_TEXT, font_size=13)

# Localisation table
add_rect(sl, Inches(5.0), Inches(1.15), Inches(4.2), Inches(0.48), DARK_NAVY)
add_text(sl, "STEMI Localisation (Rosen's Table 64.3)", Inches(5.0), Inches(1.15), Inches(4.2), Inches(0.48),
         font_size=14, bold=True, color=WHITE, align=PP_ALIGN.CENTER, v_anchor=MSO_ANCHOR.MIDDLE)
loc_data = [
    ("Inferior", "II, III, aVF", "RCA (80%)"),
    ("Anterior", "V1–V4", "LAD"),
    ("Lateral", "I, aVL, V5–V6", "LCx / LAD diagonal"),
    ("Posterior", "V1–V2 R-wave, V7–V9", "RCA / LCx"),
    ("RV", "V1, V3R–V4R", "Proximal RCA"),
    ("Septal", "V1–V2", "LAD septal branches"),
]
hdrs = ["Territory", "Leads", "Artery"]
hcolors = [RED, RED, RED]
for col_i, hdr in enumerate(hdrs):
    cx = Inches(5.0) + col_i * Inches(1.4)
    add_rect(sl, cx, Inches(1.65), Inches(1.4), Inches(0.38), MID_NAVY)
    add_text(sl, hdr, cx, Inches(1.65), Inches(1.4), Inches(0.38),
             font_size=12, bold=True, color=WHITE, align=PP_ALIGN.CENTER, v_anchor=MSO_ANCHOR.MIDDLE)
for row_i, row in enumerate(loc_data):
    row_y = Inches(2.05) + row_i * Inches(0.38)
    bg_c = RGBColor(0xFF, 0xF0, 0xF0) if row_i % 2 == 0 else WHITE
    for col_i, cell in enumerate(row):
        cx = Inches(5.0) + col_i * Inches(1.4)
        add_rect(sl, cx, row_y, Inches(1.4), Inches(0.38), bg_c)
        add_text(sl, cell, cx + Inches(0.05), row_y, Inches(1.3), Inches(0.38),
                 font_size=11, color=GRAY_TEXT, v_anchor=MSO_ANCHOR.MIDDLE)

# ECG image
ok = add_image_from_url(sl,
    "https://cdn.orris.care/cdss_images/pmc_clinical_VQA_16738d4b125195130b5e53a811645d4064182fc2bbd0de16b0e00a57af7ff6ef.jpg",
    Inches(9.35), Inches(1.15), Inches(3.8), Inches(3.4))
if not ok:
    add_rect(sl, Inches(9.35), Inches(1.15), Inches(3.8), Inches(3.4), RGBColor(0xDD, 0xEE, 0xFF))
    add_text(sl, "STEMI ECG\n(Anterior STE)", Inches(9.35), Inches(1.15), Inches(3.8), Inches(3.4),
             font_size=13, color=MID_NAVY, align=PP_ALIGN.CENTER, v_anchor=MSO_ANCHOR.MIDDLE)
add_text(sl, "12-lead ECG: Anterior STEMI (V2–V4 STE + reciprocal changes inferiorly)",
         Inches(9.35), Inches(4.6), Inches(3.8), Inches(0.55),
         font_size=11, color=GRAY_TEXT, italic=True)

# STEMI complications
add_bullet_box(sl,
    ["Ventricular fibrillation (4–5% of AMI patients; 80% within 12 h)",
     "Cardiogenic shock — poor prognosis with anterior STEMI",
     "AV block/bradycardia (25–30%): inferior STEMI → atropine responsive",
     "Mechanical: free-wall rupture, VSD, papillary muscle rupture",
     "Right ventricular infarction (RV leads V3R–V4R)"],
    Inches(5.0), Inches(4.55), Inches(8.1), Inches(2.8),
    title="Complications of Acute MI", title_color=DARK_NAVY,
    bg=RGBColor(0xE8, 0xED, 0xFF), bullet_color=GRAY_TEXT, font_size=12)

# ══════════════════════════════════════════════════════════════
# SLIDE 6 — NSTEMI & UNSTABLE ANGINA
# ══════════════════════════════════════════════════════════════
sl = prs.slides.add_slide(blank)
add_rect(sl, 0, 0, W, H, RGBColor(0xF9, 0xF6, 0xFE))
add_rect(sl, 0, 0, W, Inches(1.05), ORANGE)
add_text(sl, "NSTEMI & Unstable Angina", Inches(0.5), Inches(0.1), Inches(11), Inches(0.85),
         font_size=28, bold=True, color=WHITE)
add_text(sl, "Rosen's EM 9e, Ch. 64", Inches(11.0), Inches(0.1), Inches(2.1), Inches(0.85),
         font_size=11, color=WHITE, align=PP_ALIGN.RIGHT, italic=True)

# UA vs NSTEMI comparison
add_rect(sl, Inches(0.3), Inches(1.15), Inches(6.1), Inches(0.48), MID_NAVY)
add_text(sl, "Unstable Angina (UA)", Inches(0.3), Inches(1.15), Inches(6.1), Inches(0.48),
         font_size=16, bold=True, color=WHITE, align=PP_ALIGN.CENTER, v_anchor=MSO_ANCHOR.MIDDLE)
add_bullet_box(sl,
    ["New-onset angina or angina at rest",
     "Crescendo pattern: increasing severity/frequency",
     "Post-infarction angina within 2 weeks",
     "TROPONIN NORMAL (no myocyte necrosis)",
     "ECG: transient ST depression or T-wave changes, or normal",
     "Requires immediate risk stratification"],
    Inches(0.3), Inches(1.65), Inches(6.1), Inches(2.6),
    bg=RGBColor(0xFF, 0xF3, 0xE0), bullet_color=GRAY_TEXT, font_size=13)

add_rect(sl, Inches(6.6), Inches(1.15), Inches(6.4), Inches(0.48), RED)
add_text(sl, "NSTEMI", Inches(6.6), Inches(1.15), Inches(6.4), Inches(0.48),
         font_size=16, bold=True, color=WHITE, align=PP_ALIGN.CENTER, v_anchor=MSO_ANCHOR.MIDDLE)
add_bullet_box(sl,
    ["Same symptoms as UA BUT troponin elevated",
     "Partial coronary occlusion or severe stenosis",
     "ECG: ST depression, T-wave inversions in ≥2 leads",
     "No ST elevation (differentiates from STEMI)",
     "Troponin rise/fall pattern confirms myocardial necrosis",
     "Early invasive strategy (PCI within 24–48 h for high risk)"],
    Inches(6.6), Inches(1.65), Inches(6.4), Inches(2.6),
    bg=RGBColor(0xFF, 0xED, 0xED), bullet_color=GRAY_TEXT, font_size=13)

# TIMI Risk Score
add_rect(sl, Inches(0.3), Inches(4.35), Inches(6.1), Inches(0.45), TEAL)
add_text(sl, "TIMI Risk Score (UA/NSTEMI)", Inches(0.3), Inches(4.35), Inches(6.1), Inches(0.45),
         font_size=14, bold=True, color=WHITE, align=PP_ALIGN.CENTER, v_anchor=MSO_ANCHOR.MIDDLE)
timi_items = [
    "≥65 years of age (+1)",
    "≥3 CAD risk factors (+1)",
    "Known coronary stenosis >50% (+1)",
    "ST deviation on admission ECG (+1)",
    "≥2 anginal events in prior 24h (+1)",
    "Aspirin use in prior 7 days (+1)",
    "Elevated serum cardiac markers (+1)",
    "Score 0–2 = Low; 3–4 = Intermediate; 5–7 = High risk",
]
add_bullet_box(sl, timi_items, Inches(0.3), Inches(4.82), Inches(6.1), Inches(2.55),
               bg=RGBColor(0xE0, 0xF7, 0xFA), bullet_color=GRAY_TEXT, font_size=12)

# NSTEMI Management
add_rect(sl, Inches(6.6), Inches(4.35), Inches(6.4), Inches(0.45), RED)
add_text(sl, "NSTEMI — Initial ED Management", Inches(6.6), Inches(4.35), Inches(6.4), Inches(0.45),
         font_size=14, bold=True, color=WHITE, align=PP_ALIGN.CENTER, v_anchor=MSO_ANCHOR.MIDDLE)
nstemi_mgmt = [
    "Aspirin 162–325 mg (chewable) immediately",
    "P2Y12 inhibitor: clopidogrel / ticagrelor / prasugrel",
    "Anticoagulation: UFH, enoxaparin, or fondaparinux",
    "Beta-blocker (oral, if no contraindication within 24 h)",
    "Statin therapy (high-intensity: atorvastatin 80 mg)",
    "Nitrates (sublingual / IV for persistent chest pain)",
    "Oxygen only if SpO₂ <90%",
    "Avoid GP IIb/IIIa inhibitors unless PCI planned",
]
add_bullet_box(sl, nstemi_mgmt, Inches(6.6), Inches(4.82), Inches(6.4), Inches(2.55),
               bg=RGBColor(0xFF, 0xED, 0xED), bullet_color=GRAY_TEXT, font_size=12)

# ══════════════════════════════════════════════════════════════
# SLIDE 7 — ANGINA PECTORIS
# ══════════════════════════════════════════════════════════════
sl = prs.slides.add_slide(blank)
add_rect(sl, 0, 0, W, H, RGBColor(0xF2, 0xFB, 0xF4))
add_rect(sl, 0, 0, W, Inches(1.05), GREEN)
add_text(sl, "Angina Pectoris", Inches(0.5), Inches(0.1), Inches(11), Inches(0.85),
         font_size=30, bold=True, color=WHITE)
add_text(sl, "Rosen's EM 9e", Inches(11.0), Inches(0.1), Inches(2.1), Inches(0.85),
         font_size=11, color=WHITE, align=PP_ALIGN.RIGHT, italic=True)

types = [
    ("STABLE ANGINA", GREEN,
     ["Predictable exertional chest pain", "Relieved by rest or GTN within 5 min",
      "Fixed-grade atherosclerotic stenosis", "CCS grading: Class I–IV",
      "No troponin elevation; ECG may show ST-depression on stress",
      "Management: GTN PRN, beta-blockers, CCBs, long-acting nitrates",
      "Refer for stress testing / coronary angiography"]),
    ("UNSTABLE ANGINA", ORANGE,
     ["Rest pain or new-onset angina", "Increasing frequency/duration",
      "Braunwald classification (I–III / A–C)",
      "No troponin elevation distinguishes from NSTEMI",
      "Requires urgent ED evaluation and admission",
      "Management: MONA, anticoagulation, P2Y12 inhibitor",
      "Cardiology consult; risk stratification required"]),
    ("VARIANT (PRINZMETAL'S)", TEAL,
     ["Coronary artery spasm; often at rest / early morning",
      "Young women, smokers; may have no fixed stenosis",
      "ECG: transient ST elevation during pain (resolves with GTN)",
      "Troponin usually normal unless prolonged spasm",
      "Provocation tests (ergonovine) in cath lab",
      "Treatment: calcium channel blockers (1st line); avoid beta-blockers",
      "Nitrates for acute episodes"]),
]
for i, (title, col, items) in enumerate(types):
    sx = Inches(0.3) + i * Inches(4.35)
    add_rect(sl, sx, Inches(1.15), Inches(4.1), Inches(0.5), col)
    add_text(sl, title, sx, Inches(1.15), Inches(4.1), Inches(0.5),
             font_size=14, bold=True, color=WHITE, align=PP_ALIGN.CENTER, v_anchor=MSO_ANCHOR.MIDDLE)
    add_bullet_box(sl, items, sx, Inches(1.68), Inches(4.1), Inches(5.65),
                   bg=RGBColor(0xF0, 0xFB, 0xF2) if col == GREEN else
                      RGBColor(0xFF, 0xF3, 0xE0) if col == ORANGE else
                      RGBColor(0xE0, 0xF7, 0xFA),
                   bullet_color=GRAY_TEXT, font_size=12.5)

# CCS table
add_rect(sl, Inches(0.3), Inches(7.0), Inches(12.7), Inches(0.38), DARK_NAVY)
add_text(sl, "CCS Grading: I = No limitation  |  II = Slight limitation (climbing stairs, walking uphill)  |  "
             "III = Marked limitation  |  IV = Angina at rest",
         Inches(0.3), Inches(7.0), Inches(12.7), Inches(0.38),
         font_size=12, color=WHITE, align=PP_ALIGN.CENTER, v_anchor=MSO_ANCHOR.MIDDLE)

# ══════════════════════════════════════════════════════════════
# SLIDE 8 — NON-CARDIAC CAUSES OF CHEST PAIN
# ══════════════════════════════════════════════════════════════
sl = prs.slides.add_slide(blank)
add_rect(sl, 0, 0, W, H, RGBColor(0xF5, 0xF5, 0xFF))
add_rect(sl, 0, 0, W, Inches(1.05), TEAL)
add_text(sl, "Non-Cardiac Causes of Chest Pain", Inches(0.5), Inches(0.1), Inches(11), Inches(0.85),
         font_size=28, bold=True, color=WHITE)
add_text(sl, "Tintinalli 11e | Rosen's EM 9e", Inches(10.5), Inches(0.1), Inches(2.6), Inches(0.85),
         font_size=11, color=WHITE, align=PP_ALIGN.RIGHT, italic=True)

categories = [
    ("PULMONARY", TEAL, [
        "Pulmonary Embolism (PE): pleuritic pain, dyspnoea, tachycardia; D-dimer, CTPA",
        "Pneumothorax: sudden sharp pain; absent breath sounds; CXR",
        "Pleuritis / Pneumonia: pleuritic, positional; fever, cough",
        "Pulmonary hypertension: exertional pain, right heart strain"]),
    ("VASCULAR", RED, [
        "Aortic Dissection: tearing, migratory pain (chest→back); BP differential >20 mmHg",
        "CT angiography is gold standard; CXR may show wide mediastinum",
        "Avoid thrombolytics until dissection excluded",
        "Type A → emergent surgery; Type B → medical management"]),
    ("GASTROINTESTINAL", ORANGE, [
        "GERD/oesophagitis: burning, worse postprandially, relieved by antacids",
        "Oesophageal spasm: can mimic angina; responds to nitrates",
        "Peptic ulcer disease: epigastric, post-prandial",
        "Boerhaave's syndrome: rupture after vomiting; surgical emergency"]),
    ("MUSCULOSKELETAL", GREEN, [
        "Costochondritis (Tietze's): reproducible tenderness at costochondral junctions",
        "Rib fractures: trauma history; point tenderness",
        "Herpes zoster: dermatomal distribution, vesicular rash",
        "Fibromyalgia: diffuse MSK pain"]),
    ("PSYCHIATRIC", MID_NAVY, [
        "Panic disorder: palpitations, hyperventilation, paresthesias",
        "Anxiety: must diagnose by exclusion",
        "Diagnosis of exclusion — rule out organic causes first",
        ""]),
    ("PERICARDIAL", RGBColor(0x7B, 0x1F, 0xA2), [
        "Pericarditis: pleuritic, positional pain; worse lying flat",
        "ECG: diffuse saddle-shaped ST elevation, PR depression",
        "Pericardial rub on auscultation",
        "NSAIDs + colchicine first line"]),
]
positions = [(0.3,1.15),(4.6,1.15),(9.0,1.15),(0.3,4.3),(4.6,4.3),(9.0,4.3)]
for (i, (title, col, items)), (px, py) in zip(enumerate(categories), positions):
    add_rect(sl, Inches(px), Inches(py), Inches(4.1), Inches(0.42), col)
    add_text(sl, title, Inches(px), Inches(py), Inches(4.1), Inches(0.42),
             font_size=13, bold=True, color=WHITE, align=PP_ALIGN.CENTER, v_anchor=MSO_ANCHOR.MIDDLE)
    add_bullet_box(sl, items, Inches(px), Inches(py+0.45), Inches(4.1), Inches(2.7),
                   bg=RGBColor(0xF0, 0xF4, 0xFF), bullet_color=GRAY_TEXT, font_size=11.5)

# ══════════════════════════════════════════════════════════════
# SLIDE 9 — ECG BASICS IN CHEST PAIN
# ══════════════════════════════════════════════════════════════
sl = prs.slides.add_slide(blank)
add_rect(sl, 0, 0, W, H, RGBColor(0xFB, 0xFB, 0xFF))
add_rect(sl, 0, 0, W, Inches(1.05), MID_NAVY)
add_text(sl, "ECG Basics in Chest Pain", Inches(0.5), Inches(0.1), Inches(11), Inches(0.85),
         font_size=30, bold=True, color=WHITE)
add_text(sl, "Rosen's EM 9e, Ch. 64 — Table 64.3", Inches(10.3), Inches(0.1), Inches(2.8), Inches(0.85),
         font_size=11, color=GOLD, align=PP_ALIGN.RIGHT, italic=True)

# Left panel — ECG changes
add_bullet_box(sl,
    ["Perform within 10 minutes of arrival",
     "Obtain right-sided leads (V3R–V4R) for RV infarct if inferior STEMI",
     "Posterior leads (V7–V9) for posterior MI",
     "Repeat ECG every 15–30 min if symptoms persist with initial normal ECG"],
    Inches(0.3), Inches(1.15), Inches(4.5), Inches(2.1),
    title="ECG Protocol", title_color=MID_NAVY, bg=RGBColor(0xE8, 0xEE, 0xFF),
    bullet_color=GRAY_TEXT, font_size=13)

ecg_findings = [
    ("Hyperacute T-waves", "Tall, peaked T-waves;\nEARLIEST STEMI sign;\nminutes after occlusion"),
    ("ST Elevation (STE)", "≥1 mm in ≥2 contiguous\nleads; convex (tombstone)\nor flat upstroke"),
    ("Reciprocal Changes", "ST depression in\nopposite leads;\nincreases STEMI specificity"),
    ("Pathological Q-waves", "≥1/3 QRS height or\n≥40 ms wide;\nindicates necrosis"),
    ("T-wave Inversions", "Subacute/chronic ischaemia;\nde Winter T-waves\n= LAD occlusion equivalent"),
    ("New LBBB", "STEMI-equivalent;\nSgarbossa criteria\nfor diagnosis"),
]
for i, (name, desc) in enumerate(ecg_findings):
    row, col_n = divmod(i, 3)
    bx = Inches(0.3) + col_n * Inches(2.05)
    by = Inches(3.35) + row * Inches(1.25)
    add_rect(sl, bx, by, Inches(1.95), Inches(0.4), MID_NAVY)
    add_text(sl, name, bx, by, Inches(1.95), Inches(0.4),
             font_size=12, bold=True, color=WHITE, align=PP_ALIGN.CENTER, v_anchor=MSO_ANCHOR.MIDDLE)
    add_rect(sl, bx, by+Inches(0.4), Inches(1.95), Inches(0.8), RGBColor(0xEE, 0xF4, 0xFF))
    add_text(sl, desc, bx+Inches(0.05), by+Inches(0.4), Inches(1.85), Inches(0.8),
             font_size=11, color=GRAY_TEXT)

# ECG image
ok = add_image_from_url(sl,
    "https://cdn.orris.care/cdss_images/pmc_clinical_VQA_cdfb20f9fc1a8412ffb27a5e6e1ae510547606f1b0c520ad6dc5bda4ec26caeb.jpg",
    Inches(4.95), Inches(1.15), Inches(4.0), Inches(4.8))
if not ok:
    add_rect(sl, Inches(4.95), Inches(1.15), Inches(4.0), Inches(4.8), RGBColor(0xDD, 0xEE, 0xFF))
    add_text(sl, "STEMI ECG\nAnterolateral", Inches(4.95), Inches(1.15), Inches(4.0), Inches(4.8),
             font_size=13, color=MID_NAVY, align=PP_ALIGN.CENTER, v_anchor=MSO_ANCHOR.MIDDLE)
add_text(sl, "Anterolateral STEMI: STE V1–V6, I, aVL; reciprocal inferior changes",
         Inches(4.95), Inches(6.0), Inches(4.0), Inches(0.45),
         font_size=10, color=GRAY_TEXT, italic=True)

# Right panel
add_bullet_box(sl,
    ["Pericarditis: diffuse saddle-shaped STE + PR depression in II",
     "Hyperkalaemia: peaked T, wide QRS, sine wave",
     "Benign early repolarisation: concave STE V2–V5, notched J-point",
     "LVH: Sokolow-Lyon criteria; repolarisation abnormality",
     "LBBB: ST depression V1–V3 (expected, not ischaemia)",
     "Wellens syndrome: Type A (biphasic) or B (deep inverted) T-waves V2–V3 = LAD critical stenosis"],
    Inches(9.1), Inches(1.15), Inches(4.0), Inches(4.6),
    title="STEMI Mimics (Rosen's Table 64.3)", title_color=DARK_NAVY,
    bg=RGBColor(0xE8, 0xED, 0xFF), bullet_color=GRAY_TEXT, font_size=12)

# ══════════════════════════════════════════════════════════════
# SLIDE 10 — FIRST-HOUR MANAGEMENT (STEMI)
# ══════════════════════════════════════════════════════════════
sl = prs.slides.add_slide(blank)
add_rect(sl, 0, 0, W, H, RGBColor(0xFF, 0xF8, 0xF8))
add_rect(sl, 0, 0, W, Inches(1.05), RED)
add_text(sl, "First-Hour Management — STEMI", Inches(0.5), Inches(0.1), Inches(10.5), Inches(0.85),
         font_size=28, bold=True, color=WHITE)
add_text(sl, "Tintinalli 11e | Rosen's 9e", Inches(11.0), Inches(0.1), Inches(2.1), Inches(0.85),
         font_size=11, color=GOLD, align=PP_ALIGN.RIGHT, italic=True)

# Timeline
timeline_steps = [
    ("0–10 min", "Triage &\nInitial", [
        "12-lead ECG (< 10 min)",
        "IV access × 2",
        "Cardiac monitor + SpO₂",
        "CXR (portable)",
        "Aspirin 300 mg chewable",
        "IV morphine if pain"]),
    ("10–30 min", "STEMI\nActivation", [
        "Activate cath lab (call code)",
        "P2Y12 inhibitor (ticagrelor\n  180 mg or clopidogrel 600 mg)",
        "Anticoagulation (UFH bolus\n  60–70 U/kg IV)",
        "Beta-blocker (oral if HR>60\n  and BP>100)",
        "Statin (atorvastatin 80 mg)"]),
    ("30–90 min", "Reperfusion\nDecision", [
        "Primary PCI within 90 min\n  (Door-to-Balloon time)",
        "If PCI not available: thrombolysis\n  within 30 min (D2N time)",
        "Transfer if PCI centre within 120 min",
        "IV heparin infusion",
        "Continuous monitoring"]),
    ("After\nReperfusion", "Post-PCI\nCare", [
        "Dual antiplatelet (DAPT)\n  for ≥12 months",
        "ACE inhibitor / ARB",
        "High-intensity statin",
        "Beta-blocker (if EF <40%)",
        "Aldosterone antagonist\n  (if EF <40%, no renal failure)"]),
]
col_colors = [TEAL, ORANGE, RED, GREEN]
for i, (time, label, steps) in enumerate(timeline_steps):
    sx = Inches(0.3) + i * Inches(3.25)
    add_rect(sl, sx, Inches(1.15), Inches(3.0), Inches(0.5), col_colors[i])
    add_text(sl, time, sx, Inches(1.15), Inches(1.3), Inches(0.5),
             font_size=13, bold=True, color=WHITE, align=PP_ALIGN.CENTER, v_anchor=MSO_ANCHOR.MIDDLE)
    add_text(sl, label, sx+Inches(1.32), Inches(1.15), Inches(1.65), Inches(0.5),
             font_size=12, bold=True, color=WHITE, align=PP_ALIGN.CENTER, v_anchor=MSO_ANCHOR.MIDDLE)
    add_rect(sl, sx, Inches(1.68), Inches(3.0), Inches(5.55), RGBColor(0xF5, 0xF8, 0xFF))
    add_bullet_box(sl, steps, sx, Inches(1.68), Inches(3.0), Inches(5.55),
                   bg=None, bullet_color=GRAY_TEXT, font_size=12)
    # connector arrows
    if i < 3:
        add_text(sl, "▶", sx + Inches(3.05), Inches(1.3), Inches(0.3), Inches(0.4),
                 font_size=20, color=col_colors[i])

# Thrombolysis box
add_rect(sl, Inches(0.3), Inches(7.0), Inches(12.7), Inches(0.38), DARK_NAVY)
add_text(sl,
    "THROMBOLYSIS (if PCI unavailable): Alteplase (tPA) | Streptokinase | Tenecteplase  —  "
    "CONTRAINDICATIONS: prior haemorrhagic stroke, active bleeding, recent surgery, uncontrolled HTN",
    Inches(0.3), Inches(7.0), Inches(12.7), Inches(0.38),
    font_size=11, color=WHITE, align=PP_ALIGN.CENTER, v_anchor=MSO_ANCHOR.MIDDLE)

# ══════════════════════════════════════════════════════════════
# SLIDE 11 — RISK SCORES & DISPOSITION
# ══════════════════════════════════════════════════════════════
sl = prs.slides.add_slide(blank)
add_rect(sl, 0, 0, W, H, RGBColor(0xF4, 0xF6, 0xFF))
add_rect(sl, 0, 0, W, Inches(1.05), RGBColor(0x2C, 0x5F, 0x2E))
add_text(sl, "Risk Scores & ED Disposition", Inches(0.5), Inches(0.1), Inches(11), Inches(0.85),
         font_size=28, bold=True, color=WHITE)
add_text(sl, "Rosen's EM 9e, Ch. 64", Inches(11.0), Inches(0.1), Inches(2.1), Inches(0.85),
         font_size=11, color=GOLD, align=PP_ALIGN.RIGHT, italic=True)

# HEART Score
add_rect(sl, Inches(0.3), Inches(1.15), Inches(6.2), Inches(0.48), RGBColor(0x2C, 0x5F, 0x2E))
add_text(sl, "HEART Score", Inches(0.3), Inches(1.15), Inches(6.2), Inches(0.48),
         font_size=16, bold=True, color=WHITE, align=PP_ALIGN.CENTER, v_anchor=MSO_ANCHOR.MIDDLE)
heart_rows = [
    ("H", "History", "Highly suspicious=2, Moderately=1, Slightly=0"),
    ("E", "ECG", "Significant changes=2, Non-specific=1, Normal=0"),
    ("A", "Age", "≥65y=2, 45–64y=1, <45y=0"),
    ("R", "Risk Factors", "≥3 or Hx of atherosclerosis=2, 1–2=1, None=0"),
    ("T", "Troponin", ">3× normal=2, 1–3×=1, ≤normal=0"),
]
for ri, (let, var, desc) in enumerate(heart_rows):
    ry = Inches(1.65) + ri * Inches(0.42)
    bg_c = RGBColor(0xF0, 0xFB, 0xF2) if ri%2==0 else WHITE
    add_rect(sl, Inches(0.3), ry, Inches(6.2), Inches(0.42), bg_c)
    add_text(sl, let, Inches(0.35), ry, Inches(0.4), Inches(0.42),
             font_size=15, bold=True, color=RGBColor(0x2C, 0x5F, 0x2E), v_anchor=MSO_ANCHOR.MIDDLE)
    add_text(sl, var, Inches(0.8), ry, Inches(1.1), Inches(0.42),
             font_size=13, bold=True, color=GRAY_TEXT, v_anchor=MSO_ANCHOR.MIDDLE)
    add_text(sl, desc, Inches(1.95), ry, Inches(4.5), Inches(0.42),
             font_size=12, color=GRAY_TEXT, v_anchor=MSO_ANCHOR.MIDDLE)

# HEART Risk stratification
add_rect(sl, Inches(0.3), Inches(3.82), Inches(6.2), Inches(0.42), DARK_NAVY)
add_text(sl, "Risk Stratification", Inches(0.3), Inches(3.82), Inches(6.2), Inches(0.42),
         font_size=14, bold=True, color=WHITE, align=PP_ALIGN.CENTER, v_anchor=MSO_ANCHOR.MIDDLE)
risk_data = [
    ("Low (0–3)", "MACE 1.7%", "Safe discharge, outpatient follow-up", GREEN),
    ("Intermediate (4–6)", "MACE 12–17%", "Observe, stress test/CT angio", ORANGE),
    ("High (7–10)", "MACE 50–65%", "Admit, early invasive strategy", RED),
]
for ri, (score, mace, action, col) in enumerate(risk_data):
    ry = Inches(4.26) + ri * Inches(0.46)
    add_rect(sl, Inches(0.3), ry, Inches(6.2), Inches(0.46), RGBColor(0xF8,0xF8,0xF8))
    add_rect(sl, Inches(0.3), ry, Inches(1.6), Inches(0.46), col)
    add_text(sl, score, Inches(0.3), ry, Inches(1.6), Inches(0.46),
             font_size=12, bold=True, color=WHITE, align=PP_ALIGN.CENTER, v_anchor=MSO_ANCHOR.MIDDLE)
    add_text(sl, mace, Inches(1.95), ry, Inches(1.4), Inches(0.46),
             font_size=12, bold=True, color=col, v_anchor=MSO_ANCHOR.MIDDLE)
    add_text(sl, action, Inches(3.4), ry, Inches(3.05), Inches(0.46),
             font_size=12, color=GRAY_TEXT, v_anchor=MSO_ANCHOR.MIDDLE)

# GRACE Score
add_rect(sl, Inches(6.7), Inches(1.15), Inches(6.0), Inches(0.48), MID_NAVY)
add_text(sl, "GRACE Score (STEMI/NSTEMI Mortality Prediction)", Inches(6.7), Inches(1.15), Inches(6.0), Inches(0.48),
         font_size=14, bold=True, color=WHITE, align=PP_ALIGN.CENTER, v_anchor=MSO_ANCHOR.MIDDLE)
grace_items = [
    "Variables: Age, HR, SBP, creatinine, Killip class,",
    "  cardiac arrest on admission, ST deviation, troponin",
    "Low (<108): in-hospital mortality <1%",
    "Intermediate (109–140): mortality 1–3%",
    "High (>140): mortality >3% → early invasive strategy",
    "Validated in STEMI and NSTEMI populations",
    "Endorsed by ACC/AHA and ESC guidelines",
]
add_bullet_box(sl, grace_items, Inches(6.7), Inches(1.65), Inches(6.0), Inches(2.1),
               bg=RGBColor(0xE8, 0xEE, 0xFF), bullet_color=GRAY_TEXT, font_size=13)

# Troponin 0h/1h algorithm
add_rect(sl, Inches(6.7), Inches(3.85), Inches(6.0), Inches(0.48), TEAL)
add_text(sl, "hs-Troponin 0h/1h Algorithm (ESC 2020)", Inches(6.7), Inches(3.85), Inches(6.0), Inches(0.48),
         font_size=14, bold=True, color=WHITE, align=PP_ALIGN.CENTER, v_anchor=MSO_ANCHOR.MIDDLE)
troponin_items = [
    "0h hs-cTnT <5 ng/L AND 1h delta <3 ng/L → Rule OUT (99% NPV)",
    "0h hs-cTnT ≥52 ng/L OR 1h delta ≥6 ng/L → Rule IN (NSTEMI)",
    "Intermediate zone → 3-hour sample required",
    "Site-specific assay values must be used",
    "Delta = absolute change between 0h and 1h values",
    "0h/3h algorithm: alternative with 2 measurements",
]
add_bullet_box(sl, troponin_items, Inches(6.7), Inches(4.35), Inches(6.0), Inches(2.5),
               bg=RGBColor(0xE0, 0xF7, 0xFA), bullet_color=GRAY_TEXT, font_size=13)

# ══════════════════════════════════════════════════════════════
# SLIDE 12 — SUMMARY
# ══════════════════════════════════════════════════════════════
sl = prs.slides.add_slide(blank)
add_rect(sl, 0, 0, W, H, DARK_NAVY)
add_rect(sl, 0, 0, W, Inches(0.18), RED)
add_rect(sl, 0, H - Inches(0.18), W, Inches(0.18), GOLD)
add_text(sl, "Key Takeaways", Inches(0.5), Inches(0.25), Inches(12), Inches(0.9),
         font_size=34, bold=True, color=WHITE, align=PP_ALIGN.CENTER)
divider_line(sl, Inches(1.18), GOLD)

key_points = [
    ("1", "ECG within 10 min — must be the FIRST test for every chest pain patient", RED),
    ("2", "STEMI = ST elevation ≥1 mm in ≥2 contiguous leads (or new LBBB): activate cath lab immediately", ORANGE),
    ("3", "NSTEMI/UA distinction: troponin rise. Both require antiplatelet + anticoagulation + risk stratification", GOLD),
    ("4", "Normal ECG and troponin at 0h do NOT exclude ACS — serial testing is mandatory", TEAL),
    ("5", "Life-threatening mimics: aortic dissection, PE, tension pneumothorax — consider before thrombolytics", GREEN),
    ("6", "HEART Score 0–3: safe discharge. 7–10: admit + early invasive strategy. GRACE predicts mortality", RGBColor(0xAA, 0x80, 0xFF)),
    ("7", "Primary PCI (D2B ≤90 min) is gold standard reperfusion; thrombolysis if PCI unavailable (D2N ≤30 min)", RGBColor(0xFF, 0x80, 0x80)),
]
for i, (num, pt, col) in enumerate(key_points):
    gy = Inches(1.38) + i * Inches(0.75)
    add_rect(sl, Inches(0.4), gy, Inches(0.52), Inches(0.58), col)
    add_text(sl, num, Inches(0.4), gy, Inches(0.52), Inches(0.58),
             font_size=18, bold=True, color=WHITE, align=PP_ALIGN.CENTER, v_anchor=MSO_ANCHOR.MIDDLE)
    add_text(sl, pt, Inches(1.05), gy + Inches(0.04), Inches(11.9), Inches(0.55),
             font_size=16, color=WHITE, v_anchor=MSO_ANCHOR.MIDDLE)

add_text(sl,
    "Sources: Rosen's Emergency Medicine 9th Ed. (Ch. 64) | Tintinalli's Emergency Medicine 11th Ed.",
    Inches(0.4), H - Inches(0.55), Inches(12.5), Inches(0.4),
    font_size=12, color=GOLD, align=PP_ALIGN.CENTER, italic=True)

# ══ SAVE ══════════════════════════════════════════════════════
out_path = "/tmp/workspace/acute-chest-pain-ppt/Acute_Chest_Pain_EM.pptx"
prs.save(out_path)
print(f"Saved: {out_path}")
print(f"Slides: {len(prs.slides)}")
cd /tmp/workspace/acute-chest-pain-ppt && python build_ppt.py 2>&1
requests-based download.cd /tmp/workspace/acute-chest-pain-ppt && python -c " import requests, base64 from io import BytesIO from pptx import Presentation from pptx.util import Inches # Test image download url = 'https://cdn.orris.care/cdss_images/pmc_clinical_VQA_16738d4b125195130b5e53a811645d4064182fc2bbd0de16b0e00a57af7ff6ef.jpg' r = requests.get(url, timeout=20) print('Status:', r.status_code, 'Size:', len(r.content)) "
requests instead of the helper script, and rebuild.~/acute-chest-pain-ppt/build_ppt.py
Successfully replaced 1 instance(s) of the string in '/tmp/workspace/acute-chest-pain-ppt/build_ppt.py'
cd /tmp/workspace/acute-chest-pain-ppt && python build_ppt.py 2>&1
ls -lh /tmp/workspace/acute-chest-pain-ppt/Acute_Chest_Pain_EM.pptx && python -c " from pptx import Presentation prs = Presentation('/tmp/workspace/acute-chest-pain-ppt/Acute_Chest_Pain_EM.pptx') for i, slide in enumerate(prs.slides, 1): texts = [s.text_frame.paragraphs[0].runs[0].text[:50] if s.has_text_frame and s.text_frame.paragraphs and s.text_frame.paragraphs[0].runs else '' for s in slide.shapes] title = next((t for t in texts if t.strip()), '[no text]') imgs = sum(1 for s in slide.shapes if s.shape_type == 13) print(f'Slide {i:2d}: {title[:55]:<55} | images={imgs}') "
Acute Chest Pain EM
Presentation · PPTX
What's Inside — 12-Slide Deck
| Slide | Title | Highlights |
|---|---|---|
| 1 | Title Slide | Dark navy design, gold accents, both textbook references |
| 2 | Table of Contents | 7 colour-coded sections with descriptors |
| 3 | Approach to Acute Chest Pain | Epidemiology, history pearls, MONA protocol, life-threatening differentials |
| 4 | ACS Pathophysiology | Plaque → Rupture → Thrombus → Ischaemia flow; full ACS spectrum table (Stable/UA/NSTEMI/STEMI) + embedded pathology image |
| 5 | STEMI — Features & Diagnosis | Clinical presentation, Killip class, STEMI localisation table (all 6 territories + coronary arteries), complications, real 12-lead STEMI ECG image |
| 6 | NSTEMI & Unstable Angina | UA vs NSTEMI comparison columns, TIMI risk score, NSTEMI management checklist |
| 7 | Angina Pectoris | Three-column: Stable / Unstable / Variant (Prinzmetal's); CCS grading footer |
| 8 | Non-Cardiac Causes | 6-panel grid: Pulmonary, Vascular (dissection), GI, MSK, Psychiatric, Pericarditis |
| 9 | ECG Basics in Chest Pain | 6 key ECG changes, STEMI mimics (Wellens, de Winter, LBBB), real anterolateral STEMI ECG image |
| 10 | First-Hour Management (STEMI) | 4-column timeline: 0–10 / 10–30 / 30–90 min / post-PCI; thrombolysis contraindications |
| 11 | Risk Scores & Disposition | HEART score table, 3-tier risk/MACE rates, GRACE score, hs-cTn 0h/1h algorithm |
| 12 | Key Takeaways | 7 numbered pearls from Rosen's & Tintinalli |