

Analyse this ecg. Find for lvh criteria
left ventricular hypertrophy ECG criteria voltage Sokolow-Lyon
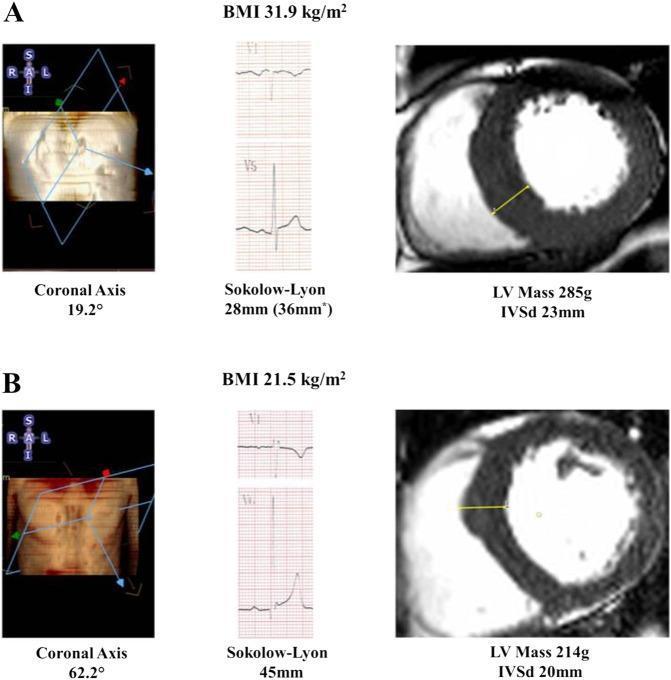
This comparison chart illustrates the impact of Body Mass Index (BMI) and anatomical heart orientation on the diagnostic accuracy of electrocardiogram (ECG) voltage criteria for left ventricular hypertrophy (LVH). The image presents two clinical cases (A and B) featuring three components: a coronal axis scout image, ECG tracings (leads V1 and V5), and cardiac magnetic resonance (CMR) short-axis views. Case A (BMI 31.9 kg/m²) demonstrates a leftward-deviated coronal axis of 19.2°, resulting in a falsely negative Sokolow-Lyon voltage (28mm) despite a high LV mass (285g) and thickened intraventricular septum (IVSd 23mm) on CMR. Case B (BMI 21.5 kg/m²) shows a more vertical coronal axis of 62.2° with a positive Sokolow-Lyon voltage (45mm) and a lower LV mass (214g). The diagram highlights how obesity-related anatomical shifts and increased chest wall distance can attenuate ECG surface voltages, potentially masking pathological hypertrophy. Key educational concepts include the correlation between thoracic anatomy, BMI, and the sensitivity of Sokolow-Lyon criteria in detecting CMR-verified LVH.
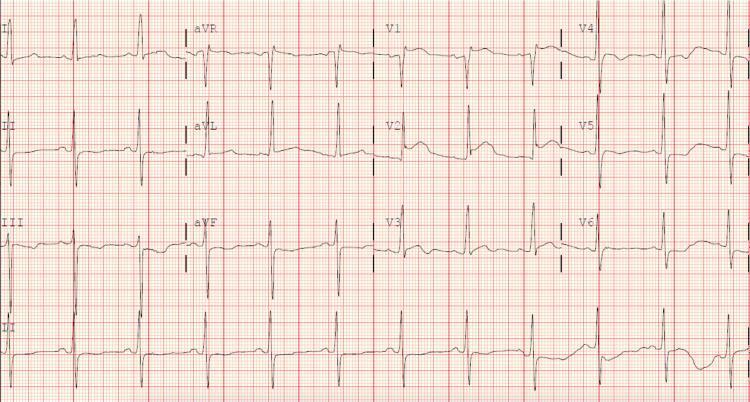
A 12-lead electrocardiogram (ECG) tracing recorded on a standard grid. The rhythm is a regular sinus rhythm, evidenced by uniform P waves preceding every narrow QRS complex. The tracing primarily demonstrates voltage criteria for left ventricular hypertrophy (LVH). Key findings include a prominent R-wave amplitude in lead aVL, which exceeds 12 mm, fulfilling the Modified Cornell Criteria. In the precordial leads, V1 displays a deep S-wave deflection, while leads V5 and V6 show relatively high-amplitude R-waves; however, the sum of S in V1 and R in V5/V6 does not meet the 35 mm threshold for the Sokolow-Lyon criteria. The ST segments are generally isoelectric, and T-waves are upright in the lateral leads without evidence of acute ischemic changes or classic 'strain' patterns. This diagnostic image serves as an educational example of how different LVH voltage criteria (Modified Cornell vs. Sokolow-Lyon) can yield discordant results in the same patient.
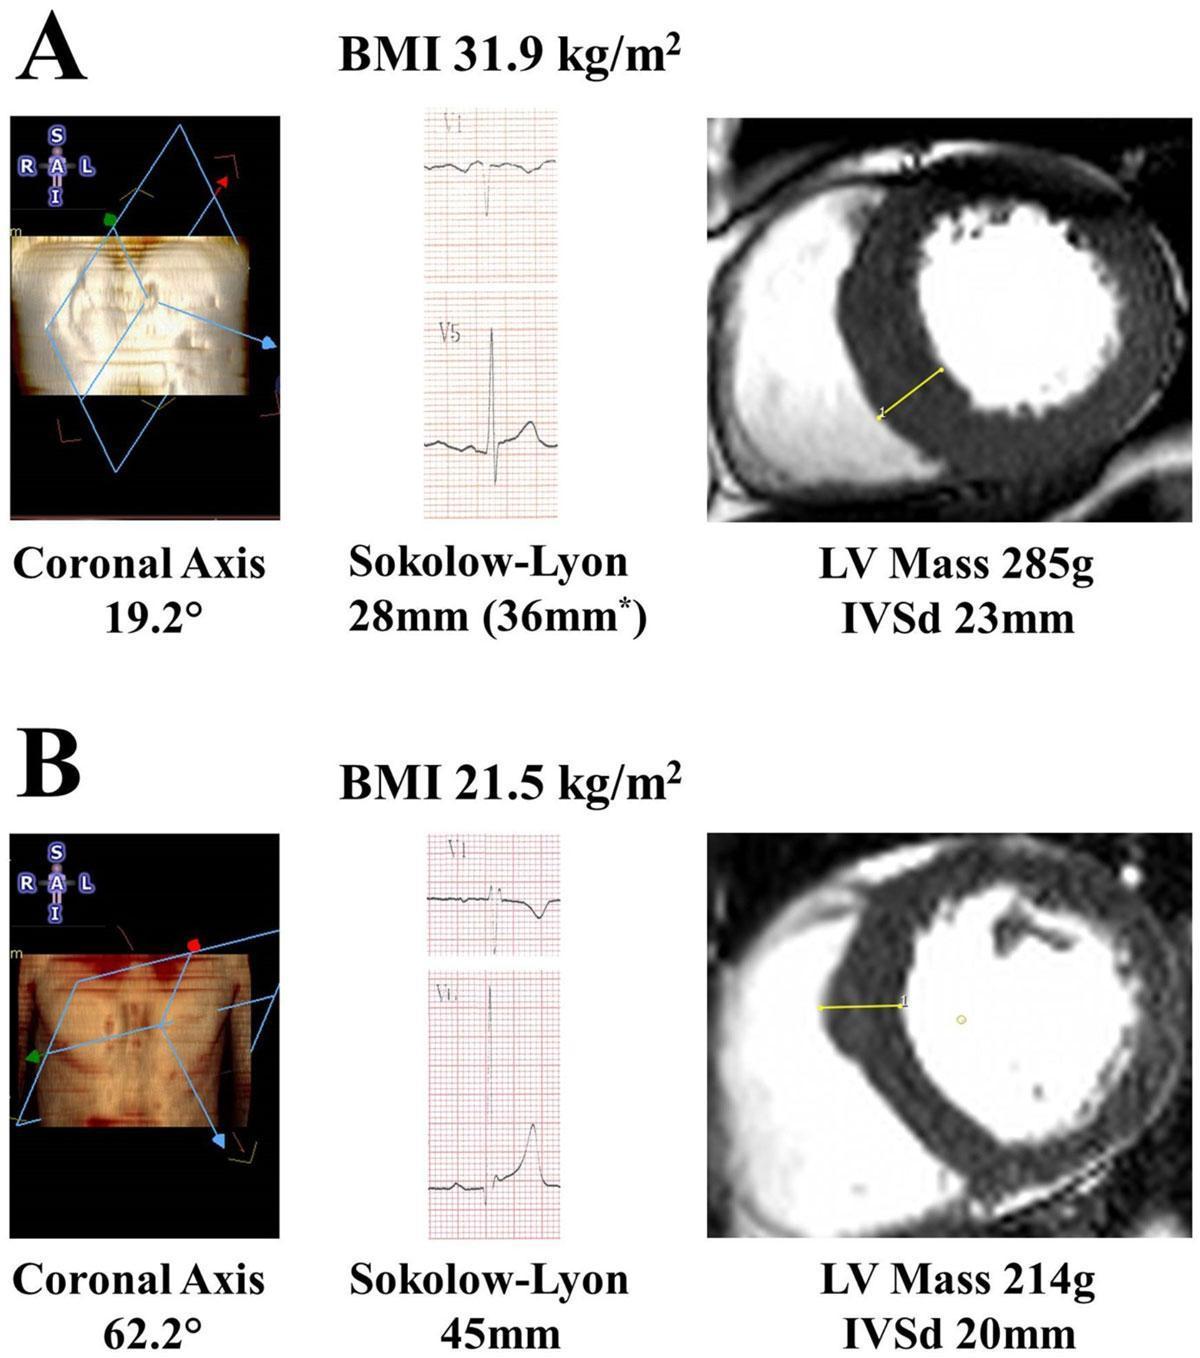
This comparative medical illustration demonstrates the impact of body mass index (BMI) and anatomical orientation on electrocardiogram (ECG) voltage criteria for left ventricular hypertrophy (LVH). The figure compares two subjects (A and B) using a combination of three modalities: torso geometry diagrams, surface ECG leads (V1 and V5), and cardiac MRI short-axis views. Subject A (obese, BMI 31.9 kg/m²) shows a higher left ventricular (LV) mass (285g) and interventricular septal diastolic thickness (IVSd 23mm) on MRI, yet displays lower Sokolow-Lyon voltage (28mm) on ECG. This is contrasted with Subject B (normal weight, BMI 21.5 kg/m²), who has a lower LV mass (214g) but a significantly higher Sokolow-Lyon voltage (45mm). The anatomical diagrams illustrate a difference in the coronal axis (19.2° vs 62.2°), highlighting how torso habitus and cardiac orientation can attenuate electrical signals measured at the skin surface. The image serves as an educational tool for cardiology and radiology, emphasizing that anatomical factors and obesity can reduce the diagnostic sensitivity of standard surface ECG criteria despite the presence of significant structural hypertrophy.
ECG Analysis - LVH Criteria Assessment
Basic Parameters (from ECG header)
| Parameter | Value |
|---|---|
| Ventricular Rate | 105 bpm |
| PR Interval | 122 ms |
| QRS Duration | 80 ms |
| QT / QTc (Hodges) | 344 / 423 ms |
| P/QRS/T Axes | 85° / 5° / 22° |
| Machine Interpretation | Sinus tachycardia, ST junctional depression nonspecific, Borderline ECG |
Rhythm & Basic Analysis
- Rhythm: Sinus tachycardia at 105 bpm
- QRS axis: +5° (leftward - borderline left axis)
- QRS duration: 80 ms - narrow, no bundle branch block
- QTc: 423 ms - borderline prolonged but within acceptable limits
LVH Criteria - Systematic Evaluation
1. Sokolow-Lyon Voltage Criterion
- S wave in V1: ~10-12 mm
- R wave in V5: ~4-5 mm (low amplitude - V5 R waves appear modest)
- R wave in V6: ~5-6 mm
- Sum (S V1 + R V5): approximately 14-17 mm
2. Cornell Voltage Criteria
- Males: > 28 mm
- Females: > 20 mm
- R in aVL: ~4-6 mm (modest amplitude)
- S in V3: ~5-8 mm
3. aVL Voltage Alone
- R in aVL ≥ 11 mm (women) or ≥ 12 mm (men) = LVH
- Observed R in aVL: approximately 4-6 mm
- NEGATIVE
4. Limb Lead Criteria (Romhilt-Estes-related)
- R in aVF > 20 mm: Not met - aVF R waves appear small (~3-4 mm)
- Tallest R or S in limb leads ≥ 20 mm: Not clearly met
5. Romhilt-Estes Point Score System
| Criterion | Points | Present? |
|---|---|---|
| Voltage: R or S in limb leads ≥ 20 mm, or S V1/V2 ≥ 30 mm, or R V5/V6 ≥ 30 mm | 3 | No |
| ST-T strain pattern (no digitalis) | 3 | Possibly - machine noted nonspecific ST junctional depression |
| Left atrial enlargement (V1 terminal P ≥ 1 mm deep, ≥ 0.04 s) | 3 | Not clearly seen |
| Left axis deviation ≥ -30° | 2 | No - axis is +5° |
| QRS duration ≥ 0.09 s | 1 | No - QRS is 80 ms |
| Intrinsicoid deflection V5/V6 ≥ 0.05 s | 1 | Not assessed |
6. Other LVH Voltage Markers
- S V1 + R V5 or V6 > 35 mm (Sokolow-Lyon): ~14-17 mm - NOT MET
- R V5 or V6 ≥ 26 mm: R waves in V5/V6 appear ~4-5 mm - NOT MET
- R + S in any precordial lead ≥ 45 mm: Not met
Key Observation: Why LVH Voltage Is LOW Here
- No LVH present - most likely in context of low precordial voltages
- Obesity - increases chest wall distance, attenuating ECG surface voltages (well-documented false-negative effect)
- COPD/emphysema - causes low voltage and poor R-wave progression
- Pericardial effusion - can reduce all voltages
- The tachycardia itself may be a physiological response to an underlying cause
ST-T Changes
- Machine reports ST junctional depression (nonspecific) - could represent rate-related changes from tachycardia, rather than LVH strain pattern
- The classic LVH "strain pattern" (asymmetric ST depression + T wave inversion in I, aVL, V5-V6) is not clearly identified on this tracing
Summary Conclusion
| LVH Criterion | Threshold | Estimated Value | Met? |
|---|---|---|---|
| Sokolow-Lyon (S V1 + R V5/V6) | ≥ 35 mm | ~14-17 mm | ❌ No |
| Cornell (R aVL + S V3) males | > 28 mm | ~9-14 mm | ❌ No |
| Cornell (R aVL + S V3) females | > 20 mm | ~9-14 mm | ❌ No |
| R aVL alone | ≥ 11-12 mm | ~4-6 mm | ❌ No |
| R V5/V6 alone | ≥ 26 mm | ~4-5 mm | ❌ No |
| LVH strain pattern | ST-T changes in lateral leads | Nonspecific only | ❌ No |
| Romhilt-Estes | ≥ 5 points definite | ~0-3 points | ❌ No |
The V2 S waves looks deep
Revised Sokolow-Lyon Using V2 (Not V1)
Re-measurement with V2 S wave
| Measurement | Estimated Value |
|---|---|
| S wave in V1 | ~10-12 mm |
| S wave in V2 | ~20-25 mm (notably deep, as you've identified) |
| R wave in V5 | ~4-6 mm |
| R wave in V6 | ~4-5 mm |
Sokolow-Lyon using S V2 + R V5:
Why This Matters
- Deep S in V1/V2 but small R in V5/V6 can occur with poor R-wave progression
- This could reflect clockwise rotation of the heart, anterior forces being diminished, or a patient with a horizontal/obese body habitus
- It does not exclude LVH definitively - remember ECG has only ~25-50% sensitivity for true LVH
Updated Verdict
| Criterion | Revised Estimate | Met? |
|---|---|---|
| Sokolow-Lyon (S V1 + R V5) | ~14-18 mm | ❌ |
| Sokolow-Lyon (S V2 + R V5) | ~24-31 mm | Borderline / unlikely |
| Cornell (R aVL + S V3) | ~9-14 mm | ❌ |