
I am a final year medical student and I have to present PPT in internal medicine. So based on the PDF I have uploaded, my topic for presentation is describe the etiology, clinical manifestation, diagnosis and clinical approach to primary hyperparathyroidism. So create a slide using the PDF I have uploaded and also use the content from standard textbook like Harrison, Macleod's and Davidson. Slide should be minimum 35 to 40 slides. Add the topic in the first slide and in second slide add learning objectives and for each clinical manifestations and investigation and all add more and more pictures. Make the PPT in such a way that it is made by student. Use basic template. Please make sure the PPT is look like student made not AI generated. And give it in PDF and PPTX form. Also, I had anatomy and physiology of parathyroid gland in the starting few slides.
I don't see any PDF attachment in your message. Could you please share the PDF you'd like me to use as the base content?
parathyroid gland anatomy location
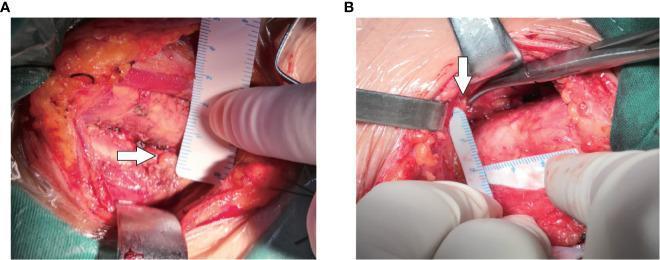
Two intraoperative clinical photographs (A and B) demonstrating the identification and spatial measurement of the inferior parathyroid gland (IPG) during neck surgery. In both panels, a white arrow points to the IPG, which appears as a small, yellowish-tan, oval structure nestled within the surgical field. The surrounding anatomy includes reddish striated muscle fibers, thyroid tissue, and yellowish adipose tissue. A sterile millimeter ruler is visible in both images, held by a gloved hand to measure the distance between the IPG and fixed anatomical landmarks, such as the trachea or cricoid cartilage. Surgical instruments, including a retractor and fine forceps, are utilized to expose the site and maintain a clear view of the IPG's location. This visual demonstrates the clinical application of preoperative ultrasound coordinates to accurately locate parathyroid glands intraoperatively, facilitating safe dissection and preservation of the gland.
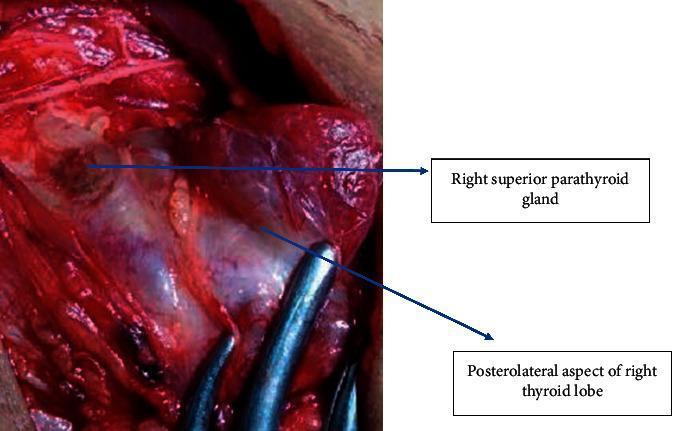
This clinical photograph captures an intraoperative view during a thyroidectomy, specifically highlighting the surgical identification of the parathyroid glands. The image focuses on the right surgical field where the right thyroid lobe is being retracted medially and anteriorly using surgical forceps. Labeled in the upper portion of the field is the right superior parathyroid gland, which presents as a small, ovoid, reddish-brown structure. It is situated on the posterolateral aspect of the right thyroid lobe, demonstrating its characteristic anatomical location superior to the entry of the inferior thyroid artery and posterior to the recurrent laryngeal nerve's expected course. The surrounding tissue shows rich vascularization and connective tissue planes typical of the neck's central compartment. This visual serves as a critical educational resource for endocrine surgeons and medical students to understand the delicate anatomy and visual cues—such as color and texture—required to identify and preserve parathyroid glands during thyroid surgery to prevent postoperative hypocalcemia.
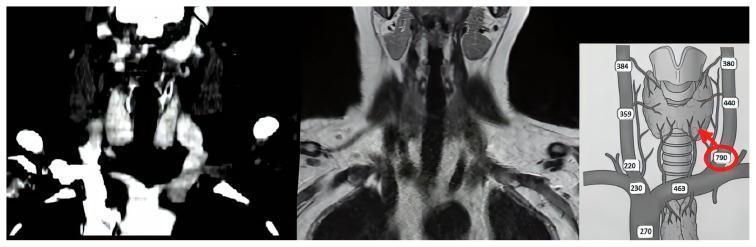
A multi-panel medical image comparing radiological modalities and physiological data for parathyroid localization. The left panel shows a coronal CT scan of the neck and upper thorax with intravenous contrast, highlighting vascular structures and bony landmarks in high-density white. The center panel displays a corresponding coronal MRI scan, offering superior soft-tissue contrast for the differentiation of cervical musculature, the thyroid gland, and neurovascular bundles. The right panel is a schematic diagram illustrating the selective venous sampling (SVS) procedure. It depicts the venous anatomy of the neck, including the internal jugular, brachiocephalic, and thyroid veins, overlaid on the thyroid and trachea. Numerical labels represent PTH (parathyroid hormone) levels measured at various catheterization sites. A red circle and arrow point to a significantly elevated PTH value (790 pg/mL) at the inferior thyroid vein, indicating the location of a hyperfunctioning parathyroid gland. This image serves as an educational tool for endocrine surgery and interventional radiology, demonstrating the integration of diagnostic imaging and biochemical sampling for precise surgical planning in primary or persistent hyperparathyroidism.
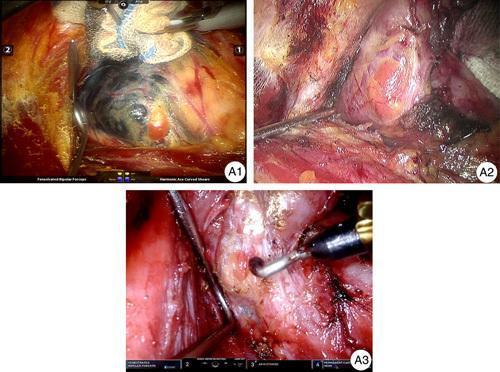
This set of intraoperative clinical photographs demonstrates the surgical anatomy and classification of parathyroid glands (PGs) during a thyroidectomy. The images are categorized into three types based on their anatomical relationship to the thyroid capsule. Type A1 shows a parathyroid gland located on the external surface of the thyroid gland, adhering to the outer layer. Type A2 illustrates a gland that is partially or entirely embedded within the thyroid tissue but remains external to the true thyroid capsule. Type A3 depicts an intracapsular parathyroid gland, which is entirely enclosed within the thyroid's true capsule. The photographs highlight the use of surgical instruments, such as fine dissectors and harmonic shears, to perform subcapsular meticulous dissection (SMCD). This technique aims to preserve the PGs in situ, along with their secondary and tertiary vascular supply, to prevent postoperative hypoparathyroidism. The visual contrast between the yellowish-brown or reddish hue of the parathyroid glands and the darker thyroid parenchyma is a key diagnostic feature for surgical identification.
osteitis fibrosa cystica bone X-ray hyperparathyroidism
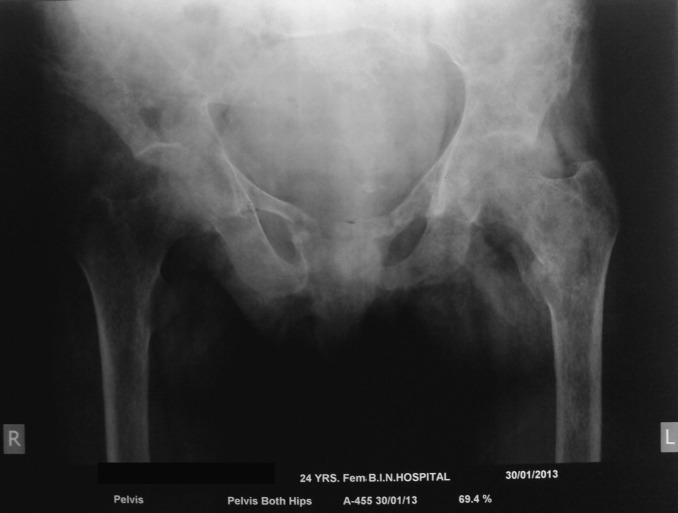
Anteroposterior (AP) X-ray of the pelvis and bilateral proximal femurs demonstrating classic radiographic signs of osteitis fibrosa cystica secondary to primary hyperparathyroidism. The image shows widespread, extensive lytic lesions (salt-and-pepper appearance) involving the iliac bones, superior and inferior pubic rami, and both femoral heads and greater trochanters. There is significant cortical thinning and generalized osteopenia, manifested as increased lucency across the skeletal structures. These subperiosteal and endosteal resorptive changes result in a mottled, heterogeneous bone texture and a loss of normal trabecular patterns. The findings represent brown tumors and bone remodeling typical of Von Recklinghausen's disease of bone, emphasizing the severe impact of chronically elevated parathyroid hormone (PTH) on skeletal integrity.
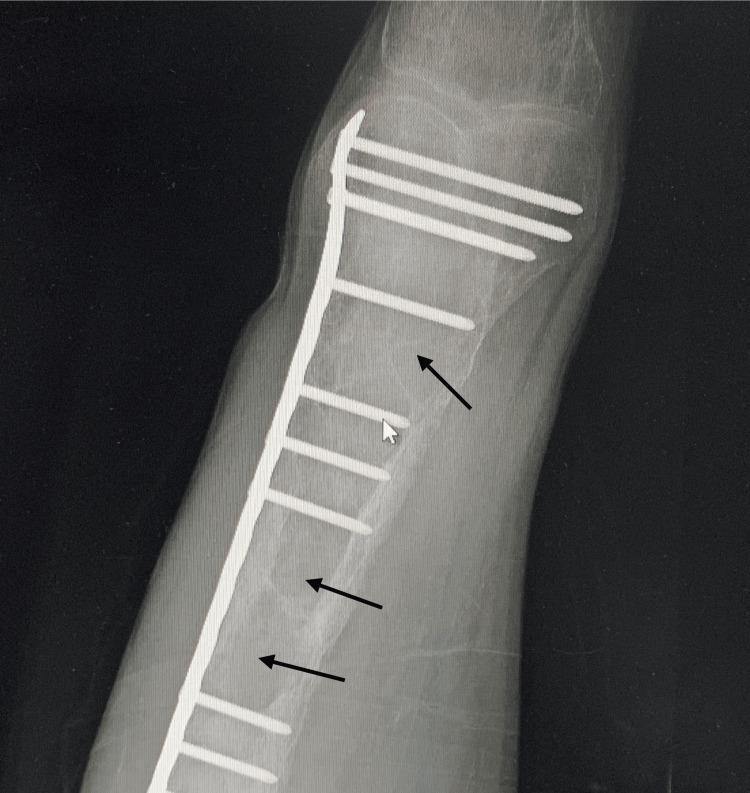
This diagnostic X-ray of a long bone (likely the femur or tibia) demonstrates advanced radiographic signs of osteitis fibrosa cystica secondary to severe hyperparathyroidism. The bone exhibits generalized osteopenia and multiple well-defined, radiolucent, cyst-like lesions (brown tumors), indicated by black arrows, which represent areas of high bone turnover and fibrous replacement. Surgical orthopedic hardware is visible, consisting of a long metallic compression plate and multiple cortical screws, signifying internal fixation of a previous pathological fracture. The bone cortex appears thinned and irregular. This image serves as a classic clinical example of skeletal manifestations in chronic kidney disease-mineral and bone disorder (CKD-MBD) or primary hyperparathyroidism, illustrating the progression from metabolic imbalance to structural skeletal failure requiring surgical intervention.
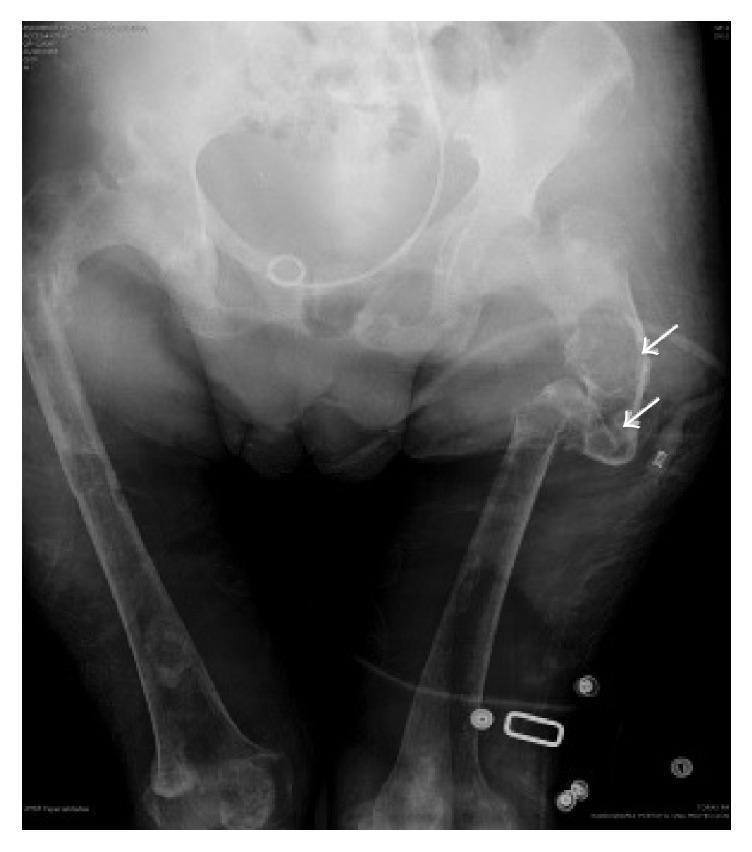
Anteroposterior pelvic X-ray demonstrating advanced skeletal manifestations of severe primary hyperparathyroidism, specifically osteitis fibrosa cystica. The imaging shows diffuse demineralization and widespread osteopenia with a significant reduction in cortical thickness across the pelvis and bilateral femurs. Multiple well-circumscribed, radiolucent cystic lesions and expansive 'brown tumors' are visible, notably in the right proximal femur (indicated by white arrows). There is evidence of a pathological fracture in the femoral neck and distortion of the pelvic girdle architecture. The long bones show subperiosteal resorption and intramedullary cystic changes. A medical drain or catheter is visible overlying the lower abdomen and pelvis, and external monitoring equipment is present on the lower limbs. This diagnostic image illustrates the end-stage metabolic bone disease associated with untreated parathyroid adenomas, highlighting the risks of fracture and profound bone resorption in this clinical context.
nephrolithiasis kidney stone CT scan
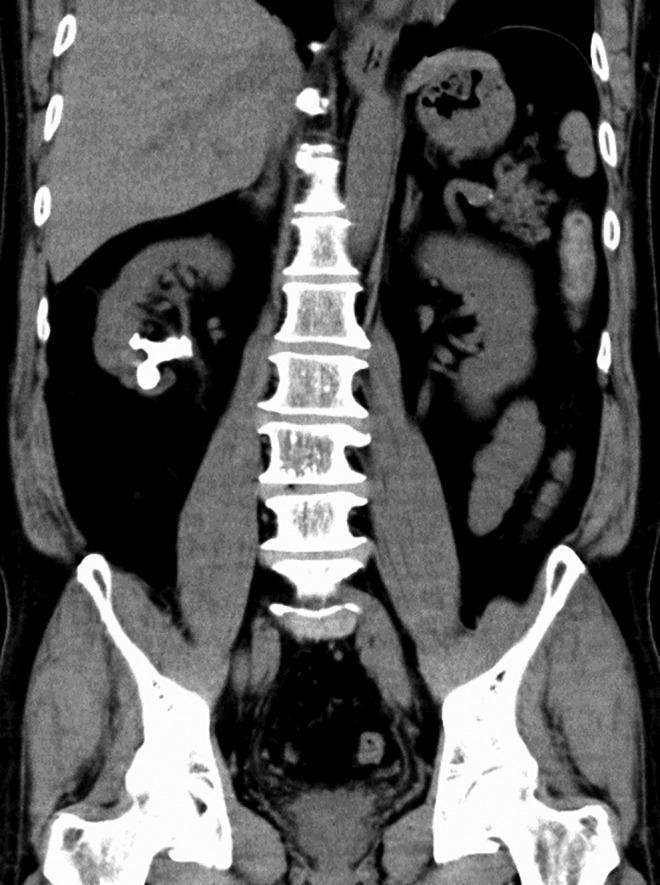
This coronal CT scan of the abdomen and pelvis demonstrates nephrolithiasis within the right kidney. The imaging modality clearly highlights high-density, radio-opaque calcifications located primarily within the right middle and lower renal calyces. The largest stone measures approximately 36 mm in its longest diameter, with a mean attenuation value of 798 Hounsfield Units, indicating high mineral density. Key anatomical landmarks visible include the vertebral column, psoas muscles, and pelvic bones. Both kidneys are identified bilaterally, with the right kidney positioned slightly more inferiorly than the left. There is no evidence of significant hydronephrosis in this view. The image serves as a clinical diagnostic example of symptomatic or asymptomatic renal calculi and is suitable for teaching the radiological identification of stone burden and density calculation using CT imaging in urology.
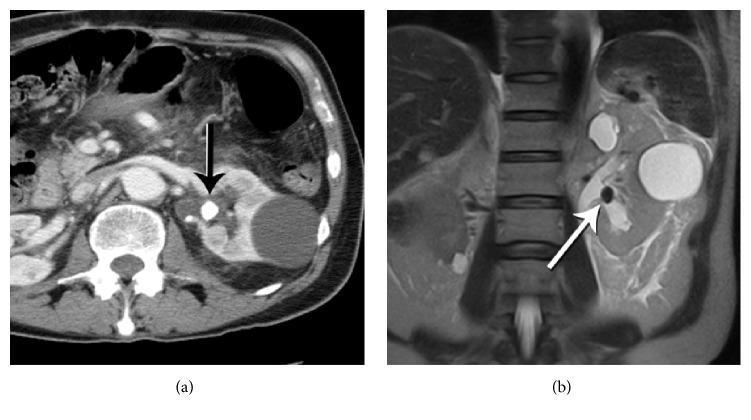
This dual-modality clinical diagnostic image compares the appearance of nephrolithiasis on Computed Tomography (CT) and Magnetic Resonance Imaging (MRI). Image (a) is an enhanced axial CT scan of the abdomen showing a high-density (hyperattenuating), well-defined calcified stone (arrow) located within the left renal pelvis. The kidney shows contrast enhancement of the parenchyma and a simple renal cyst on the lateral aspect. Image (b) is a coronal T2-weighted HASTE MRI of the same patient. In this modality, the stone (arrow) manifests as a distinct focal signal void (hypointense/dark) against the high signal intensity (hyperintense/bright) of the surrounding urine in the dilated collecting system. The vertebral column and paraspinal muscles are visible for anatomical reference. This comparison illustrates the different physical principles of stone detection: CT relies on radiodensity (Hounsfield units), whereas T2-weighted MRI identifies stones by the absence of signal relative to surrounding fluid, which is useful for diagnosing urolithiasis in populations where radiation sparing is preferred, such as pediatric or pregnant patients.
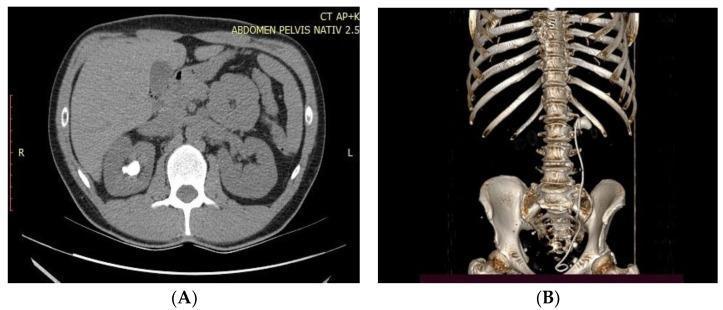
This composite educational resource features diagnostic imaging for nephrolithiasis. Image (A) is a non-contrast axial CT scan of the abdomen at the level of the kidneys. A high-density (radio-opaque), irregular calcification representing a large renal stone is clearly visible in the right kidney. The axial view demonstrates the posterior position of the kidneys relative to the liver and anterior abdominal organs, with the vertebral body centrally located. Image (B) shows a 3D volumetric reconstruction of the thoracolumbar spine and pelvis. It visualizes a double-J (DJ) ureteral stent in situ, extending from the right renal pelvis, following the anatomical course of the ureter anterior to the psoas muscle, and terminating in the bladder region. The reconstruction provides a clear view of the lower rib cage, lumbar vertebrae, and pelvic girdle, illustrating the spatial relationship between the urinary drainage system and the skeletal framework. These images are clinically relevant for teaching urological stone management and postoperative stent placement evaluation.
hypercalcemia ECG short QT interval
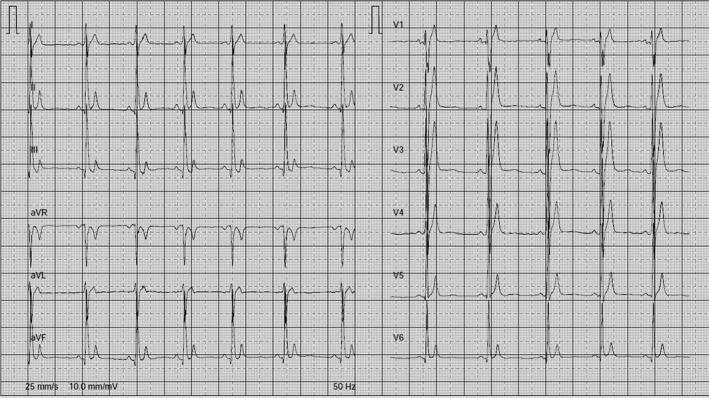
A 12-lead electrocardiogram (ECG) demonstrating the diagnostic features of Short QT Syndrome (SQTS) in a 65-year-old patient. The tracing shows a markedly abbreviated QT interval (measured at 240 ms, with a QTc of 294 ms), characterized by a short or virtually absent ST segment, with the T wave beginning almost immediately after the QRS complex. The T wave morphology is distinctive, appearing tall, peaked, and narrow across several leads, most notably in the precordial leads (V2-V4) and the inferior leads (II, aVF). The rhythm appears to be a regular sinus rhythm with a stable heart rate. These visual findings—specifically the shortened repolarization period and tall, symmetric T waves—are key clinical indicators used in the diagnosis of SQTS, a rare arrhythmogenic condition that increases susceptibility to atrial and ventricular fibrillation.
A side-by-side comparison of two 12-lead electrocardiograms (ECGs) demonstrating the visual characteristics of Short QT Syndrome (SQTS) versus a normal heart rhythm. Panel A shows a representative ECG from a patient with SQTS, characterized by a markedly shortened QT interval (306 ms) and corrected QT interval (QTc of 330 ms). Visually, this is evident by the short ST segment, with T waves beginning almost immediately after the narrow QRS complex. The T waves in Panel A, particularly in leads V2-V5, appear relatively tall, peaked, and symmetrical. Panel B shows a control ECG from a patient with a normal QTc of 432 ms and heart rate of 84/min. In contrast to Panel A, Panel B displays a distinct and longer ST segment between the end of the QRS complex and the onset of the T wave. The T waves in Panel B are broader and lower in amplitude compared to the peaked morphology seen in the SQTS patient. This clinical comparison illustrates the diagnostic criteria for SQTS, a rare channelopathy associated with sudden cardiac arrest.
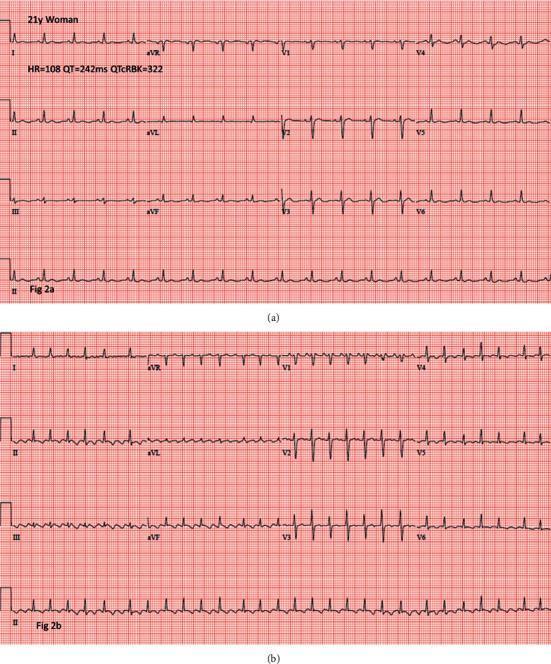
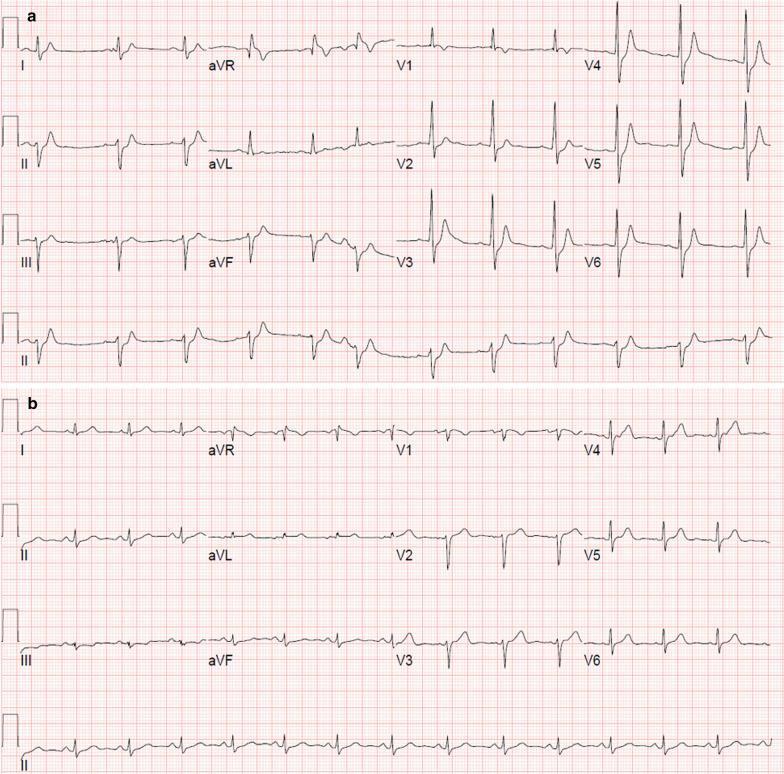
Two-part comparison of a 12-lead electrocardiogram (ECG) from a 21-year-old female patient, illustrating the progression from short QT syndrome to atrial flutter. Panel (a) shows a baseline rhythm at 108 bpm with a notably short QT interval of 242 ms (QTcRBK = 322 ms). The rhythm is sinus, characterized by upright P waves in leads I, II, and aVF, and a normal QRS morphology. Panel (b) displays a subsequent ECG demonstrating the development of an irregular rhythm. Distinct P waves are absent and replaced by organized 'sawtooth' atrial flutter waves, most prominent in the inferior leads (II, III, aVF). The QRS complexes remain narrow but exhibit variable R-R intervals, consistent with atrial flutter and variable atrioventricular (AV) conduction. This comparison serves as an educational illustration of the increased risk for supraventricular tachyarrhythmias, such as atrial flutter and fibrillation, in patients with congenital or acquired short QT intervals.
parathyroid adenoma sestamibi scan scintigraphy
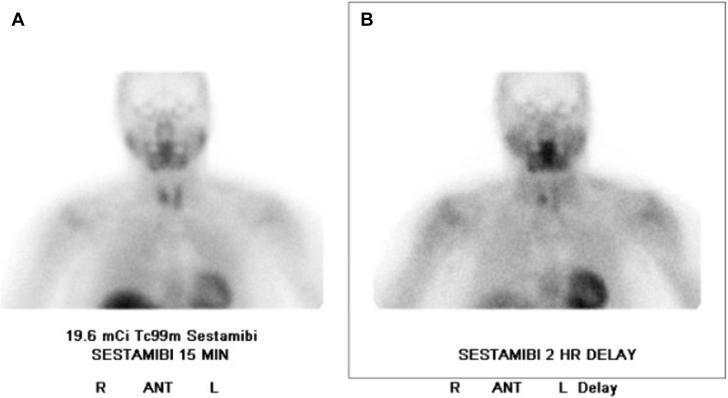
This diagnostic image shows a technetium-99m (Tc99m) sestamibi parathyroid scintigraphy scan in two phases: an early 15-minute scan (A) and a 2-hour delayed scan (B), both presented in the anterior (ANT) view. The study focuses on the neck and upper torso regions. In scan A, initial tracer uptake is visible within the thyroid gland and salivary glands, with a focal area of increased accumulation in the lower right parathyroid region. In the delayed scan B, the physiological tracer activity has partially washed out from the normal thyroid tissue. However, there is persistent, focal radiotracer retention in the lower portion of the right parathyroid gland. This differential washout pattern is a classic scintigraphic finding diagnostic of a parathyroid adenoma. The images utilize nuclear medicine imaging to localize ectopic or hyperfunctioning parathyroid tissue in patients with primary hyperparathyroidism or normocalcemic hyperparathyroidism.
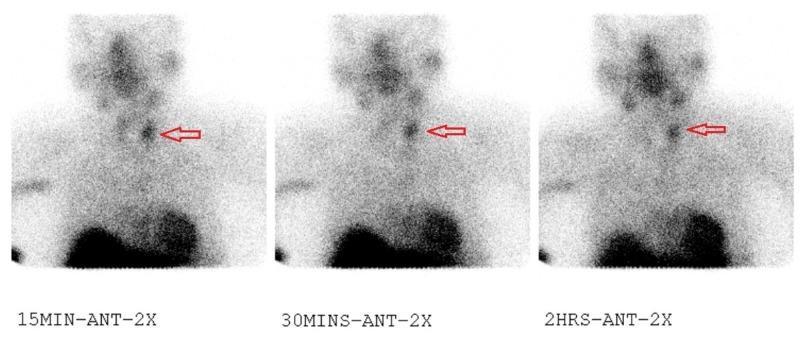
This diagnostic image set consists of three sequential parathyroid scintigraphy (Sestamibi scan) frames captured at 15-minute, 30-minute, and 2-hour intervals in the anterior projection. The imaging focuses on the neck and upper mediastinum to evaluate for parathyroid pathology. The series demonstrates a persistent, focal area of increased radiotracer uptake in the left parathyroid region, indicated by red horizontal arrows. While the physiological background activity in the salivary glands and thyroid tissue gradually washes out over the time course, the focal lesion on the left maintains high intensity, which is a classic diagnostic feature of a parathyroid adenoma. The scans also show expected physiological activity in the myocardium at the bottom of the frames. This comparison sequence is used in nuclear medicine to distinguish hyperfunctioning parathyroid tissue from thyroid tissue, as adenomas typically show delayed washout of technetium-99m methoxyisobutylisonitrile (Tc-99m MIBI) compared to the thyroid gland.
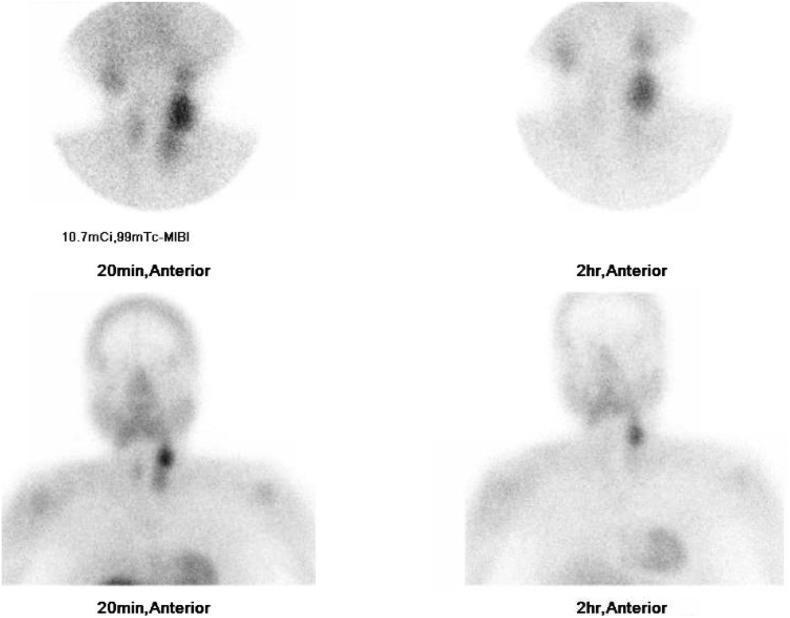
This diagnostic image displays a dual-phase 99mTc-sestamibi (MIBI) parathyroid scintigraphy scan, consisting of anterior views of the neck and upper mediastinum. The study includes early images (20 minutes post-injection) and delayed images (2 hours post-injection). In the early phase, there is generalized radiotracer uptake within the thyroid gland and a focal, intense area of hyperconcentration located at the left superior pole of the thyroid. In the delayed phase, the thyroid gland demonstrates significant radiotracer washout. However, the focal lesion at the left superior pole shows persistent retention of the radiotracer, a classic finding indicative of a parathyroid adenoma. The mediastinal region shows no evidence of ectopic parathyroid tissue. This modality is primarily used in the evaluation of primary hyperparathyroidism to localize hyperfunctioning parathyroid glands prior to surgical intervention. The comparison between early uptake and delayed retention allows for differentiation between normal thyroid tissue and hyperactive parathyroid tissue.
band keratopathy cornea calcium deposits eye
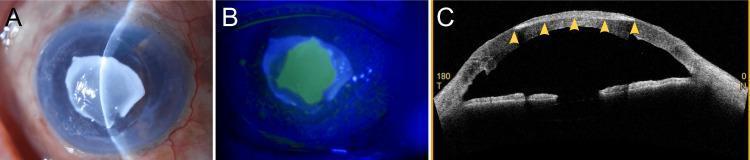
A multi-panel ophthalmological clinical image series demonstrating band keratopathy and corneal epithelial defects following Descemet's stripping automated endothelial keratoplasty (DSAEK). Panel A is a clinical photograph of the anterior segment showing a prominent, irregular, opaque, white calcified deposit in the central cornea, characteristic of dystrophic calcification. Panel B displays the same eye under cobalt blue light with fluorescein staining, revealing a large, bright green fluorescent central corneal epithelial defect corresponding to the area of calcification. Panel C is an anterior segment optical coherence tomography (AS-OCT) cross-sectional scan showing a hyperreflective band (marked with yellow arrowheads) localized to the subepithelial and anterior stromal layers, indicative of calcium phosphate deposits. The images illustrate a rare complication where persistent epithelial loss and topical phosphate-buffered steroid use contribute to rapid corneal calcification. This serves as an educational example of corneal transplant complications, the clinical presentation of band keratopathy, and the diagnostic utility of AS-OCT in characterizing stromal pathology.
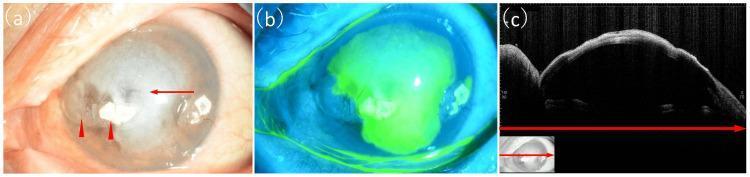
A multi-panel ophthalmological clinical study of the left eye demonstrating severe infectious keratitis. Panel (a) is a slit-lamp photograph showing extensive white corneal infiltration covering over two-thirds of the cornea (red arrow), associated with a deep ulcer extending into the anterior stroma, large epithelial defects, and mild conjunctival hyperemia. Calcium deposits consistent with band-shaped keratopathy are visible in the peripheral cornea (red arrowheads). Panel (b) presents a fluorescein-stained photograph under cobalt blue light, revealing a large, bright green fluorescent area indicating a significant loss of epithelial integrity and an extensive active corneal ulcer. Panel (c) is an anterior segment optical coherence tomography (AS-OCT) cross-section showing marked hyperreflectivity of the corneal epithelium and the superficial stroma, corresponding to the areas of infiltration and ulceration (indicated by red arrows). This imaging set illustrates the diagnostic workup for complex infectious keratitis, likely fungal in origin given the recalcitrant nature and clinical morphology.
subperiosteal bone resorption radial aspect phalanges X-ray
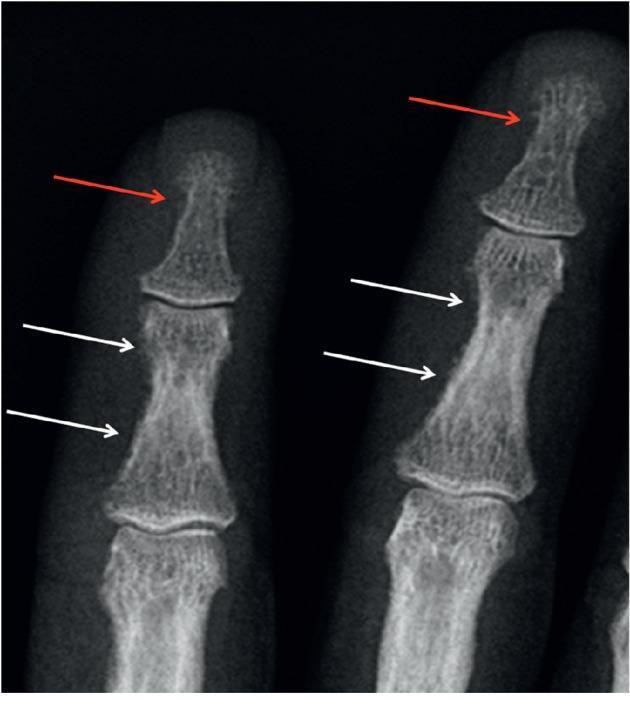
This diagnostic image is a close-up radiograph (X-ray) of the second and third fingers, demonstrating classic skeletal manifestations of hyperparathyroidism. Key pathological features are identified with anatomical precision. Subperiosteal resorption is prominently visible along the radial aspects of the middle phalanges (indicated by white arrows), characterized by a thinned, feathery, and irregular lace-like cortical margin. Additionally, the distal phalangeal tufts show signs of acroosteolysis (indicated by red arrows), where the normally smooth bone appears blunted, frayed, and resorbed. These osseous changes are pathognomonic findings often associated with primary hyperparathyroidism or renal osteodystrophy. The image serves as an educational tool for identifying metabolic bone disease, highlighting the importance of hand radiographs in detecting early osteoclastic activity and cortical bone destruction.
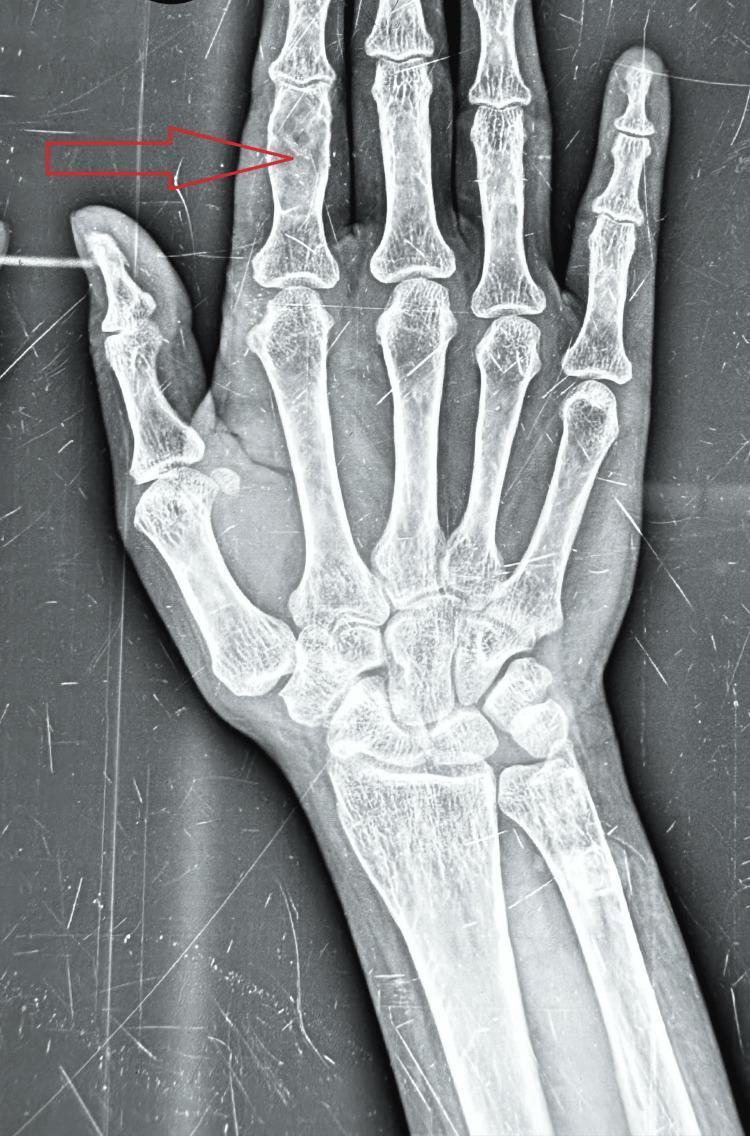
This diagnostic X-ray (radiography) of the right hand in a posterior-anterior view illustrates classic skeletal manifestations of primary hyperparathyroidism. The image focuses on the second digit (index finger), specifically the middle and proximal phalanges. Key findings include prominent subperiosteal bone resorption along the radial aspect of the middle phalanx, characterized by a 'lace-like' cortical irregularity and thinning. Additionally, a localized lytic lesion with well-defined borders and decreased radiodensity is visible within the medullary cavity, consistent with a bone cyst or brown tumor. These features are hallmark signs of high bone turnover states associated with excess parathyroid hormone (PTH). The rest of the hand bones show a generalized decrease in bone density. This image is of high educational value for medical students and endocrinology residents in identifying pathognomonic radiological signs of renal osteodystrophy or hyperparathyroidism.
pancreatitis CT scan acute
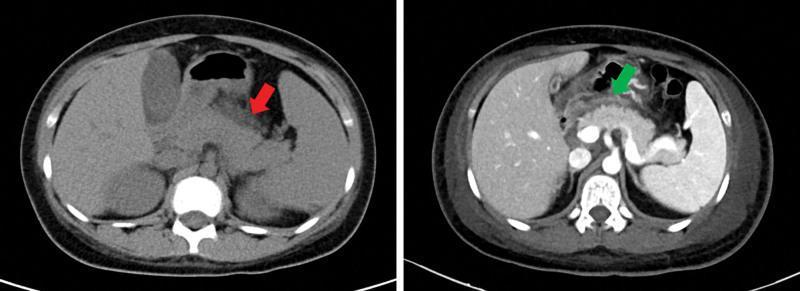
This abdominal computerized tomography (CT) scan consists of two axial views demonstrating features of acute pancreatitis and associated complications. The image on the left, a non-contrast CT, features a red arrow indicating a swollen, heterogeneously dense pancreas with peripancreatic fat stranding and indistinct margins, signs characteristic of acute inflammation. The image on the right is a contrast-enhanced CT where the green arrow points to a significant collection of low-density fluid in the anterior pararenal space and abdominal cavity, consistent with hydrops abdominis or peripancreatic fluid collection. Anatomical landmarks include the liver on the right side of the image, the spleen on the left, and the stomach located anteriorly to the pancreas. The contrast scan clearly delineates the vasculature and reinforces the presence of extensive peritoneal fluid and inflammatory changes surrounding the pancreatic head and body. These findings are clinically relevant for diagnosing systemic complications of autoimmune conditions like Systemic Lupus Erythematosus (SLE) affecting the gastrointestinal system.
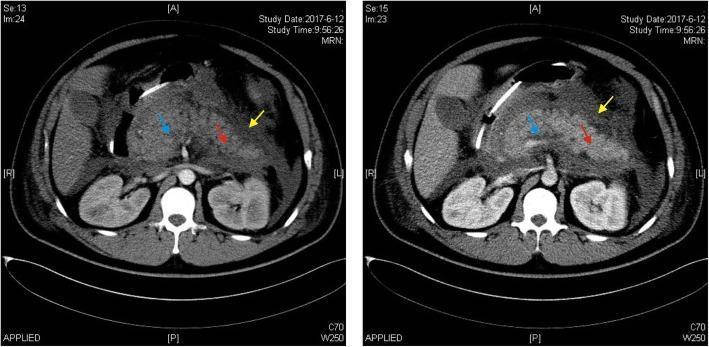
This diagnostic image consists of two side-by-side axial abdominal CT scans demonstrating features of severe acute pancreatitis. The left panel shows a non-contrast (plain) CT, while the right panel shows a contrast-enhanced CT. The pancreas is diffusely enlarged (edematous) with a significant loss of the normal sharp margins and disappearance of clear peripancreatic adipose tissue planes. Colored arrowheads on the enhanced scan identify key pathological findings: the blue arrowhead points to a hypo-enhancing region representing an acute necrotic collection; the red arrowhead indicates areas of pancreatic edema; and the yellow arrowhead highlights an acute peripancreatic fluid collection (APFC). The contrast-enhanced image is critical for distinguishing between viable, enhancing pancreatic parenchyma and non-enhancing necrotic tissue. There is a visible water-density shadow in the peripancreatic space, characteristic of inflammatory exudate. This comparison is used in medical education to illustrate the diagnostic criteria and complications of pancreatitis according to the Atlanta consensus.
mkdir -p /tmp/workspace/hyperparathyroidism-ppt && ls /tmp/workspace/hyperparathyroidism-ppt/