
Mycotoxicosis Explain in detail, microbiology
mycotoxicosis microbiology types aflatoxin ochratoxin trichothecene mechanisms 2024
mycotoxin producing fungi aflatoxin Aspergillus flavus
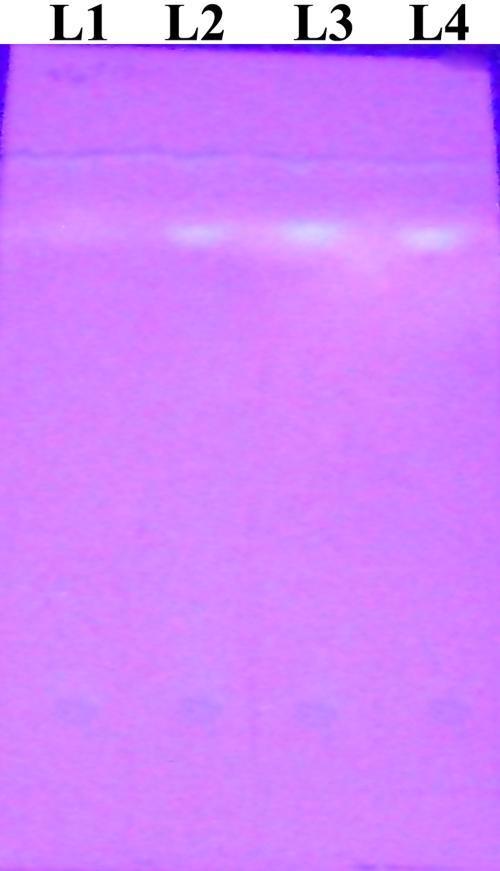
This diagnostic image shows a Thin Layer Chromatography (TLC) plate used to detect aflatoxin B1 in culture filtrates of Aspergillus flavus, a fungal pathogen associated with keratitis. The chromatogram consists of four labeled lanes (L1–L4) against a uniform purple background, likely visualized under ultraviolet (UV) light. Lane L1 contains the extract from a non-aflatoxin-producing clinical strain and shows no visible band, indicating the absence of the toxin. Lanes L2 and L3 contain extracts from an aflatoxin-producing clinical strain and an environmental strain, respectively; both display distinct fluorescent bands at a consistent retention factor (Rf). Lane L4 contains a pure aflatoxin B1 standard, which displays a band aligned with those in L2 and L3, confirming the identity of the detected metabolite. This comparison demonstrates the toxigenic potential of different A. flavus isolates, emphasizing the clinical relevance of mycotoxin production in fungal infections.
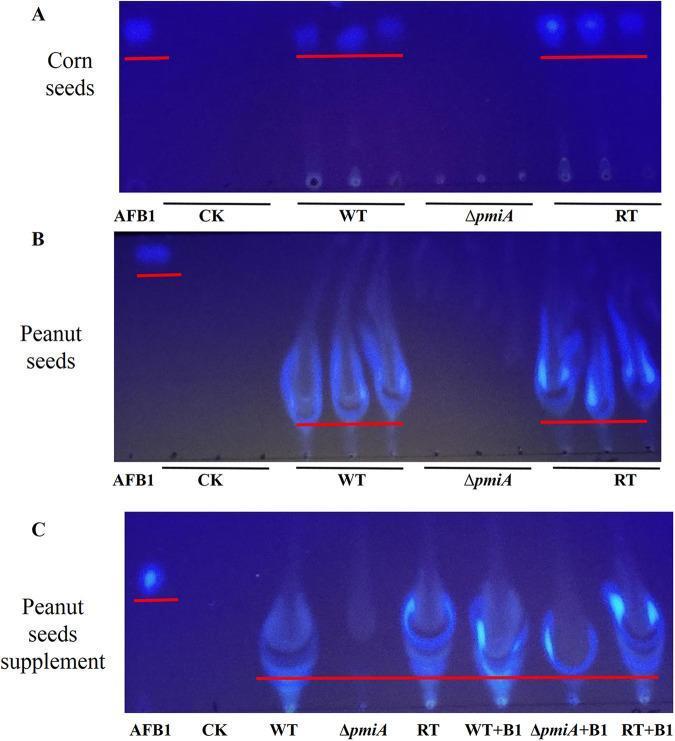
Thin-layer chromatography (TLC) analysis images depicting the detection of aflatoxin B1 (AFB1) in agricultural samples infected with Aspergillus flavus. The visualization utilizes ultraviolet fluorescence to identify the presence of fungal mycotoxins. Panel A shows AFB1 levels in corn seeds, where wild-type (WT) and reverse transcriptase (RT) strains exhibit clear fluorescent bands aligning with the AFB1 standard, while the phosphomannose isomerase mutant (ΔpmiA) and chloroform control (CK) show no detectable toxin. Panel B illustrates the same analysis in peanut seeds, demonstrating significantly higher fluorescence and migration smearing in WT and RT groups compared to ΔpmiA. Panel C shows the 'peanut seeds supplement' experiment, where AFB1 standard was added to samples to verify if peanut oil matrix effects interfere with migration. The results indicate that while lipid interference causes downward smearing, the toxin remains detectable in supplemented mutant and control lanes. This biochemical assay demonstrates the critical role of the pmiA gene in A. flavus pathogenicity and mycotoxin biosynthesis during crop infection.
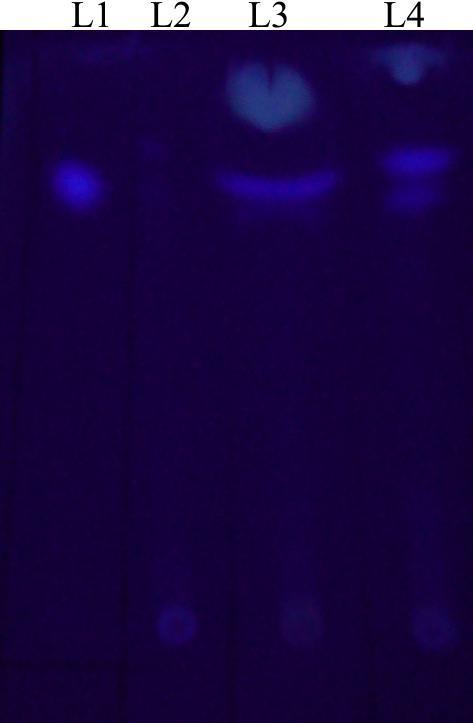
This diagnostic image shows a Thin Layer Chromatography (TLC) plate under ultraviolet light, used to detect aflatoxin production in Aspergillus flavus isolates related to fungal keratitis. The chromatogram consists of four lanes labeled L1 through L4. Lane L1 serves as the control, displaying a single fluorescent band corresponding to the standard aflatoxin B1 (AFB1). Lane L2, representing the extract from a non-aflatoxigenic corneal isolate (C2), shows no matching fluorescent band at the AFB1 level. Lane L3 shows a high-intensity fluorescent area at the same vertical migration level as the standard, indicating significant AFB1 production by a pathogenic corneal isolate (C1). Lane L4 displays a distinct fluorescent band, identifying AFB1 production in an environmental isolate (E1). The image demonstrates the laboratory technique for identifying secondary metabolites in ophthalmological fungal infections, illustrating the clinical variance in toxin production among different fungal isolates. The varying intensities and distribution of the fluorescent signals reflect the relative concentration of the mycotoxin in each sample.
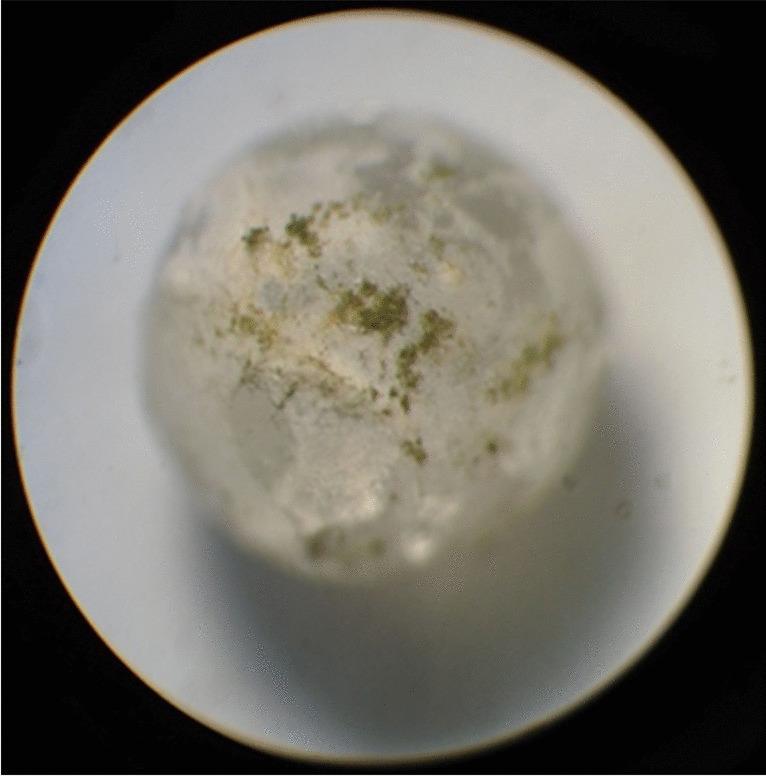
This diagnostic micrograph (×40 magnification) illustrates the growth of Aspergillus flavus, a clinically significant fungus, on an experimental substrate. The image depicts a spherical, translucent 2mm glass bead coated with corn starch, which serves as a model for grain particles to study fungal colonization and mycotoxin production. The primary focus is the visible development of Aspergillus flavus colonies, appearing as irregular, greenish-brown clusters of mycelia and spores scattered across the granular surface of the starch. These colonies demonstrate the mold's ability to utilize starch as a substrate for growth and eventual sporulation. This model is utilized in toxicology and food safety research to investigate the environmental conditions favoring A. flavus growth and the subsequent production of aflatoxin B1, a potent human carcinogen. The image highlights the superficial, non-uniform distribution of fungal colonies on the carbohydrate source, illustrating early-to-mid stage contamination patterns relevant to medical microbiology and occupational health.
trichothecene ergot alkaloid fusarium mycotoxin structure
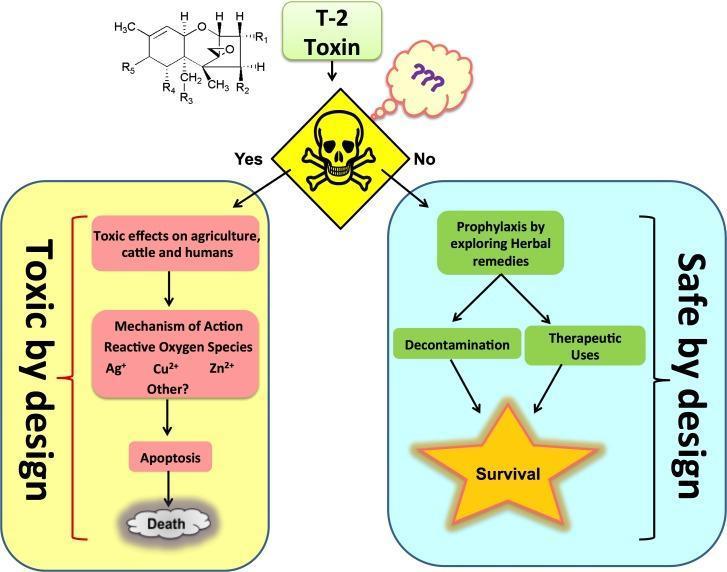
This infographic and flow chart illustrate the dual pathways of the T-2 toxin, a type A trichothecene mycotoxin, categorized into 'Toxic by design' and 'Safe by design' outcomes. At the top, the chemical structure of a tetracyclic sesquiterpenoid 12,13-epoxytrichothec-9-ene ring is shown. A central decision node, represented by a skull and crossbones, branches into two clinical scenarios. The 'Toxic by Design' pathway (left) details the progression from toxic effects on agriculture and humans to a molecular mechanism involving reactive oxygen species (ROS) mediated by metal ions (Ag+, Cu2+, Zn2+). This leads to programmed cell death (apoptosis) and systemic lethality. The 'Safe by Design' pathway (right) focuses on clinical prophylaxis and mitigation. It outlines the exploration of herbal remedies leading to decontamination protocols and potential therapeutic applications, such as toxin-based suicide gene therapies, culminating in survival. This diagram serves as an educational tool for understanding mycotoxicology, oxidative stress mechanisms, and potential public health interventions against fungal toxins.
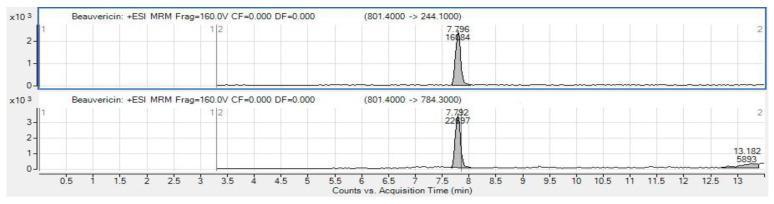
This diagnostic image displays two Extracted Ion Chromatograms (EICs) from a liquid chromatography-tandem mass spectrometry (LC-MS/MS) analysis used for mycotoxin detection. The chromatograms target Beauvericin (BEA), an emerging Fusarium-derived mycotoxin of clinical relevance in food safety and toxicology. Both charts plot Signal Intensity (y-axis, scaled to 10^3) against Acquisition Time in minutes (x-axis). The top panel shows a sharp peak at a retention time of approximately 7.796 minutes with an intensity of 16,484 counts, representing a specific ion transition (801.4000 -> 244.1000). The bottom panel shows a corresponding peak at 7.792 minutes with a higher intensity of 22,897 counts for a secondary transition (801.4000 -> 784.3000), along with a smaller secondary peak at 13.182 minutes. The use of Multiple Reaction Monitoring (MRM) and specific ion transitions illustrated here demonstrates the methodology for identifying and quantifying fungal toxins in environmental or clinical samples, essential for studying human exposure risks to nephrotoxic or immunosuppressive mycotoxins.
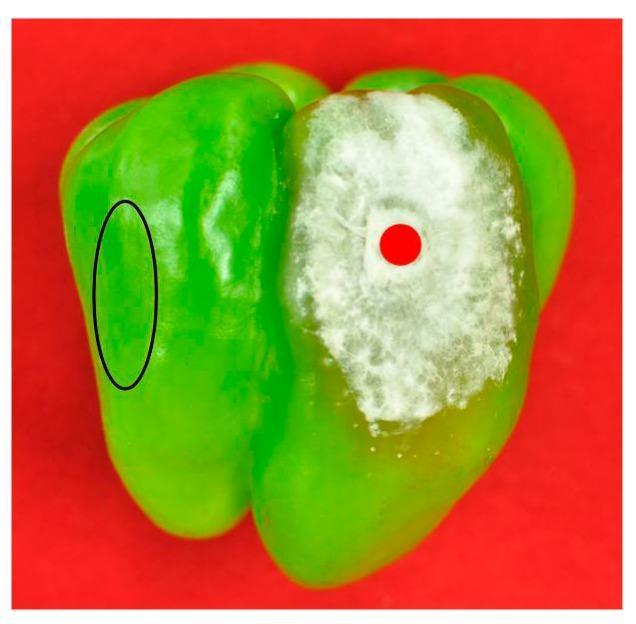
This clinical photograph of a specimen illustrates the effects of fungal inoculation on a green sweet pepper (Capsicum annuum), used as a model to study mycotoxin production and migration. The image highlights two distinct zones: an inoculation site marked by a red dot and a healthy control area enclosed in a black oval. The inoculation site demonstrates significant pathological changes, including a large, irregular lesion characterized by dense, white, cottony fungal growth (mycelium) indicative of Fusarium species infection. The surrounding tissue in this zone appears softened and discolored, showing signs of necrosis and biological degradation. In contrast, the area within the black oval remains smooth, vibrant green, and structurally intact, representing healthy tissue. This comparative model is used in toxicology and food safety research to analyze the presence of carcinogenic mycotoxins, such as fumonisins and beauvericin, which can persist in infected tissues and potentially diffuse into apparently sound parts of the food product, posing risks to human health through the interference of sphingolipid metabolism.
mycotoxicosis mycotoxin human disease review