
analyse_media
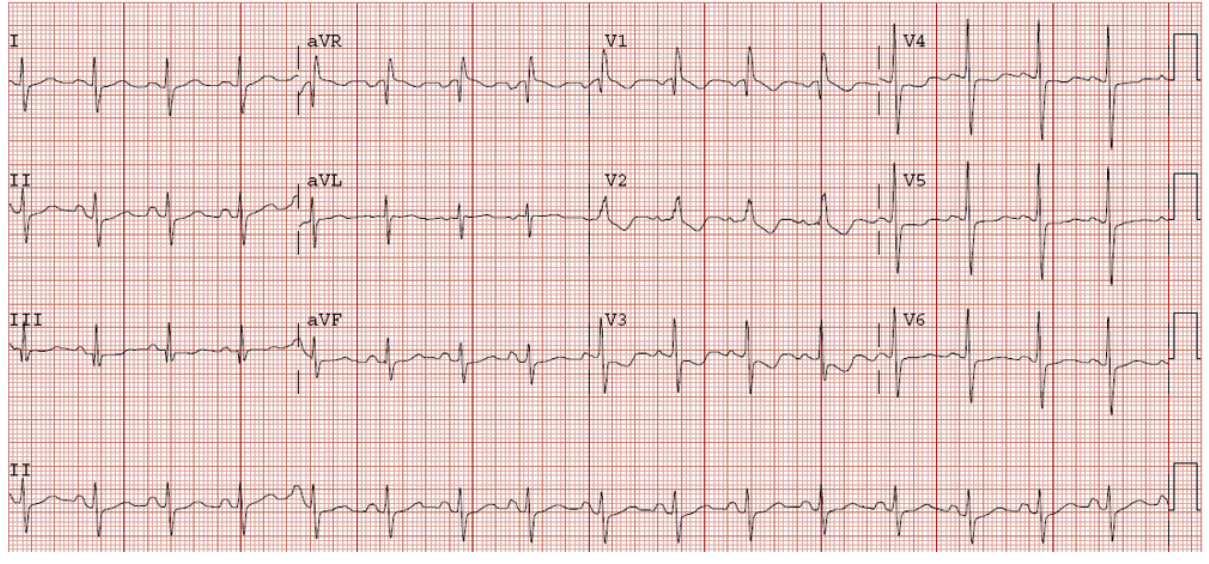
Here is a full read of this ECG report:
ECG Report Summary
Measured Parameters
| Parameter | Value | Normal Range |
|---|---|---|
| Heart Rate | ~94 bpm | 60-100 bpm |
| PR Interval | 116 ms | 120-200 ms |
| QRS Duration | 90 ms | <120 ms |
| QT / QTc (Bazett) | 390 / 461 ms | QTc <440 ms (men), <450 ms (women) |
| P / QRS / T Axis | 58° / 62° / 63° | All within normal range |
| RV5 | 1.033 mV | |
| SV1 | 0.539 mV |
Automated Findings
- Sinus rhythm - Normal
- Borderline prolonged QT interval - QTc of 461 ms is mildly above the standard cut-off (440-450 ms depending on sex). This warrants attention, especially if the patient is on QT-prolonging medications (e.g., antipsychotics, antiarrhythmics, certain antibiotics like azithromycin, or methadone).
- Low QRS voltages in limb leads - Defined as peak-to-peak QRS amplitude <5 mm in all limb leads. Differential diagnoses include:
- Pericardial effusion
- Hypothyroidism (myxedema)
- Obesity / large body habitus
- COPD / emphysema (hyperinflation)
- Hypothermia
- Amyloidosis or other infiltrative cardiomyopathy
- Borderline ECG - Overall classification indicating the tracing has abnormal features but no definitive acute pathology.
Key Clinical Notes
- PR interval of 116 ms is slightly short (normal starts at 120 ms), which could suggest a pre-excitation pattern (e.g., WPW) or simply be a normal variant - check for delta waves on the tracing.
- QTc 461 ms - Borderline prolonged. Risk of Torsades de Pointes increases substantially above 500 ms, but this value still warrants electrolyte check (K⁺, Mg²⁺, Ca²⁺) and medication review.
- Normal QRS axis (62°) and normal QRS duration (90 ms) argue against bundle branch block.
- The combination of low limb lead voltages + any clinical features of dyspnea or edema should prompt an echocardiogram to rule out pericardial effusion or cardiomyopathy.
This is an automated interpretation aid. Clinical correlation and physician review are required before acting on these findings.
Copd
Reading File
Searching sources...
Finding Sources
Finding Sources
Finding Sources
Finding Sources
Reading File
Finding Sources
Loading Image
Finding Sources
Here is a focused explanation of how COPD explains the findings on this ECG:
Why COPD Explains This ECG
The three key findings on this tracing - low QRS voltages in limb leads, borderline prolonged QTc, and borderline ECG - all fit well with COPD. Here is the mechanism behind each:
1. Low QRS Voltages in Limb Leads (the most specific finding)
This is a classic and well-recognized ECG manifestation of COPD. The mechanism is lung hyperinflation:
- Overinflated lungs trap air between the heart and the chest wall / limb electrodes
- Air is a poor conductor of electrical signals
- This increased electrical resistance attenuates (dampens) the QRS voltage as recorded by limb leads
- The heart itself is electrically normal - it is simply "insulated" by the barrel chest of emphysema
As confirmed in Murray & Nadel's Textbook of Respiratory Medicine:
"If lung hyperinflation is present, a low-voltage QRS complex is common." - Murray & Nadel's Textbook of Respiratory Medicine
2. Additional COPD-Related ECG Changes to Look For
COPD - especially when complicated by pulmonary hypertension (cor pulmonale) - produces a characteristic ECG pattern:
| Finding | Mechanism |
|---|---|
| P pulmonale (peaked P >2.5 mm in II, III, aVF) | Right atrial enlargement |
| Right axis deviation | RV pressure overload |
| Low limb lead voltage | Hyperinflation / barrel chest |
| Prominent S waves in I, II, III (S1S2S3 pattern) | RV strain |
| Incomplete RBBB | RV conduction delay |
| Tall R in V1, deep S in V5/V6 | RV hypertrophy |
| Multifocal atrial tachycardia (MAT) | Hypoxia-driven atrial irritability |
This patient's ECG does not show the full cor pulmonale pattern (no right axis deviation, no P pulmonale, normal QRS axis at 62°), which suggests either early/mild COPD or COPD without significant pulmonary hypertension yet.
Here is a reference ECG from a patient with established pulmonary hypertension from COPD showing these findings:
3. Borderline QTc (461 ms) in COPD
COPD patients commonly have electrolyte disturbances that prolong QTc:
- Hypokalaemia - from beta-2 agonist use (salbutamol, formoterol) and diuretics
- Hypomagnesaemia - poor nutrition, diuretics
- Hypoxaemia itself can prolong QTc and increase arrhythmia risk
Clinical Correlation
Given the ECG findings + a suspected COPD diagnosis, the next steps would be:
- Spirometry (PFTs) - confirm obstructive pattern (FEV1/FVC <0.70 post-bronchodilator)
- Chest X-ray - look for hyperinflation, flattened diaphragm, barrel chest, bullae
- Electrolytes (K⁺, Mg²⁺, Ca²⁺) - to evaluate/address borderline QTc prolongation
- Echocardiogram - if signs of cor pulmonale (check RV pressure, PA pressure)
- ABG - assess for hypoxaemia and hypercapnia
- 6-minute walk test - functional severity
The ECG in this case is consistent with mild COPD - the "low QRS voltage in limb leads" is the hallmark finding, and the absence of right axis deviation or P pulmonale suggests the right heart is not yet significantly stressed.
Source: Murray & Nadel's Textbook of Respiratory Medicine, p. 1951
This is a shared conversation. Sign in to Orris to start your own chat.