
Ecg for heart failure
ECG heart failure left ventricular hypertrophy
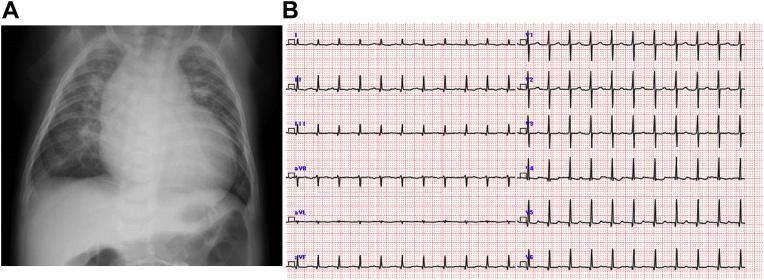
The image consists of two panels, (A) a frontal pediatric chest radiograph and (B) a standard 12-lead electrocardiogram (ECG), illustrating a case of heart failure and left ventricular hypertrophy (LVH). Panel A demonstrates significant cardiomegaly with a widened cardiac silhouette and a cardiothoracic ratio of approximately 60%. The lung fields show increased bronchovascular markings and haziness consistent with pulmonary congestion. Panel B shows a 12-lead ECG in sinus rhythm with tachycardia. Key diagnostic features for LVH are present, including high-voltage R waves in the lateral precordial leads (V5, V6) and deep, high-voltage S waves in the right precordial lead (V1). Additionally, the T waves demonstrate low voltage and inversion in several leads, suggesting ventricular strain. These visual findings together support a clinical diagnosis of pediatric cardiac dysfunction and structural hypertrophy, often associated with conditions such as aortic stenosis or coarctation of the aorta.
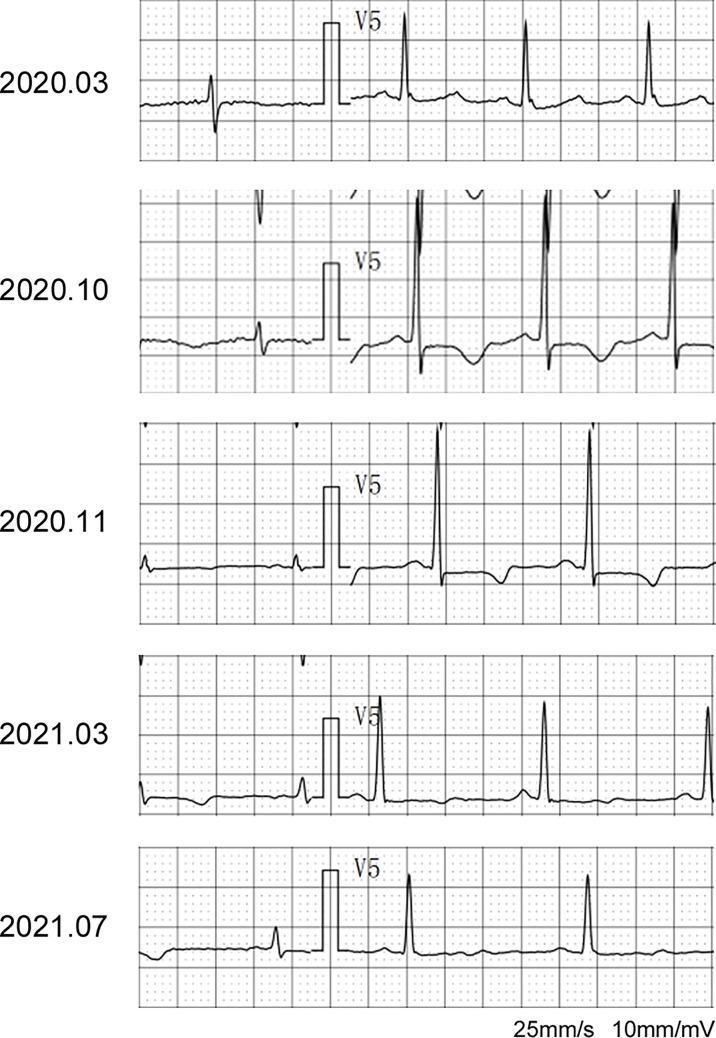
This Comparison Chart displays serial electrocardiogram (ECG) strips of the V5 lead from a single patient across five time points (March 2020 to July 2021). The educational focus is the visual progression of R-wave voltage changes in lead V5 (RV5) related to heart failure and subsequent recovery. In 2020.10, the RV5 amplitude significantly exceeds 2.5 mV (high voltage), accompanied by ST-segment depression and T-wave inversion, findings consistent with left ventricular hypertrophy (LVH) and strain during acute heart failure. The 2020.10 strip also shows shorter R-R intervals, indicating tachycardia. Following the initiation of heart failure treatment and switching anti-tumor therapy, subsequent strips (2020.11 through 2021.07) demonstrate a gradual reduction in R-wave amplitude and a return of the ST-T segment toward baseline, reflecting myocardial recovery. The ECG calibration is standard at 25 mm/s paper speed and 10 mm/mV sensitivity. This visual material is used in cardiology and oncology to illustrate drug-induced cardiotoxicity and the efficacy of therapeutic intervention.
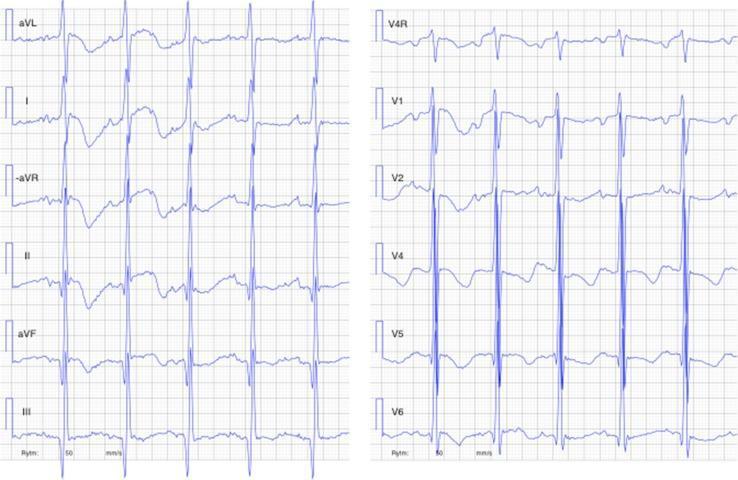
This diagnostic image is a 12-lead electrocardiogram (ECG) including right-sided lead V4R, obtained from a 4-month-old infant with dilated cardiomyopathy. The tracing demonstrates sinus tachycardia with a high ventricular rate. Key pathological features include markedly enlarged QRS amplitudes, particularly evident in the precordial leads (V1-V6) and limb leads (I, aVL), consistent with severe left ventricular hypertrophy. There are widespread ST-segment abnormalities characterized by down-sloping ST-segment depression and T-wave inversion/flattening in the lateral and inferior leads (I, aVL, II, aVF, V4-V6), representing a ventricular strain pattern. The P-waves are enlarged, suggesting atrial enlargement. Additionally, the QT interval is corrected (QTc) and appears prolonged. This ECG illustrates significant myocardial stress and structural remodeling associated with severe heart failure and pediatric cardiomyopathy.
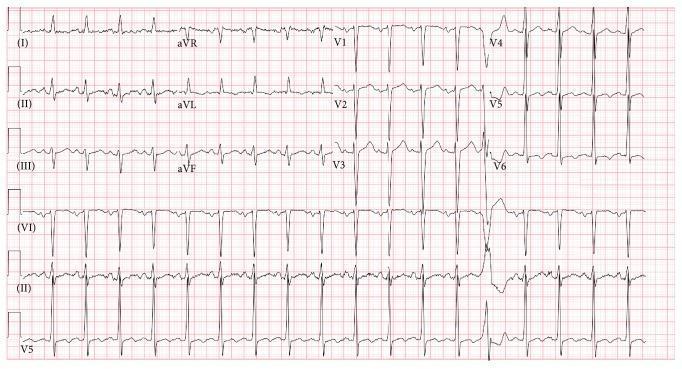
A 12-lead electrocardiogram (ECG) strip presented in a standard grid layout, demonstrating sinus tachycardia and structural cardiac abnormalities. The rhythm is predominantly regular with a rapid rate. A notable feature is the presence of a premature ventricular contraction (PVC) characterized by a wide, bizarre QRS morphology and a compensatory pause, most visible in the precordial leads. The tracing shows signs of left ventricular hypertrophy (LVH), including high voltage QRS complexes in the lateral leads (V4–V6). Nonspecific ST-segment depression and T-wave flattening or inversion are evident in the lateral leads (V4, V5, V6), suggesting possible myocardial ischemia or strain secondary to hypertrophy. Prolongation of the corrected QT interval (QTc) is also observable. Lead aVR shows expected inversions of the P, QRS, and T waves. This diagnostic image illustrates common findings in patients with advanced heart failure and severely reduced ejection fraction, specifically highlighting electrical remodeling and ventricular irritability.
ECG atrial fibrillation bundle branch block heart failure
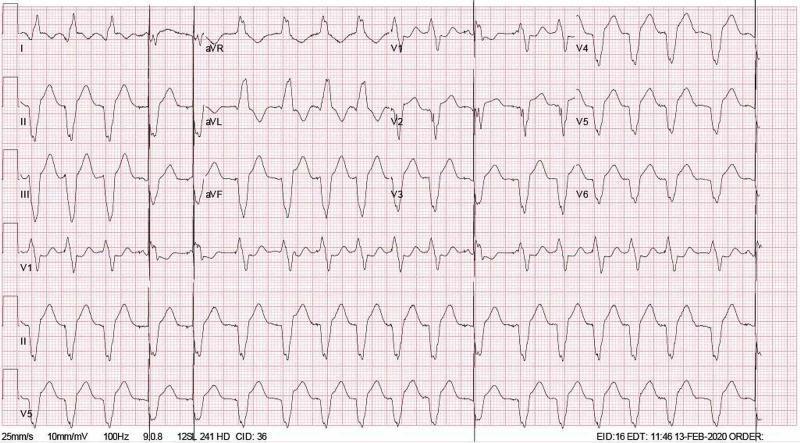
A standard 12-lead electrocardiogram (ECG) demonstrating a ventricular paced rhythm, consistent with Cardiac Resynchronization Therapy (CRT). The tracing shows a regular rhythm at a rate of approximately 111 beats per minute. Each QRS complex is preceded by a distinct, sharp vertical pacemaker spike, most visible in the inferior leads (II, III, aVF) and precordial leads (V1-V6). The QRS complexes are wide (prolonged duration) and exhibit a left bundle branch block-like morphology, common in biventricular pacing. There is an absence of discernible native P waves before the pacing spikes, suggesting either atrial pacing with a programmed AV delay or an underlying atrial arrhythmia like atrial fibrillation with a paced ventricular response. ST-segment and T-wave changes are present, which are secondary to the abnormal ventricular depolarization pattern. This ECG is a key diagnostic tool for evaluating pacemaker function and captured cardiac response in patients with heart failure and conduction system disease.
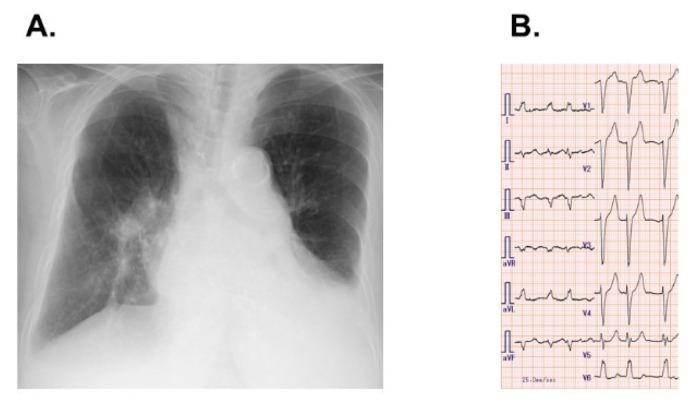
This composite diagnostic image features a posteroposterior chest X-ray (A) and a multi-lead electrocardiogram (B). The chest radiograph demonstrates mild cardiomegaly with a widened cardiac silhouette. There is prominent dilatation of the pulmonary artery segment, suggesting pulmonary hypertension. Bilateral blunting of the costophrenic angles is visible, consistent with mild pleural effusions, more pronounced on the left side. The electrocardiogram (ECG) tracing reveals an irregular ventricular rhythm without discernible P-waves, replaced by fine fibrillatory oscillations characteristic of atrial fibrillation. The QRS complexes are significantly widened with a morphology consistent with a complete left bundle branch block (LBBB), specifically showing deep S-waves in the right precordial leads (V1-V3) and broad, notched R-waves in the lateral leads (aVL, V5, V6). This combination of imaging and electrophysiological findings is highly relevant to cardiovascular medicine, particularly in the context of heart failure, pulmonary vascular disease, and rhythm management.
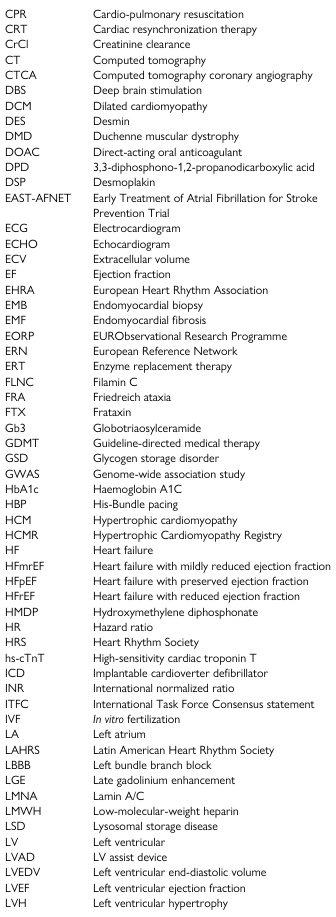
<table><tbody><tr><td>CPR</td><td>Cardio-pulmonary resuscitation</td></tr><tr><td>CRT</td><td>Cardiac resynchronization therapy</td></tr><tr><td>CrCl</td><td>Creatinine clearance</td></tr><tr><td>CT</td><td>Computed tomography</td></tr><tr><td>CTCA</td><td>Computed tomography coronary angiography</td></tr><tr><td>DBS</td><td>Deep brain stimulation</td></tr><tr><td>DCM</td><td>Dilated cardiomyopathy</td></tr><tr><td>DES</td><td>Desmin</td></tr><tr><td>DMD</td><td>Duchenne muscular dystrophy</td></tr><tr><td>DOAC</td><td>Direct-acting oral anticoagulant</td></tr><tr><td>DPD</td><td>3,3-diphosphono-1,2-propanodicarboxylic acid</td></tr><tr><td>DSP</td><td>Desmoplakin</td></tr><tr><td>EAST-AFNET</td><td>Early Treatment of Atrial Fibrillation for Stroke Prevention Trial</td></tr><tr><td>ECG</td><td>Electrocardiogram</td></tr><tr><td>ECHO</td><td>Echocardiogram</td></tr><tr><td>ECV</td><td>Extracellular volume</td></tr><tr><td>EF</td><td>Ejection fraction</td></tr><tr><td>EHRA</td><td>European Heart Rhythm Association</td></tr><tr><td>EMB</td><td>Endomyocardial biopsy</td></tr><tr><td>EMF</td><td>Endomyocardial fibrosis</td></tr><tr><td>EORP</td><td>EURObservational Research Programme</td></tr><tr><td>ERN</td><td>European Reference Network</td></tr><tr><td>ERT</td><td>Enzyme replacement therapy</td></tr><tr><td>FLNC</td><td>Filamin C</td></tr><tr><td>FRA</td><td>Friedreich ataxia</td></tr><tr><td>FTX</td><td>Frataxin</td></tr><tr><td>Gb3</td><td>Globotriaosylceramide</td></tr><tr><td>GDMT</td><td>Guideline-directed medical therapy</td></tr><tr><td>GSD</td><td>Glycogen storage disorder</td></tr><tr><td>GWAS</td><td>Genome-wide association study</td></tr><tr><td>HbA1c</td><td>Haemoglobin A1C</td></tr><tr><td>HBP</td><td>His-Bundle pacing</td></tr><tr><td>HCM</td><td>Hypertrophic cardiomyopathy</td></tr><tr><td>HCMR</td><td>Hypertrophic Cardiomyopathy Registry</td></tr><tr><td>HF</td><td>Heart failure</td></tr><tr><td>HFmrEF</td><td>Heart failure with mildly reduced ejection fraction</td></tr><tr><td>HFpEF</td><td>Heart failure with preserved ejection fraction</td></tr><tr><td>HFrEF</td><td>Heart failure with reduced ejection fraction</td></tr><tr><td>HMDP</td><td>Hydroxymethylene diphosphonate</td></tr><tr><td>HR</td><td>Hazard ratio</td></tr><tr><td>HRS</td><td>Heart Rhythm Society</td></tr><tr><td>hs-cTnT</td><td>High-sensitivity cardiac troponin T</td></tr><tr><td>ICD</td><td>Implantable cardioverter defibrillator</td></tr><tr><td>INR</td><td>International normalized ratio</td></tr><tr><td>ITFC</td><td>International Task Force Consensus statement</td></tr><tr><td>IVF</td><td>In vitro fertilization</td></tr><tr><td>LA</td><td>Left atrium</td></tr><tr><td>LAHRS</td><td>Latin American Heart Rhythm Society</td></tr><tr><td>LBBB</td><td>Left bundle branch block</td></tr><tr><td>LGE</td><td>Late gadolinium enhancement</td></tr><tr><td>LMNA</td><td>Lamin A/C</td></tr><tr><td>LMWH</td><td>Low-molecular-weight heparin</td></tr><tr><td>LSD</td><td>Lysosomal storage disease</td></tr><tr><td>LV</td><td>Left ventricular</td></tr><tr><td>LVAD</td><td>LV assist device</td></tr><tr><td>LVEDV</td><td>Left ventricular end-diastolic volume</td></tr><tr><td>LVEF</td><td>Left ventricular ejection fraction</td></tr><tr><td>LVH</td><td>Left ventricular hypertrophy</td></tr></tbody></table>
ECG in Heart Failure
Why the ECG Matters in HF
- Evaluate cardiac rhythm
- Identify current ischemia or prior myocardial infarction
- Detect evidence of left ventricular hypertrophy (LVH)
- Assess conduction system disease (e.g., bundle branch block)
- Guide device therapy eligibility (CRT, ICD)
Common ECG Findings in Heart Failure
1. Left Ventricular Hypertrophy (LVH)
- High-voltage QRS complexes (tall R in V5/V6, deep S in V1/V2)
- Voltage criteria: Sokolow-Lyon (SV1 + RV5 or V6 > 35 mm), Cornell criteria
- Lateral ST depression and T-wave inversion ("strain pattern")
- Supports hypertensive heart disease and HFpEF
2. Left Bundle Branch Block (LBBB)
- Wide QRS (>120 ms) with broad, notched R waves in I, aVL, V5, V6 and deep S waves in V1
- This is the most important ECG finding for device therapy eligibility
- Per Harrison's: "The single most important association of extent of dyssynchrony is a widened QRS interval, particularly in the presence of a LBBB pattern"
- LBBB + QRS >149 ms + HFrEF (EF ≤35%) = strong indication for CRT (Cardiac Resynchronization Therapy)
- CRT trials (CARE-HF, RAFT, MADIT-CRT) all used LBBB as a key inclusion criterion
3. Atrial Fibrillation (AF)
- Absent P waves, irregularly irregular rhythm, fibrillatory baseline
- AF is both a cause and consequence of HF
- Tachycardia-mediated cardiomyopathy: persistent rapid AF can cause reversible LV systolic dysfunction - rate/rhythm control can recover EF
4. Q Waves (Prior MI)
- Pathological Q waves suggest ischemic cardiomyopathy as the etiology
- Q waves in leads II, III, aVF = prior inferior MI; in V1-V4 = anterior MI
- Important for distinguishing ischemic from non-ischemic HF
5. Sinus Tachycardia
- A reflex response to reduced cardiac output
- Persistent tachycardia is a poor prognostic sign
6. Prolonged QTc
- Common in advanced HF, electrolyte disturbances (hypokalemia, hypomagnesemia), and with drugs used in HF (amiodarone, diuretics)
- Increases risk of ventricular arrhythmias and sudden cardiac death
7. Right Bundle Branch Block (RBBB)
- Less predictive benefit for CRT compared to LBBB
- May indicate right heart disease or pulmonary hypertension
- Per Harrison's: uncertainty surrounds CRT benefits in those with a predominant RBBB pattern
8. Non-specific ST/T Changes
- ST depression and T-wave flattening/inversion in lateral leads
- Common in LVH strain, ischemia, and medication effects (digoxin causes "reverse tick" ST depression)
9. Low Voltage
- QRS amplitude <5 mm in limb leads or <10 mm in precordial leads
- Suggests pericardial effusion, cardiac amyloidosis, or dilated cardiomyopathy
- Classic finding in cardiac amyloidosis: low voltage + LVH on echo (discordance)
10. Conduction Blocks and PR Prolongation
- First-degree AV block: common in HF patients on digoxin, beta-blockers
- Left anterior fascicular block: common with ischemic cardiomyopathy
ECG and CRT Eligibility (Clinical Significance)
| ECG Finding | Implication |
|---|---|
| LBBB + QRS >149 ms + EF ≤35% | Strong CRT indication |
| LBBB + QRS 120-149 ms + EF ≤35% | CRT may be beneficial |
| RBBB or non-LBBB | Less clear CRT benefit |
| Normal QRS (<120 ms) | No CRT benefit (consider CCM if EF 25-45%) |
| VT/VF on Holter | ICD consideration |
ECG Image: LBBB + Atrial Fibrillation in Heart Failure
ECG Image: LVH with Strain in Heart Failure
Key Teaching Points
- A normal ECG in a patient with suspected HF makes significant cardiac disease less likely (high negative predictive value)
- LBBB is the most action-guiding finding - it determines CRT eligibility
- AF in HF should prompt investigation for tachycardia-mediated cardiomyopathy (potentially reversible)
- Q waves suggest ischemic etiology - guide coronary workup
- Low voltage + LVH on echo = suspect amyloidosis
- Holter monitoring may be needed to assess arrhythmia burden (ventricular ectopy, ectopic tachycardia)