
What is angina pectoris
angina pectoris chest pain coronary artery disease diagram
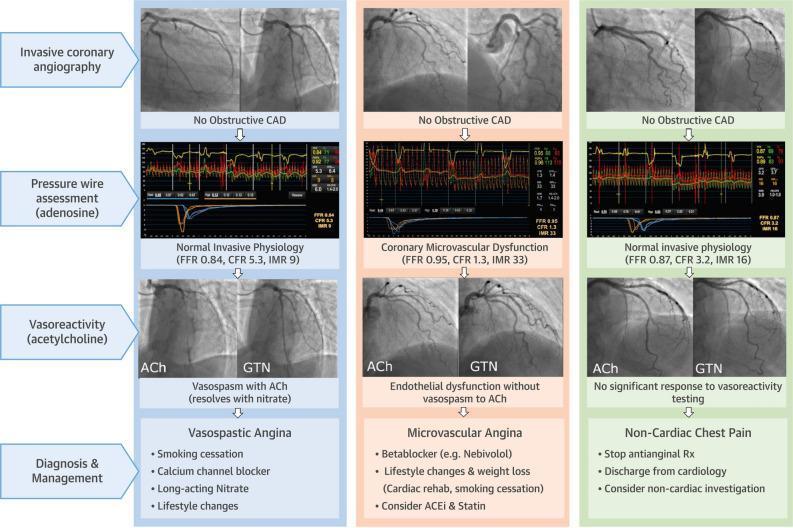
A multi-panel clinical infographic and flowchart illustrating the diagnostic pathway for Ischemia with Non-Obstructive Coronary Arteries (INOCA) through an Interventional Diagnostic Procedure (IDP). The graphic is organized into three vertical columns representing distinct clinical phenotypes: Vasospastic Angina, Microvascular Angina, and Non-Cardiac Chest Pain. Each column follows four sequential stages: (1) Invasive coronary angiography showing no obstructive coronary artery disease (CAD); (2) Pressure wire assessment with adenosine measuring physiological indices (FFR, CFR, and IMR); (3) Vasoreactivity testing with Acetylcholine (ACh) and Glyceryl Trinitrate (GTN); and (4) Final diagnosis and management strategies. The first column demonstrates Vasospastic Angina, characterized by ACh-induced vasospasm that resolves with GTN. The second column shows Microvascular Angina, defined by abnormal microvascular indices (low CFR, high IMR) and endothelial dysfunction without epicardial spasm. The third column depicts Non-Cardiac Chest Pain, where both physiology and vasoreactivity testing are normal. The diagram provides management recommendations for each phenotype, including calcium channel blockers for vasospasm and beta-blockers or lifestyle changes for microvascular dysfunction.
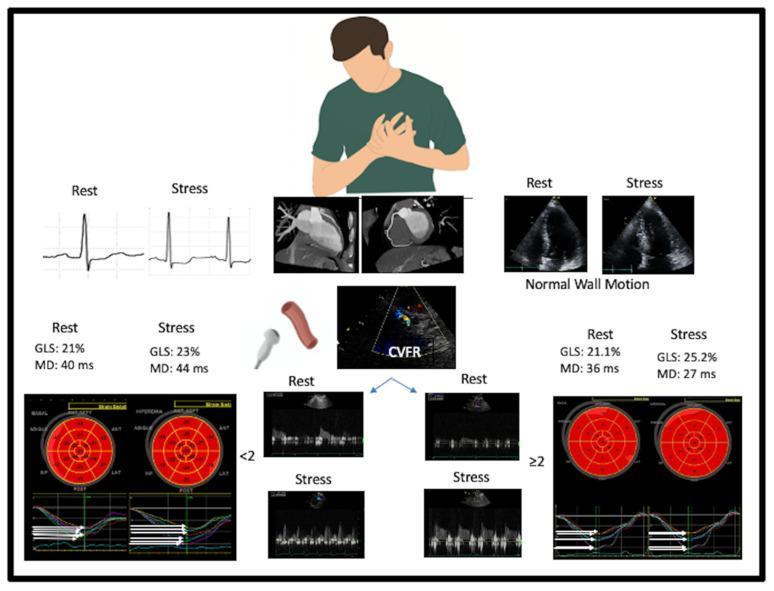
This medical illustration and clinical diagnostic panel outlines the assessment of coronary microvascular angina. The top section depicts a clinical presentation of chest pain alongside initial tests: ECG strips comparing 'Rest' and 'Stress' (showing ST-segment depression under stress), Multidetector Computed Tomography (MDCT) images of normal coronary arteries, and 2D stress echocardiography (SE) views demonstrating normal wall motion. The lower section details a functional assessment algorithm focused on Coronary Flow Velocity Reserve (CVFR). A color Doppler image transitions into two clinical pathways based on CVFR values. The left pathway (CVFR < 2) signifies a positive microvascular response, supported by Doppler velocity waveforms, strain bullseye plots, and time-based strain curves showing reduced Global Longitudinal Strain (GLS) and increased Mechanical Dispersion (MD) during stress. The right pathway (CVFR ≥ 2) indicates a negative response for microvascular dysfunction, characterized by augmented stress Doppler waveforms, improved GLS (25.2%), and reduced MD (27 ms). The diagram serves as an educational resource for differentiating coronary microvascular dysfunction from obstructive coronary disease using advanced echocardiographic strain and flow reserve parameters.
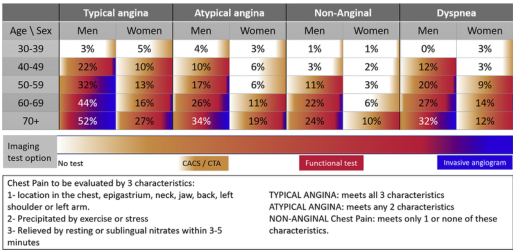
Summary : This figure presents a heat-map table showing the pre-test probability (%) of coronary artery disease (CAD) based on age, sex, and symptom type, along with recommended imaging test options. It also defines the criteria for typical angina, atypical angina, and non-anginal chest pain, and provides guidance for test selection. heat-map table: # Title & Axes : • No explicit title; content describes "Pre-test probability (%) of CAD by age, sex, and symptom type." • Row headers: Age groups (30-39, 40-49, 50-59, 60-69, 70+), with sub-rows for Men and Women. • Column headers: Symptom types (Typical angina, Atypical angina, Non-Anginal, Dyspnea), each split by Men and Women. • Bottom row: Imaging test option (No test, CACS/CTA, Functional test, Invasive angiogram). # Data Points : • Each cell contains a percentage value representing pre-test probability of CAD. • Example values: - Typical angina, Men, 30-39: 3% - Typical angina, Men, 70+: 52% - Atypical angina, Women, 60-69: 11% - Non-anginal, Men, 50-59: 11% - Dyspnea, Women, 70+: 12% • Imaging test options are color-coded: white (No test), yellow (CACS/CTA), red (Functional test), blue (Invasive angiogram). # Design Encodings : • Heat-map color gradient: white (low probability) to dark red/blue (high probability). • Imaging test options use distinct color bands below the table. • Definitions and criteria for chest pain types are provided in text boxes below the table. # Definitions & Criteria : • Chest pain evaluated by 3 characteristics: 1. Location (chest, epigastrium, neck, jaw, back, left shoulder/arm) 2. Precipitated by exercise or stress 3. Relieved by rest or sublingual nitrates within 3-5 minutes • Typical angina: meets all 3 characteristics • Atypical angina: meets any 2 characteristics • Non-anginal: meets only 1 or none # Analysis : • Pre-test probability of CAD increases with age and is generally higher in men than women for all symptom types. • Typical angina yields the highest probabilities, especially in older men (e.g., 52% for men 70+). • Non-anginal and dyspnea categories show lower probabilities, but still increase with age. • Imaging test recommendations escalate with increasing probability: no test for lowest risk, CACS/CTA for intermediate, functional test for higher, and invasive angiogram for highest risk. • The table provides a structured approach to selecting diagnostic tests based on patient demographics and symptom presentation.
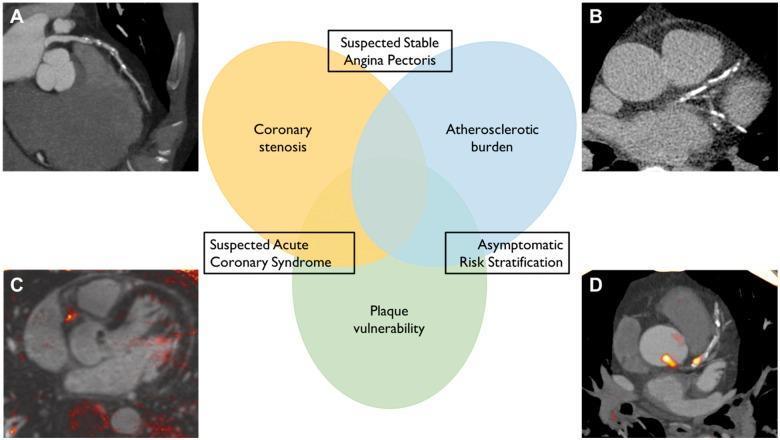
A multi-panel medical infographic and diagnostic imaging collage illustrating non-invasive coronary imaging modalities. The central feature is a Venn diagram highlighting three clinical objectives: coronary stenosis assessment (yellow), atherosclerotic burden quantification (blue), and plaque vulnerability identification (green). Overlapping regions link these objectives to clinical scenarios such as suspected stable angina pectoris, suspected acute coronary syndrome, and asymptomatic risk stratification. Surrounding the diagram are four diagnostic images: (A) a computed tomography angiography (CTA) showing coronary vessel morphology; (B) a coronary artery calcium (CAC) scan highlighting high-density calcified plaques; (C) a T1-weighted magnetic resonance coronary angiography showing potential intracoronary thrombus or intraplaque hemorrhage; and (D) a positron emission tomography (PET) scan utilizing radioactive tracers to map metabolic markers of plaque instability, indicated by focal orange/red hotspots. This educational visual demonstrates the complementary roles of CT, MRI, and PET in cardiology for evaluating ischemic heart disease and vascular health.
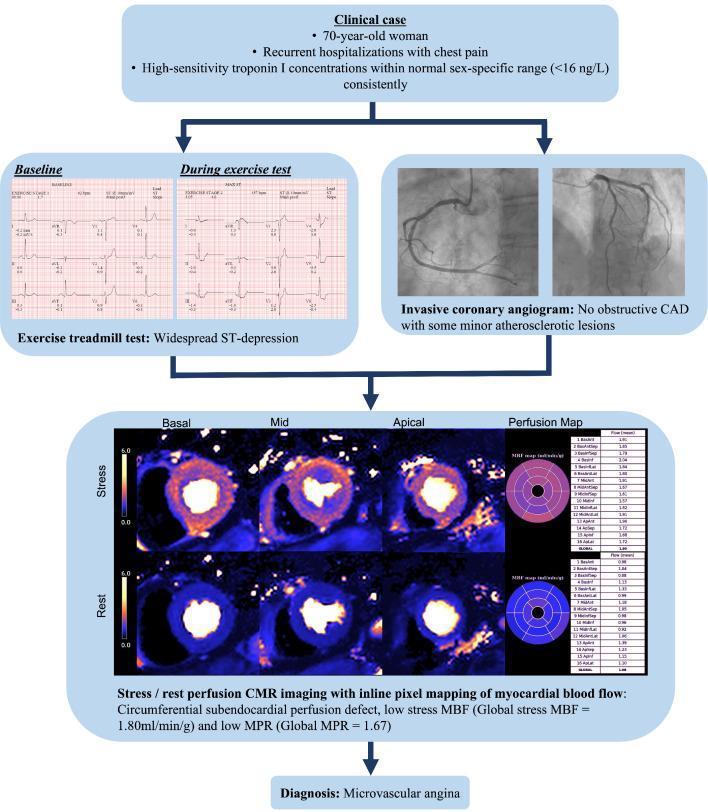
This composite educational graphic illustrates a clinical case of ischemia with non-obstructive coronary artery disease (INOCA), specifically microvascular angina. The presentation begins with clinical data from a 70-year-old female patient with recurrent chest pain and normal high-sensitivity troponin I. Diagnostic evidence is provided through four modalities. Top left: Exercise treadmill test strips comparing 'Baseline' to 'During exercise test,' showing widespread horizontal ST-segment depression indicative of inducible ischemia. Top right: Invasive coronary angiograms (ICA) of the right and left coronary arteries showing no obstructive coronary artery disease (CAD), only minor atherosclerotic plaque. Bottom: Stress/Rest perfusion Cardiac Magnetic Resonance (CMR) imaging with pixel-based myocardial blood flow (MBF) mapping. The short-axis basal, mid, and apical stress images demonstrate a circumferential subendocardial perfusion defect (darker blue/purple areas) compared to rest images. A quantitative perfusion map and data table accompany the CMR, reporting a low global stress MBF of 1.80 mL/min/g and a myocardial perfusion reserve (MPR) of 1.67. The collective evidence leads to the final diagnosis of microvascular angina.
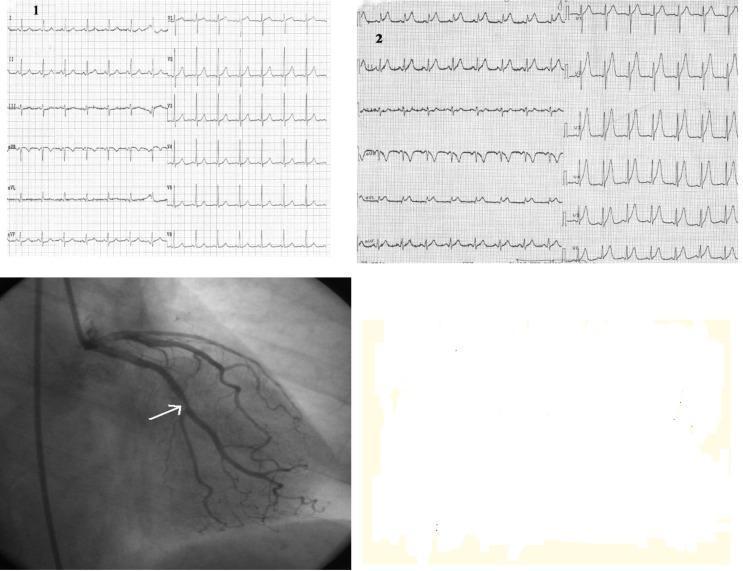
This composite figure presents a clinical case study of acute coronary syndrome through ECG comparison and invasive imaging. Panels 1 and 2 show 12-lead electrocardiogram (ECG) tracings. Panel 1 depicts a baseline sinus rhythm with normal repolarization. Panel 2, recorded during symptomatic chest pain, reveals significant ST-segment elevation in the high lateral (I, aVL) and precordial (V1-V6) leads, accompanied by hyperacute, tall, peaked T-waves, indicative of an acute anterolateral ST-elevation myocardial infarction (STEMI). Below the ECGs, a grayscale coronary angiogram (fluoroscopy) visualizes the left coronary artery system using radiopaque contrast. A white arrow points to a significant focal stenosis within the left circumflex coronary artery, specifically at the origin of the first marginal branch (Mg1). This visual combination illustrates the correlation between dynamic electrocardiographic changes during angina and the underlying obstructive coronary artery disease. The educational focus is on identifying acute ischemic patterns on ECG and their angiographic confirmation in the context of one-vessel coronary disease.
"angina pectoris" AND management
Angina Pectoris
Definition
- Robbins, Cotran & Kumar Pathologic Basis of Disease
- Harrison's Principles of Internal Medicine, 22E (2025)
Epidemiology
- Males make up ~70% of all angina patients, and an even greater proportion in those under 50
- Nearly 10 million Americans have angina pectoris; it is one of the most common manifestations of coronary artery disease (CAD)
- More than 85 million American adults have at least one form of cardiovascular disease
- The prevalence rises with age: ~25% of men and ~16% of women aged 60-79 have coronary heart disease
- Goldman-Cecil Medicine
Pathophysiology
- Demand angina: Increased myocardial oxygen requirements (from physical activity, emotion, or stress) outpace supply - most common in fixed coronary stenosis
- Supply angina: Reduced oxygen delivery to the heart, caused by coronary artery spasm, plaque disruption, or microvascular dysfunction
Types of Angina
1. Stable (Typical) Angina
- Most common form
- Caused by a fixed coronary artery stenosis limiting supply during increased demand
- Predictably triggered by exertion, emotional stress, cold exposure, or heavy meals
- Symptoms resolve within 1-5 minutes with rest or sublingual nitroglycerin
- Does not occur at rest
2. Prinzmetal (Variant) Angina
- Caused by coronary artery spasm, which can occur even in otherwise healthy vessels
- Occurs at rest, unrelated to heart rate or blood pressure
- Responds promptly to vasodilators (nitroglycerin, calcium channel blockers)
- Less common than stable angina
3. Unstable Angina
- Increasingly frequent, prolonged (>20 min), or severe chest pain
- Occurs with progressively less exertion or at rest
- Associated with plaque disruption, superimposed thrombosis, distal embolization, and/or vasospasm
- A medical emergency - harbinger of myocardial infarction (MI); portends high risk of complete coronary occlusion
- Treated aggressively to limit irreversible myocardial damage
Clinical Features
- Substernal heaviness, pressure, squeezing, smothering, or choking sensation - rarely described as frank "pain"
- Patient often places a clenched fist over the sternum (Levine's sign)
- Radiation to the left arm/shoulder, jaw, teeth, back, neck, or interscapular region
- Rarely radiates below the umbilicus or to the trapezius muscles (trapezius radiation is more typical of pericarditis)
- Duration: typically 2-5 minutes (up to 20 min for stable; >20 min suggests unstable or MI)
- Crescendo-decrescendo pattern (not at maximum intensity at onset)
- In women and diabetic patients, angina may be atypical in location or character
- "Silent ischemia" (no pain at all) is common in elderly patients and those with diabetic neuropathy - may present only as dyspnea, nausea, palpitations, diaphoresis, or fatigue
Severity Grading (Canadian Cardiovascular Society Scale)
| Class | Description |
|---|---|
| I | Angina only with strenuous/prolonged exertion |
| II | Slight limitation of ordinary activity (e.g., climbing >1 flight of stairs) |
| III | Marked limitation of ordinary activity |
| IV | Inability to perform any activity without angina; or angina at rest |
Pre-Test Probability of CAD by Symptom Type
| Type | Criteria |
|---|---|
| Typical angina | All 3: (1) substernal location, (2) provoked by exertion/stress, (3) relieved by rest/nitrates in <5 min |
| Atypical angina | Any 2 of the above 3 |
| Non-anginal chest pain | 0-1 of the above |
Diagnosis
- Resting ECG: May be normal between episodes; shows ST-segment depression during ischemia
- Exercise stress ECG: ST-segment depression ≥1 mm is the key finding; >2 mm depression at low workload indicates severe disease
- Stress imaging: Radionuclide perfusion (thallium-201, Tc-99m sestamibi), PET, or stress echocardiography for inconclusive ECG tests or inability to exercise
- CT coronary angiography / Invasive angiography: Definitive assessment of coronary anatomy
- Cardiac biomarkers: Normal in stable/Prinzmetal angina; elevated in unstable angina (indicating myocyte injury)
Treatment Overview
| Category | Agents |
|---|---|
| Nitrates | Sublingual nitroglycerin (acute relief); long-acting nitrates (prevention) |
| Beta-blockers | Reduce heart rate and myocardial O2 demand; first-line for stable angina |
| Calcium channel blockers | Especially useful in Prinzmetal (vasospastic) angina |
| Antiplatelet therapy | Aspirin, clopidogrel - reduce thrombosis risk |
| Statins | Stabilize plaques, reduce cardiovascular events |
| ACE inhibitors | Improve outcomes, especially with comorbid conditions |
| Revascularization | PCI (stenting) or CABG for refractory or high-risk disease |
Key Diagram
Summary
Recent evidence note (PubMed 2024-2026): A systematic review on INOCA (Ischemia with Non-Obstructive Coronary Arteries, PMID 39353703) highlights that a significant subset of angina patients have no obstructive disease on angiography - with vasospastic and microvascular mechanisms now better recognized and requiring specific diagnostic protocols and management strategies.