
Cardiac cycle complete and blood pressure measurement
cardiac cycle pressure volume diagram phases
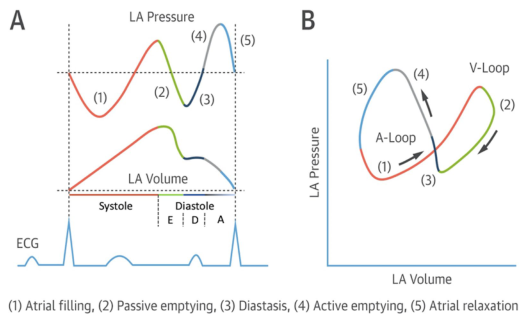
Summary : This figure illustrates the left atrial (LA) pressure-volume relationship during the cardiac cycle, showing both time-course traces and a pressure-volume loop, with key phases of atrial function annotated and correlated with the ECG. line plot and loop diagram: # Panel A: LA Pressure and Volume Traces • Top trace: LA Pressure (y-axis, arbitrary units) over time. • Middle trace: LA Volume (y-axis, arbitrary units) over time. • Bottom trace: ECG waveform for temporal reference. • X-axis: Cardiac cycle phases, with systole and diastole labeled; diastole further subdivided into E, D, and A phases. • Five phases are color-coded and numbered: – (1) Atrial filling (red) – (2) Passive emptying (green) – (3) Diastasis (black) – (4) Active emptying (blue) – (5) Atrial relaxation (gray) • Vertical dashed lines demarcate transitions between phases. # Panel B: LA Pressure-Volume Loop • X-axis: LA Volume (arbitrary units). • Y-axis: LA Pressure (arbitrary units). • The loop is traced in a counterclockwise direction, with arrows indicating the sequence. • The same five phases (1–5) are color-coded as in Panel A. • The loop is divided into two segments: A-Loop (phases 1, 3, 4, 5) and V-Loop (phase 2). # Design Encodings : • Distinct colors for each phase (red, green, black, blue, gray). • Arrows on the loop indicate the direction of the cardiac cycle. • ECG trace provides timing reference for the pressure and volume changes. # Analysis : • The LA pressure and volume traces show cyclical changes corresponding to atrial filling, emptying, and relaxation. • The pressure-volume loop visually summarizes the dynamic relationship between LA pressure and volume, with distinct segments for passive and active phases. • The figure highlights the temporal coordination between atrial events and the ECG, emphasizing the mechanical and electrical coupling in the cardiac cycle.
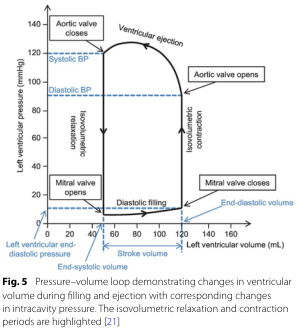
Summary : This figure shows a pressure–volume loop for the left ventricle, illustrating how ventricular volume and pressure change during the cardiac cycle, with key phases and valve events annotated. The isovolumetric relaxation and contraction periods are highlighted, and systolic/diastolic blood pressures are marked. pressure–volume loop diagram: # Title & Axes : • No explicit title on the figure, but the legend describes it as a "Pressure–volume loop demonstrating changes in ventricular volume during filling and ejection with corresponding changes in intracavity pressure." • X-axis: "Left ventricular volume (mL)" with tick marks at 0, 20, 40, 60, 80, 100, 120, 140, 160. • Y-axis: "Left ventricular pressure (mmHg)" with tick marks at 0, 20, 40, 60, 80, 100, 120, 140. • Additional axis labels: "Left ventricular end-diastolic pressure" (blue, left), "End-diastolic volume" (blue, bottom right), "Stroke volume" (black, bottom center). # Phases & Events : • Isovolumetric relaxation: vertical line at low volume, pressure drops, labeled. • Diastolic filling: horizontal line at low pressure, volume increases, labeled. • Isovolumetric contraction: vertical line at high volume, pressure rises, labeled. • Ventricular ejection: curved line, volume decreases as pressure peaks and falls, labeled. • Valve events: – Mitral valve opens (bottom left corner, low pressure/volume). – Mitral valve closes (bottom right corner, high volume/low pressure). – Aortic valve opens (top right corner, high volume/high pressure). – Aortic valve closes (top left corner, low volume/high pressure). # Blood Pressure Markers : • Systolic BP: horizontal dashed blue line at ~120 mmHg. • Diastolic BP: horizontal dashed blue line at ~80 mmHg. # Design Encodings : • Black solid lines for the loop. • Blue dashed lines for blood pressure markers. • Blue text for end-diastolic volume/pressure. • Labeled arrows for direction of phases and valve events. # Analysis : • The loop traces the cardiac cycle, starting at low pressure/volume (end-systolic), filling during diastole, rising sharply during isovolumetric contraction, ejecting blood during ventricular ejection, and dropping pressure during isovolumetric relaxation. • Systolic and diastolic blood pressures are marked, showing the pressure range during ejection. • The width of the loop (horizontal distance) represents stroke volume. • The figure clearly distinguishes the four main phases and the timing of valve openings/closings, providing a comprehensive view of ventricular mechanics during a heartbeat.
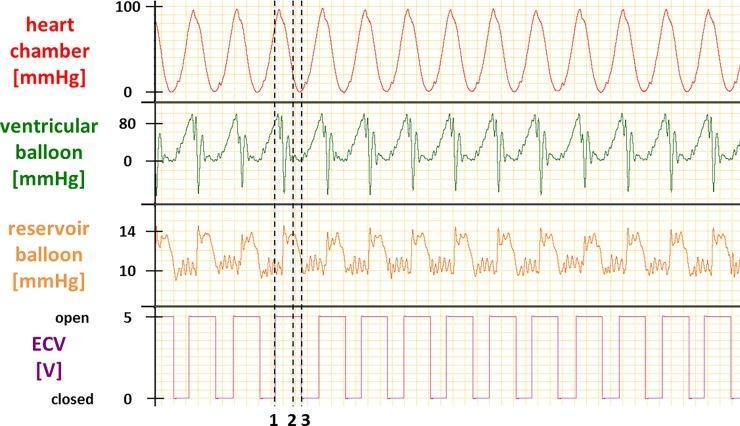
A multi-panel line graph illustrating the physiological mechanics of an in vitro cardiac loading device (CLD) used to simulate ventricular pressure-volume relationships. The visualization consists of four vertically aligned time-series plots depicting a cyclical cardiac simulator test. The top panel shows heart chamber pressure oscillating between 0 and 100 mmHg. The second panel displays ventricular balloon (VB) pressure, reaching peaks of approximately 80 mmHg. The third panel tracks reservoir balloon (RB) pressure, which fluctuates between 10 and 14 mmHg. The bottom panel indicates the status of an electronic check valve (ECV) as a binary voltage (0V for closed, 5V for open). Vertical dashed lines (labeled 1, 2, and 3) correlate specific phases: (1) ECV opening when VB pressure exceeds afterload, leading to VB emptying and RB filling; (2) VB refilling when VB pressure drops below RB pressure; and (3) ECV closure upon completion of refilling. This diagram is utilized in cardiovascular physiology research to validate cardiac cycle simulation for isolated heart preparations.
blood pressure measurement sphygmomanometer Korotkoff sounds
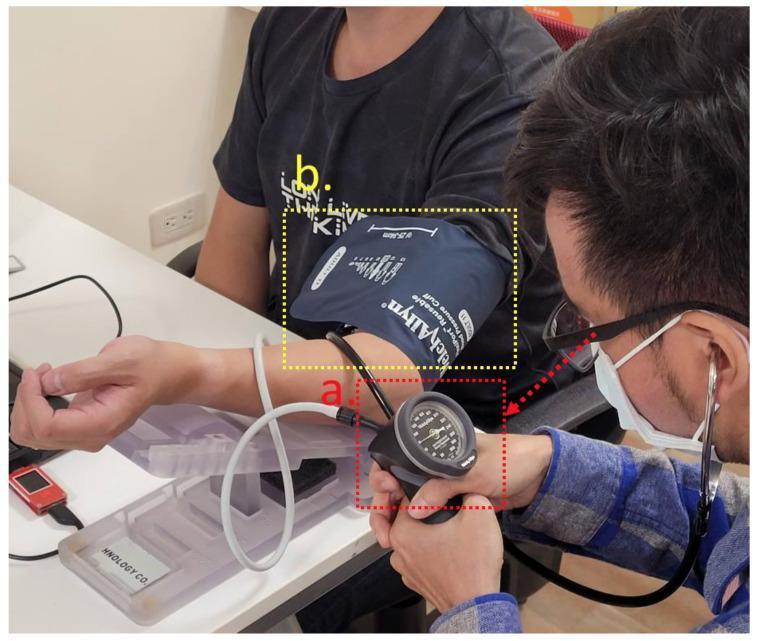
Clinical photograph demonstrating the auscultatory method of blood pressure measurement in a research or clinical setting. The image is divided into two highlighted sections: (a) shows a Welch Allyn DS66 aneroid sphygmomanometer, featuring a circular gauge with a black face and white numerical scale, connected to a black rubber inflation bulb held by a researcher. (b) displays a dark blue reusable adult blood pressure cuff (Welch Allyn) secured around the subject's left upper arm. A stethoscope chest piece is placed over the brachial artery beneath the distal edge of the cuff to detect Korotkoff sounds. The researcher is shown wearing the stethoscope and manually inflating the cuff. This visual illustrates the gold standard for non-invasive blood pressure monitoring used to validate novel pulse wave sensors and algorithms. Key educational concepts include proper cuff placement, manual sphygmomanometry technique, and clinical cardiovascular assessment.
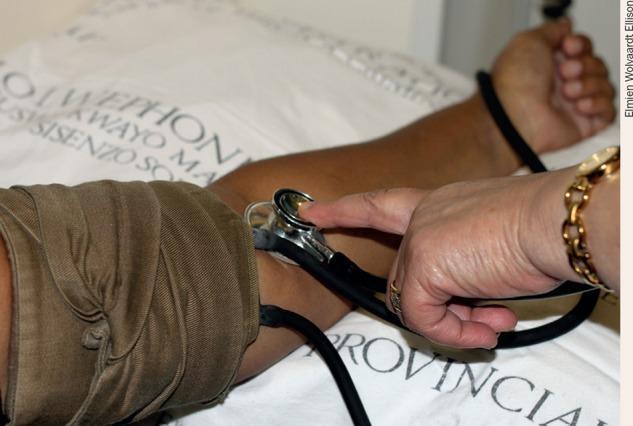
This clinical photograph demonstrates the manual assessment of blood pressure using a sphygmomanometer and an acoustic stethoscope. The image shows a healthcare provider's hand stabilizing a metal stethoscope diaphragm over the patient's antecubital fossa, specifically positioned over the brachial artery to auscultate Korotkoff sounds. A brown fabric inflatable cuff is securely wrapped around the patient's upper arm, proximal to the stethoscope placement. The patient's arm is resting on a white hospital bedsheet with printed black text. Key anatomical landmarks include the inner elbow (antecubital space) and the distal upper arm. This visual serves as an educational aid for clinical skills training, illustrating the correct placement of instruments for non-invasive blood pressure (NIBP) measurement. The medical specialty is general medicine or nursing, focusing on basic physiological monitoring and clinical examination techniques.
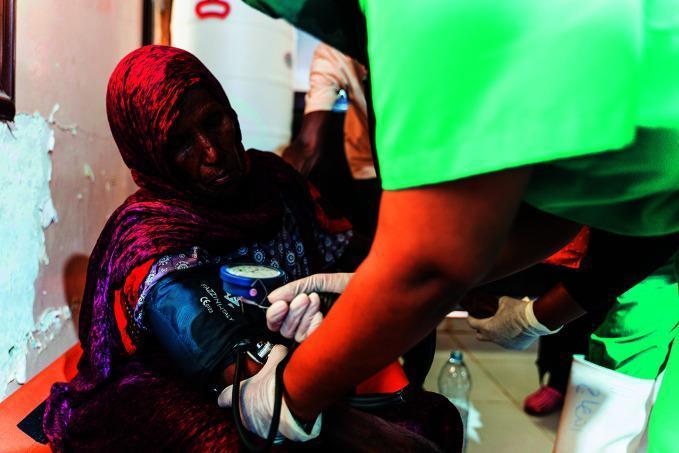
This clinical photograph captures a healthcare interaction in a field medical setting, specifically a cholera treatment center. The image shows a healthcare provider performing a non-invasive blood pressure measurement on a seated adult female patient. The clinician, wearing nitrile gloves and green scrubs, has positioned an aneroid sphygmomanometer cuff on the patient's left upper arm. A visible blue-faced manual pressure gauge is attached to the cuff. The provider is simultaneously using a stethoscope (partially visible) for auscultation of Korotkoff sounds to determine systolic and diastolic values. This scene illustrates vital sign monitoring as a critical component of clinical assessment and hemodynamic stabilization in infectious disease management, particularly for monitoring dehydration levels in cholera patients. The setting emphasizes healthcare delivery in resource-limited or humanitarian crisis environments.
cardiac cycle Wiggers diagram pressure aorta ventricle atrium ECG heart sounds
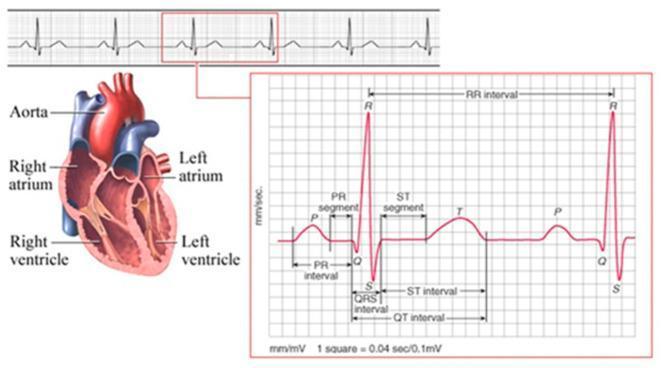
This composite educational illustration combines an anatomical diagram of the human heart with a diagnostic Electrocardiogram (ECG) tracing to demonstrate cardiac physiology. On the left, a coronal cross-section of the heart identifies the Aorta, Right Atrium, Left Atrium, Right Ventricle, and Left Ventricle. The right side features a detailed ECG waveform analysis set against a standard measurement grid (1 square = 0.04 sec / 0.1 mV). The tracing identifies key electrophysiological components: the P wave (atrial depolarization), QRS complex (ventricular depolarization), and T wave (ventricular repolarization). Critical diagnostic intervals and segments are explicitly labeled, including the PR interval, PR segment, QRS interval, ST segment, ST interval, QT interval, and the RR interval (representing the heart rate). This comparison chart and pathophysiology diagram serve as an introductory resource for understanding the correlation between cardiac anatomy and the electrical signals recorded during a cardiac cycle, suitable for basic to intermediate medical education.
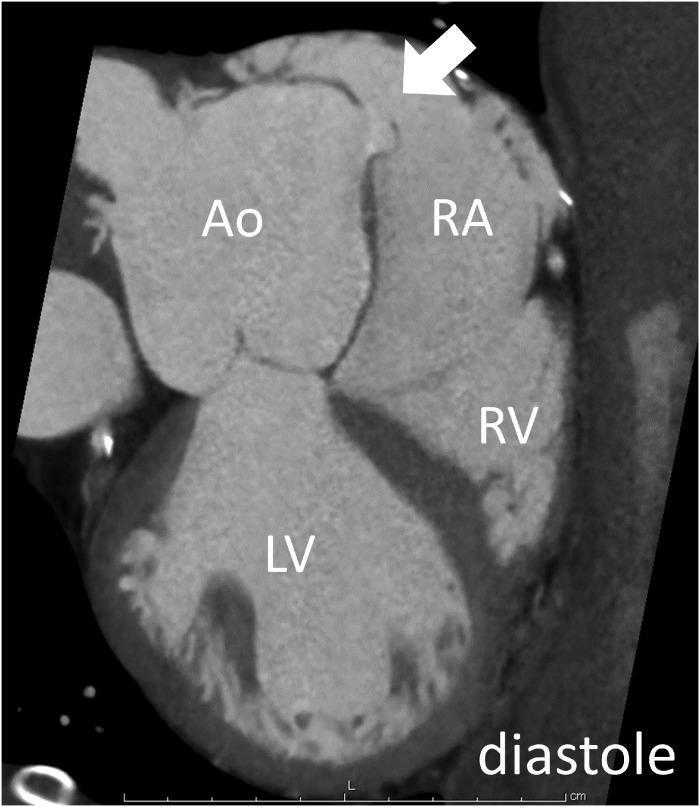
This diagnostic image is an electrocardiogram (ECG)-gated cardiac computed tomography (CCT) cine mode reconstruction captured during the diastolic phase of the cardiac cycle. The cross-sectional view displays the four major cardiac chambers and associated structures labeled as follows: Aorta (Ao), Right Atrium (RA), Right Ventricle (RV), and Left Ventricle (LV). A prominent white arrow indicates a flap-type rupture in the wall between the non-coronary cusp of the aorta and the right atrium. This visual evidence confirms a ruptured sinus of Valsalva aneurysm (SVA), showing an abnormal communication where the flap opens into the right atrium during diastole. The spatial arrangement shows the dilated aorta adjacent to a widened right atrium, with the right ventricle and thick-walled left ventricle positioned inferiorly. This image illustrates the pathophysiology of an intracardiac shunt causing a left-to-right flow, relevant for cardiologists and radiologists studying complex congenital or acquired structural heart defects and their presentation in cross-sectional imaging.
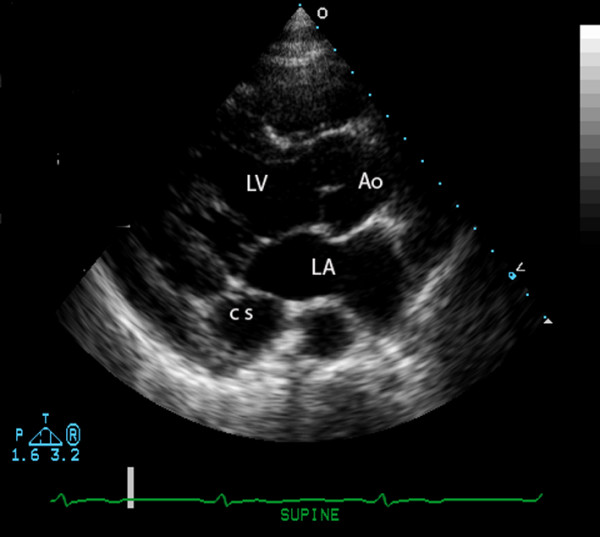
**Modality:** Transthoracic Echocardiogram (TTE). **View:** Parasternal Long-Axis (PLAX) view. **Anatomical Landmarks:** The image displays the left ventricle (LV), left atrium (LA), and the aortic root (Ao). The descending thoracic aorta is partially visible in the far field. **Observed Pathology:** There is a prominent, dilated coronary sinus (CS) visualized in cross-section within the atrioventricular groove, posterior to the left atrium and anterior to the descending aorta. **Visual Features:** The coronary sinus appears as a distinct, enlarged circular anechoic structure. The surrounding cardiac chambers (LV, LA, Ao) maintain their relative anatomical positions. An electrocardiogram (ECG) lead trace is visible at the bottom of the frame, indicating the timing within the cardiac cycle. **Clinical Context/Differentiating Features:** A dilated coronary sinus is a characteristic finding often associated with increased right atrial pressure or persistent left superior vena cava (PLSVC). This image serves as a diagnostic reference for identifying venous anomalies or volume/pressure overload in the right heart system via standard parasternal imaging.
Cardiac Cycle - Complete Overview & Blood Pressure Measurement
PART 1: THE CARDIAC CYCLE
Definition
Duration (s/beat) = 60 (s/min) ÷ Heart rate (beats/min)
- Systole occupies ~300 ms (~0.4 of cycle at 72 bpm)
- Diastole occupies ~500 ms (~0.6 of cycle)
Initiation of Each Cycle
- Rapidly through both atria (causing atrial contraction)
- Into the AV node - delayed >0.1 second (allows atrial contraction to fill ventricles)
- Down the AV bundle (Bundle of His) into the ventricles
The Four Phases of the Cardiac Cycle
| Phase | Valves | Events | Part of Cycle |
|---|---|---|---|
| 1 - Inflow (Diastolic filling) | AV valves OPEN, semilunar CLOSED | Rapid ventricular filling → diastasis → atrial contraction | Diastole |
| 2 - Isovolumetric Contraction | All valves CLOSED | Ventricles contract; pressure rises; no blood flow; no volume change | Systole |
| 3 - Outflow (Ventricular ejection) | Semilunar valves OPEN, AV valves CLOSED | Rapid ejection → reduced ejection | Systole |
| 4 - Isovolumetric Relaxation | All valves CLOSED | Ventricles relax; pressure falls; no blood flow; no volume change | Diastole |
Phase-by-Phase Detail
Phase 1 - Ventricular Filling (Diastole)
- AV valves open when atrial pressure exceeds ventricular pressure
- Three sub-phases:
- Rapid filling - most filling occurs here (passive flow down pressure gradient)
- Diastasis - slow/reduced filling as pressures equalize
- Atrial contraction ("atrial kick") - adds ~20-30% additional filling; the "a" wave of the JVP
- At end of filling = End-Diastolic Volume (EDV) ~ 120-130 mL
Clinical note: In atrial fibrillation, the atrial kick is lost. In a healthy heart this may be tolerated; in a compromised myocardium (ischemic heart disease, mitral stenosis), this loss can precipitate congestive heart failure or shock.
Phase 2 - Isovolumetric Contraction (Systole begins)
- Triggered by ventricular depolarization (QRS complex on ECG)
- AV valves close when ventricular pressure exceeds atrial pressure → S1 heart sound ("lub")
- Both valves closed → pressure rises sharply with no change in volume
- Ends when ventricular pressure exceeds aortic/pulmonary pressure → semilunar valves open
Phase 3 - Ventricular Ejection (Systole)
- Semilunar valves open → blood ejected into aorta and pulmonary artery
- Two sub-phases:
- Rapid ejection - fast shortening, peak aortic pressure (~120 mmHg = systolic BP)
- Reduced ejection - slower shortening, pressure begins to fall
- Not all blood is ejected: Stroke Volume (SV) = EDV - ESV (~70 mL at rest)
- Ejection Fraction (EF) = SV/EDV = 70/130 = ~55% (normal ≥55%)
- Ends when aortic pressure exceeds ventricular pressure → semilunar valves close → S2 heart sound ("dub")
Phase 4 - Isovolumetric Relaxation (Diastole begins)
- Both valves closed; ventricular pressure drops rapidly
- No change in volume
- Ends when ventricular pressure falls below atrial pressure → AV valves open and cycle repeats
Pressure Changes During the Cardiac Cycle
| Chamber | Pressure range |
|---|---|
| Left ventricle (systole) | 0-120 mmHg |
| Left ventricle (diastole/EDP) | ~8-12 mmHg |
| Aorta (systolic/diastolic) | ~120/80 mmHg |
| Left atrium (mean) | ~7-8 mmHg |
| Right ventricle (systole) | 0-25 mmHg |
| Pulmonary artery | ~25/8 mmHg |
Heart Sounds
| Sound | Cause | Timing |
|---|---|---|
| S1 ("lub") | Closure of mitral + tricuspid valves | Start of systole (end of phase 1) |
| S2 ("dub") | Closure of aortic + pulmonary valves | End of systole (start of phase 4) |
| S3 (ventricular gallop) | Rapid ventricular filling; may be normal in young/athletes or pathological in heart failure | Early diastole |
| S4 (atrial gallop) | Stiff ventricle during atrial contraction; always pathological | Late diastole |
ECG Correlation with Cardiac Cycle
| ECG Event | Mechanical Event |
|---|---|
| P wave | Atrial depolarization → atrial contraction |
| PR interval | AV nodal delay |
| QRS complex | Ventricular depolarization → isovolumetric contraction begins |
| ST segment | Plateau of ventricular action potential |
| T wave | Ventricular repolarization → relaxation begins |
Pressure-Volume Loop (Left Ventricle)
- Width of the loop = Stroke Volume
- Height = peak systolic pressure
- Four corners = four valve events (mitral opens → mitral closes → aortic opens → aortic closes)
PART 2: BLOOD PRESSURE MEASUREMENT
What Blood Pressure Represents
- Systolic BP (SBP): Maximum pressure in the aorta during ventricular ejection (~120 mmHg normal)
- Diastolic BP (DBP): Minimum aortic pressure during ventricular relaxation (~80 mmHg normal)
- Pulse pressure = SBP - DBP = ~40 mmHg
- Mean arterial pressure (MAP) = DBP + (Pulse pressure/3) ≈ 93 mmHg
The Auscultatory Method (Sphygmomanometry)
- Inflate cuff above expected SBP (>120 mmHg) to completely occlude the brachial artery
- Place stethoscope over the brachial artery in the cubital fossa (antecubital fossa)
- Slowly deflate the cuff (~2-3 mmHg/sec)
- First Korotkoff sound heard = Systolic BP (thumping sound as blood first squirts through)
- Sounds continue as cuff pressure drops further
- Sounds disappear (muffling then silence) = Diastolic BP (flow becomes laminar again)
Korotkoff Sounds (5 Phases)
| Phase | Sound | Reading |
|---|---|---|
| Phase I | Clear tapping sounds first heard | = Systolic BP |
| Phase II | Softer, swishing/murmur-like sounds | Between SBP and DBP |
| Phase III | Crisper, louder tapping | - |
| Phase IV | Muffled, blowing sounds | (sometimes used as DBP in special cases) |
| Phase V | Sounds disappear completely | = Diastolic BP |
In pregnancy and conditions with high cardiac output, Phase V may not be reached - Phase IV is used as DBP.
Standardized Office BP Measurement Protocol
- No caffeine, smoking, alcohol, or exercise
- Avoid a full bladder
- Rest quietly for 3-5 min before reading
- No talking or phone use during rest and measurement
- Seated in chair with upright back support
- Feet flat on the floor
- Arm supported at heart level (cuff at mid-brachial level)
- Use a clinically validated oscillometric device (preferred over manual)
- Correct cuff size: cuff bladder should encircle 80% of the arm
- At first visit: measure both arms and use the higher reading arm for subsequent visits
- Take 2+ readings at each visit, separated by 1-2 min
- Average the readings
- Classify based on the average of 2+ visits
ACC/AHA Blood Pressure Classification (Adults)
| Category | Systolic (mmHg) | Diastolic (mmHg) | |
|---|---|---|---|
| Normal | < 120 | and | < 80 |
| Elevated | 120-129 | and | < 80 |
| Stage 1 Hypertension | 130-139 | or | 80-89 |
| Stage 2 Hypertension | ≥ 140 | or | ≥ 90 |
Types of Blood Pressure Measurement
| Method | Description | Use |
|---|---|---|
| Office/Clinic BP | Manual or automated, in-office | Standard; most evidence base |
| Home BP Monitoring (HBPM) | Self-measured at home | Detect white-coat / masked hypertension |
| Ambulatory BP Monitoring (ABPM) | 24-hr continuous cuff monitoring | Gold standard for true BP profile |
| Invasive (arterial line) | Intra-arterial catheter | ICU, cardiac surgery |
Common Measurement Errors
| Error | Effect on BP |
|---|---|
| Cuff too small | Falsely elevated SBP |
| Cuff too large | Falsely low SBP |
| Arm below heart level | Falsely elevated |
| Arm above heart level | Falsely low |
| Recent exercise/caffeine | Falsely elevated |
| Talking during measurement | Falsely elevated |
| Not resting 5 min before | Falsely elevated |
| "Auscultatory gap" | May miss true SBP if not inflating high enough |
On average, SBP is overestimated by ~7 mmHg in routine clinical practice, causing a 15-20% overestimation of hypertension prevalence. (Harrison's 22E)
Special Situations
- Orthostatic hypotension: BP measured lying, then standing after 1 and 3 min. A drop of ≥20 mmHg SBP or ≥10 mmHg DBP is diagnostic.
- Auscultatory gap: A silent interval in Korotkoff sounds between phases I and II; can lead to underestimation of SBP if cuff not inflated high enough - always palpate the radial pulse first to estimate SBP before auscultation.
- Coarctation of the aorta: BP in legs < BP in arms (normally legs are 10-20 mmHg higher).
- Pulsus paradoxus: >10 mmHg drop in SBP during inspiration; seen in cardiac tamponade, severe asthma.
Summary Diagram - Key Relationships
SA Node fires
    ↓
P wave (atrial depolarization) → Atrial contraction → "Atrial kick"
    ↓
PR delay (AV node)
    ↓
QRS complex → Isovolumetric contraction → AV valves close → S1
    ↓
LV pressure > Aortic pressure → Aortic valve opens → Ejection begins
Peak LV pressure = Systolic BP (~120 mmHg)
    ↓
T wave → Ventricular repolarization/relaxation
    ↓
Aortic pressure > LV pressure → Aortic valve closes → S2 → Diastolic BP (~80 mmHg)
    ↓
Isovolumetric relaxation → AV valves open → Diastolic filling → cycle repeats
Can a prescribe vitamin d, dolo 650,and multivitamin at a time
paracetamol 650 vitamin D multivitamin drug interaction safe co-prescribe
Can You Co-Prescribe Vitamin D + Dolo 650 + Multivitamin?
What Each Drug Is
| Drug | Active ingredient | Category |
|---|---|---|
| Dolo 650 | Paracetamol (acetaminophen) 650 mg | Analgesic / antipyretic |
| Vitamin D | Cholecalciferol (D3) or Ergocalciferol (D2) | Fat-soluble vitamin supplement |
| Multivitamin | Vitamins A, B-complex, C, D, E, K + minerals | Nutritional supplement |
Drug Interactions Between These Three
Key Cautions to Keep in Mind
1. Vitamin D Duplication (Most Important!)
- Nausea, vomiting, weakness, fatigue
- Polyuria, polydipsia
- Constipation, anorexia
- In severe cases: nephrocalcinosis, renal failure, cardiac arrhythmias
Supplementation of vitamin D in patients with normal 25-OH D levels is ineffective and may lead to fatigue and weakness from toxicity. - Goldman-Cecil Medicine
- Prescribe a lower-dose Vitamin D supplement, OR
- Space out dosing, OR
- Simply rely on the Vitamin D in the multivitamin alone if the patient isn't deficient
2. Paracetamol Dose Caution (Liver Safety)
- Adults (normal): 4000 mg/day (≤6 tablets of 650 mg/day)
- Elderly / liver disease / alcoholism / malnutrition / fasting: Reduce to 2000 mg/day
3. Fat-Soluble Vitamins in Multivitamin
Practical Prescribing Tips
| Scenario | Recommendation |
|---|---|
| Fever/pain + general deficiency | Dolo 650 TDS + Multivitamin OD + Vitamin D (check overlap with multivit) |
| Documented Vitamin D deficiency | Check 25-OH Vitamin D level first; dose accordingly (1000-2000 IU/day or 60,000 IU/week x 8 weeks) |
| Routine wellness prescription | Multivitamin alone usually sufficient; no need for separate Vitamin D unless deficient |
| Patient on other paracetamol products | Count total paracetamol dose; do not exceed 4 g/day |
| Alcoholic / liver disease patient | Use lowest effective paracetamol dose or avoid; prefer ibuprofen cautiously or tramadol |
Bottom Line
- Dolo 650 + Vitamin D + Multivitamin = No direct drug interaction. Safe to co-prescribe.
- Main concern = Vitamin D duplication (multivitamin already contains D - check the label)
- Second concern = Total paracetamol dose - ensure no doubling from other combo products
- Always check the patient's 25-OH Vitamin D level before starting high-dose Vitamin D to avoid toxicity
- In routine practice (e.g., fever with nutritional deficiency), this is a very commonly and safely prescribed combination