
Bening or malignant which is more dangerous
- Benign tumors grow slowly, stay localized, do not invade nearby tissue, and do not spread (metastasize) to other parts of the body. They are rarely life-threatening, though they can cause problems by pressing on nearby structures.
- Malignant tumors (cancer) invade surrounding tissues, can spread through the bloodstream or lymphatic system to distant organs (metastasis), grow rapidly, and are much harder to treat once they spread. They can be fatal if not caught and treated early.
benign vs malignant tumor comparison diagram
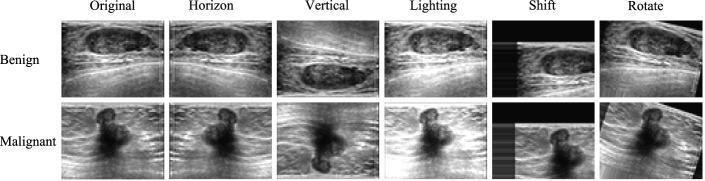
A comparison chart showing breast ultrasound (BUS) images of benign and malignant tumors, demonstrating various data augmentation techniques for deep learning models. The chart is organized into two rows (Benign and Malignant) and six columns representing different image states: Original, Horizon (horizontal flip), Vertical (vertical flip), Lighting (brightness adjustment), Shift (spatial translation with padding), and Rotate. The 'Original' benign tumor is characterized by an oval, circumscribed shape with smooth margins and a relatively homogeneous internal echotexture. In contrast, the 'Original' malignant tumor demonstrates an irregular, non-parallel orientation (taller-than-wide) with spiculated or angular margins and significant internal heterogeneity, indicating potential infiltration. Each augmentation column illustrates how the visual features are transformed: 'Horizon' and 'Vertical' flips change the spatial orientation, 'Lighting' modifies the echogenicity contrast, 'Shift' introduces black-masked boundaries, and 'Rotate' alters the lesion's angle relative to the transducer plane. This educational visual is designed to showcase how varied data inputs help train neural networks like Fus2Net for robust clinical diagnostic classification.
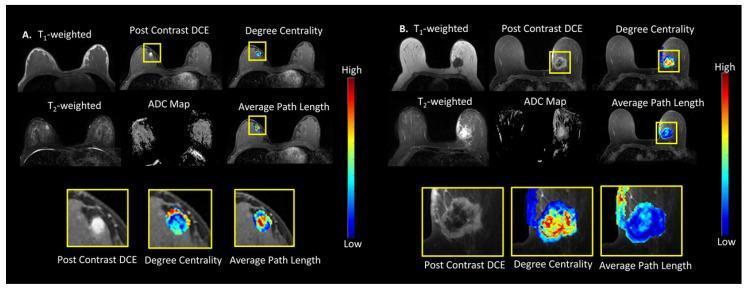
This Comparison Chart illustrates multiparametric breast MRI (mpMRI) and tumor connectomics for a benign vs. malignant lesion. Panel (A) displays a benign fibroadenomatous change in a 27-year-old female, characterized by a small, well-defined lesion with high ADC (1.54 × 10⁻³ mm²/s) and homogeneous signal on T1-weighted and Post-Contrast DCE images. Panel (B) shows an infiltrating ductal carcinoma in a 56-year-old female, featuring a larger, irregular mass with restricted diffusion (ADC 0.68 × 10⁻³ mm²/s) and heterogeneous enhancement. The images include T1-weighted, T2-weighted, Post-Contrast Dynamic Contrast-Enhanced (DCE), and Apparent Diffusion Coefficient (ADC) maps. Integrated Tumor Connectomics Framework (TCF) maps overlay 'Degree Centrality' and 'Average Path Length' metrics using a colorimetric scale (blue = low, red = high). The malignant lesion demonstrates significantly different network topography, with larger, more diffuse areas of varying centrality and altered average path length compared to the focal patterns seen in the benign lesion, highlighting the use of graph theoretic metrics in oncological imaging and diagnostic radiology.
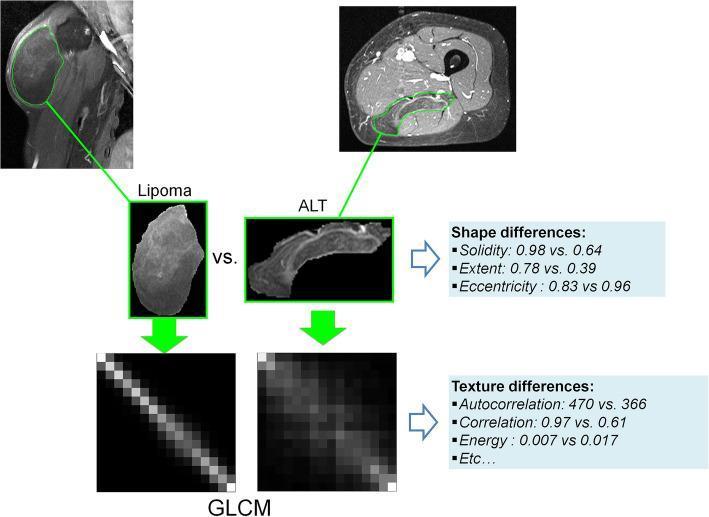
This infographic demonstrates the radiomics pipeline for differentiating benign lipomas from malignant Atypical Lipomatous Tumors (ALT) using MRI. The image includes fat-suppressed enhanced MR images of the shoulder and thigh, showing green binary tumor masks applied to representative lesions. A side-by-side comparison highlights morphology: the lipoma is presented as a well-defined, ovoid mass, while the ALT is depicted as an irregular, elongated structure. These visual markers are supported by quantitative shape radiomics, including solidity (0.98 vs. 0.64), extent (0.78 vs. 0.39), and eccentricity (0.83 vs. 0.96). The lower section of the diagram illustrates texture analysis via the Gray-Level Co-occurrence Matrix (GLCM). The lipoma GLCM displays a highly organized, linear diagonal pattern, whereas the ALT GLCM shows a dispersed, heterogeneous distribution. Quantitative texture metrics include autocorrelation (470 vs. 366), correlation (0.97 vs. 0.61), and energy (0.007 vs. 0.017). This visualization emphasizes how radiomic features can objectively characterize soft tissue tumors in musculoskeletal radiology.
Benign vs. Malignant: Which Is More Dangerous?
The Three Key Differences (from Robbins Pathology)
"Three features can be used to distinguish between most benign and malignant tumors: differentiation and anaplasia; local invasion; and metastasis."
1. Differentiation and Anaplasia
| Feature | Benign | Malignant |
|---|---|---|
| Cell appearance | Well-differentiated; resemble normal cells closely | Poorly differentiated or anaplastic (do not resemble parent cells) |
| Mitoses | Rare, normal configuration | Frequent, abnormal mitotic figures |
| Stroma | Normal | May induce dense fibrous stroma (desmoplasia), creating hard "scirrhous" tumors |
- A lipoma (benign) is made of mature fat cells that look essentially normal.
- A liposarcoma (malignant) has bizarre, undifferentiated cells with no normal fat cell appearance.
2. Local Invasion
| Feature | Benign | Malignant |
|---|---|---|
| Capsule | Usually well-encapsulated | No true capsule; infiltrates surrounding tissue |
| Growth | Expansile, pushes away adjacent tissue | Invades and destroys adjacent tissue |
| Surgical removal | Usually complete and curative | Margins are difficult to clear; recurrence common |
3. Metastasis - The Most Dangerous Feature
- Lymphatic spread - more common in carcinomas (e.g., breast cancer to axillary lymph nodes)
- Hematogenous spread - favored by sarcomas; tumor cells enter bloodstream and seed distant organs
- Seeding of body cavities - e.g., ovarian cancer spreading across peritoneal surfaces
Side-by-Side Summary Table
| Property | Benign | Malignant |
|---|---|---|
| Growth rate | Slow | Often rapid |
| Cell differentiation | Well-differentiated | Poorly differentiated / anaplastic |
| Capsule | Present (encapsulated) | Absent |
| Local invasion | No | Yes |
| Metastasis | Never | Yes - hallmark feature |
| Recurrence after removal | Rare | Common |
| Life-threatening potential | Low (usually) | High |
| Treatment difficulty | Usually straightforward | Often complex, multimodal |
When Can Benign Tumors Be Dangerous?
- Location matters - a benign brain tumor (e.g., meningioma) can compress vital brain structures and be life-threatening
- Hormone secretion - a benign adrenal adenoma that secretes excess aldosterone or cortisol causes systemic disease
- Obstruction - a benign tumor blocking the bile duct or airway can cause organ failure
Naming Convention (Benign vs. Malignant)
| Tissue Origin | Benign | Malignant |
|---|---|---|
| Fat | Lipoma | Liposarcoma |
| Cartilage | Chondroma | Chondrosarcoma |
| Bone | Osteoma | Osteosarcoma |
| Smooth muscle | Leiomyoma | Leiomyosarcoma |
| Glands/ducts | Adenoma | Adenocarcinoma |
| Blood vessels | Hemangioma | Angiosarcoma |
| Melanocytes | Nevus (mole) | Melanoma |