Liver function test

Reading File
Finding Sources
Finding Sources
Searching Images

liver function tests interpretation bilirubin ALT AST

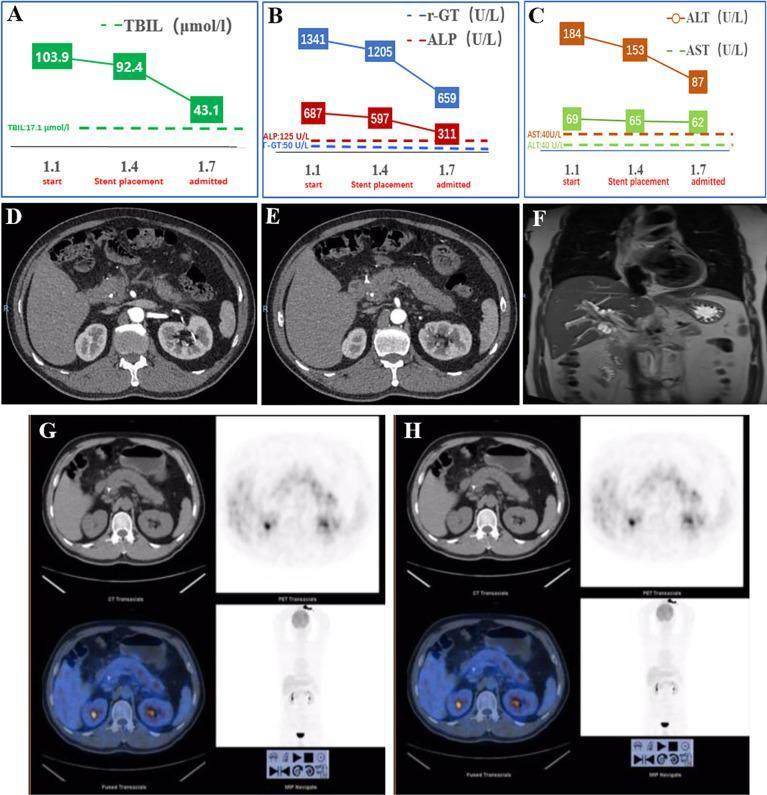
A multi-panel figure illustrating diagnostic findings and clinical progression for a biliary obstruction and pancreatitis case. (A-C) Line graphs track liver function tests, showing a downward trend in total bilirubin (TBIL), gamma-glutamyl transpeptidase (γ-GT), alkaline phosphatase (ALP), alanine aminotransferase (ALT), and aspartate aminotransferase (AST) from initial presentation through biliary stent placement to admission. (D, E) Axial contrast-enhanced CT scans of the abdomen show a hyperdense biliary stent within the common bile duct, accompanied by a plump pancreatic parenchyma and peripancreatic fat stranding (cloudy adipose tissue) indicative of secondary pancreatitis. (F) Coronal Magnetic Resonance Cholangiopancreatography (MRCP) reveals the biliary anatomy and site of ductal stenosis. (G, H) PET-CT transaxial, PET, and fused images demonstrate the metabolic activity in the upper abdomen, used here to screen for malignancy. This composite clinical visual serves as an educational tool for integrating biochemical trends with multimodality imaging (CT, MRCP, PET-CT) in the workup of hepatobiliary diseases and pancreatic complications.

A multi-panel figure illustrating diagnostic findings and clinical progression for a biliary obstruction and pancreatitis case. (A-C) Line graphs track liver function tests, showing a downward trend in total bilirubin (TBIL), gamma-glutamyl transpeptidase (γ-GT), alkaline phosphatase (ALP), alanine aminotransferase (ALT), and aspartate aminotransferase (AST) from initial presentation through biliary stent placement to admission. (D, E) Axial contrast-enhanced CT scans of the abdomen show a hyperdense biliary stent within the common bile duct, accompanied by a plump pancreatic parenchyma and peripancreatic fat stranding (cloudy adipose tissue) indicative of secondary pancreatitis. (F) Coronal Magnetic Resonance Cholangiopancreatography (MRCP) reveals the biliary anatomy and site of ductal stenosis. (G, H) PET-CT transaxial, PET, and fused images demonstrate the metabolic activity in the upper abdomen, used here to screen for malignancy. This composite clinical visual serves as an educational tool for integrating biochemical trends with multimodality imaging (CT, MRCP, PET-CT) in the workup of hepatobiliary diseases and pancreatic complications.

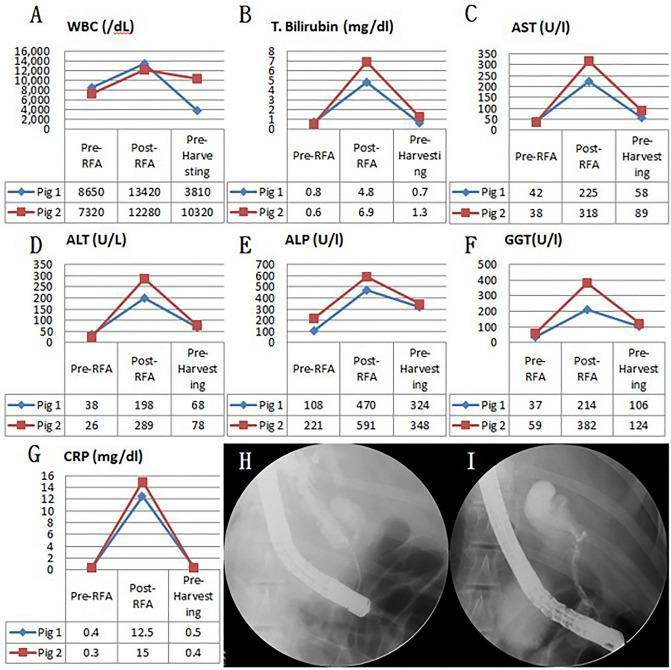
A multi-panel figure illustrating longitudinal blood markers and diagnostic imaging in a swine animal model of biliary stricture. Panels A-G consist of line graphs and data tables for two subjects (Pig 1 and Pig 2) across three time points: Pre-RFA (Radiofrequency Ablation), Post-RFA, and Pre-Harvesting. The measured markers include inflammatory indicators (WBC, CRP) and hepatobiliary liver function tests (Total Bilirubin, AST, ALT, ALP, and GGT). All markers consistently show a sharp elevation following the intraductal RFA procedure—indicating acute inflammation and cholestasis—followed by a decrease toward baseline at the 1-month follow-up (Pre-harvesting). C-reactive protein (CRP) displays the highest fold-change relative to baseline. Panels H and I are fluoroscopic cholangiography images obtained during Endoscopic Retrograde Cholangiopancreatography (ERCP). These images demonstrate biliary stenosis in the common bile duct, characterized by contrast narrowing and upstream proximal ductal dilatation. One subject shows a focal, high-grade obstruction, while the other exhibits a more gradual narrowing with a distinct pre-stenotic pouch-like dilatation.

A multi-panel figure illustrating longitudinal blood markers and diagnostic imaging in a swine animal model of biliary stricture. Panels A-G consist of line graphs and data tables for two subjects (Pig 1 and Pig 2) across three time points: Pre-RFA (Radiofrequency Ablation), Post-RFA, and Pre-Harvesting. The measured markers include inflammatory indicators (WBC, CRP) and hepatobiliary liver function tests (Total Bilirubin, AST, ALT, ALP, and GGT). All markers consistently show a sharp elevation following the intraductal RFA procedure—indicating acute inflammation and cholestasis—followed by a decrease toward baseline at the 1-month follow-up (Pre-harvesting). C-reactive protein (CRP) displays the highest fold-change relative to baseline. Panels H and I are fluoroscopic cholangiography images obtained during Endoscopic Retrograde Cholangiopancreatography (ERCP). These images demonstrate biliary stenosis in the common bile duct, characterized by contrast narrowing and upstream proximal ductal dilatation. One subject shows a focal, high-grade obstruction, while the other exhibits a more gradual narrowing with a distinct pre-stenotic pouch-like dilatation.

This composite educational resource documents hepatic function trends and dermatologic manifestations following CAR-T cell therapy and subsequent hematopoietic stem cell (HSC) infusion, illustrating complications consistent with acute graft-versus-host disease (aGVHD). 

Panel A contains three line graphs tracking clinical biomarkers over a 120-day period. The first graph displays bilirubin levels, showing sharp elevations in Total Bilirubin (TBIL), Direct Bilirubin (DBIL), and Indirect Bilirubin (IBIL), with TBIL peaking near 180 µM. The second graph tracks transaminases (ALT and AST), showing an initial spike followed by a secondary, more severe elevation reaching over 300 U/L after day 90. The third graph monitors Total Protein (TP) and Albumin, exhibiting a general decline post-infusion. 

Panel B is a clinical photograph showing a severe skin rash. The image displays a large, irregular lesion characterized by central necrosis, ulceration, and dark eschar-like tissue. The surrounding skin exhibits diffuse erythema, hyperpigmentation, and numerous small petechial or papular spots. This visual evidence supports a diagnosis of high-grade aGVHD affecting both the liver and integumentary system.

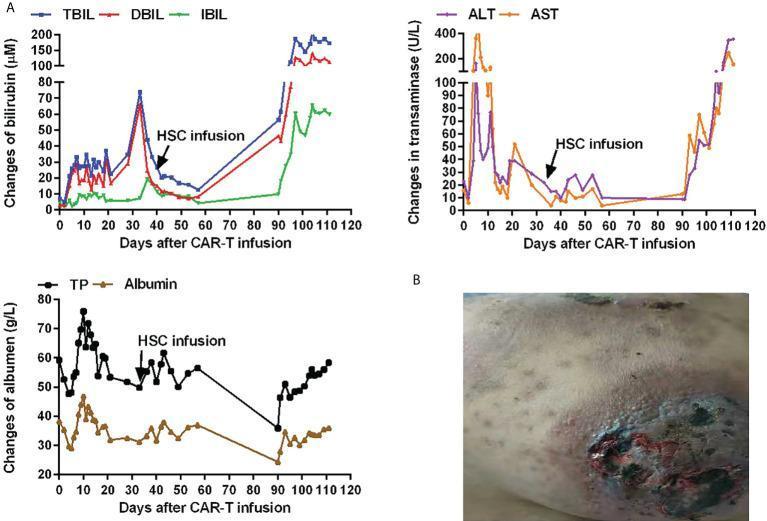
This composite educational resource documents hepatic function trends and dermatologic manifestations following CAR-T cell therapy and subsequent hematopoietic stem cell (HSC) infusion, illustrating complications consistent with acute graft-versus-host disease (aGVHD). Panel A contains three line graphs tracking clinical biomarkers over a 120-day period. The first graph displays bilirubin levels, showing sharp elevations in Total Bilirubin (TBIL), Direct Bilirubin (DBIL), and Indirect Bilirubin (IBIL), with TBIL peaking near 180 µM. The second graph tracks transaminases (ALT and AST), showing an initial spike followed by a secondary, more severe elevation reaching over 300 U/L after day 90. The third graph monitors Total Protein (TP) and Albumin, exhibiting a general decline post-infusion. Panel B is a clinical photograph showing a severe skin rash. The image displays a large, irregular lesion characterized by central necrosis, ulceration, and dark eschar-like tissue. The surrounding skin exhibits diffuse erythema, hyperpigmentation, and numerous small petechial or papular spots. This visual evidence supports a diagnosis of high-grade aGVHD affecting both the liver and integumentary system.

Summary : This flowchart outlines the diagnostic workup for abnormal liver tests in pregnant women, distinguishing between hepatocellular and biliary profiles, and guiding further testing and management based on initial findings.

flowchart:
# Nodes :
  • Start: "Pregnant woman: initial workup of abnormal liver tests" (red rectangle)
  • Decision: "Hepatocellular profile? AST/ALT" (yellow rectangle)
  • Decision: "Biliary profile? elevated bili/alk phos" (green rectangle)
  • Process: "Rule out: Viral hepatitis, Herpes, Medications, Other**" (yellow rectangle)
  • Process: "Anti-HAV IgM, HBsAg, Hepatitis E IgM, HSV PCR" (yellow rectangle)
  • Process: "See Pregnancy-related workup" (purple rectangle)
  • Decision: "Bilirubin +/- alk phos" (green rectangle)
  • Decision: "Alk phos only" (green rectangle)
  • Process: "Biliary imaging" (green rectangle)
  • Process: "No further workup" (green rectangle)
  • Decision: "No evidence of obstruction" (green rectangle)
  • Process: "See Pregnancy-related workup" (purple rectangle)

# Connectors :
  • The initial node splits into two branches: hepatocellular profile (left) and biliary profile (right).
  • Hepatocellular profile branch: 
    – "Hepatocellular profile? AST/ALT" → "Rule out: Viral hepatitis, Herpes, Medications, Other**"
    – "Rule out: ..." → "Anti-HAV IgM, HBsAg, Hepatitis E IgM, HSV PCR"
    – "Anti-HAV IgM, ..." → "See Pregnancy-related workup"
  • Biliary profile branch:
    – "Biliary profile? elevated bili/alk phos" → two branches:
      • "Bilirubin +/- alk phos" → "Biliary imaging" → "No evidence of obstruction" → "See Pregnancy-related workup"
      • "Alk phos only" → "No further workup"

# Layout :
  • The flowchart is organized as a top-down decision tree with two main branches (hepatocellular and biliary) diverging from the initial node.
  • The hepatocellular branch is on the left, the biliary branch is on the right.
  • The biliary branch further splits into two sub-branches based on the presence of bilirubin and/or alkaline phosphatase.

# Analysis :
  • The flowchart provides a clear, stepwise approach for evaluating abnormal liver tests in pregnant women, emphasizing the importance of distinguishing between hepatocellular and biliary patterns.
  • It ensures that relevant infectious and non-infectious causes are considered and that unnecessary workup is avoided when only alkaline phosphatase is elevated.
  • The process directs clinicians to pregnancy-specific workup when indicated and highlights the need for biliary imaging if both bilirubin and alkaline phosphatase are elevated.
  • The chart also notes that other differential diagnoses (e.g., AIH, Wilson disease) should be considered if clinically appropriate.

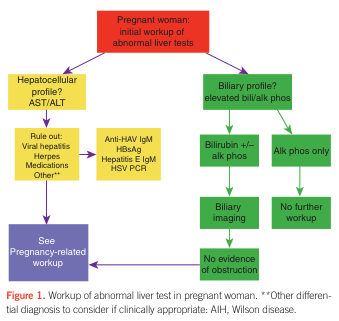
Summary : This flowchart outlines the diagnostic workup for abnormal liver tests in pregnant women, distinguishing between hepatocellular and biliary profiles, and guiding further testing and management based on initial findings. flowchart: # Nodes : • Start: "Pregnant woman: initial workup of abnormal liver tests" (red rectangle) • Decision: "Hepatocellular profile? AST/ALT" (yellow rectangle) • Decision: "Biliary profile? elevated bili/alk phos" (green rectangle) • Process: "Rule out: Viral hepatitis, Herpes, Medications, Other**" (yellow rectangle) • Process: "Anti-HAV IgM, HBsAg, Hepatitis E IgM, HSV PCR" (yellow rectangle) • Process: "See Pregnancy-related workup" (purple rectangle) • Decision: "Bilirubin +/- alk phos" (green rectangle) • Decision: "Alk phos only" (green rectangle) • Process: "Biliary imaging" (green rectangle) • Process: "No further workup" (green rectangle) • Decision: "No evidence of obstruction" (green rectangle) • Process: "See Pregnancy-related workup" (purple rectangle) # Connectors : • The initial node splits into two branches: hepatocellular profile (left) and biliary profile (right). • Hepatocellular profile branch: – "Hepatocellular profile? AST/ALT" → "Rule out: Viral hepatitis, Herpes, Medications, Other**" – "Rule out: ..." → "Anti-HAV IgM, HBsAg, Hepatitis E IgM, HSV PCR" – "Anti-HAV IgM, ..." → "See Pregnancy-related workup" • Biliary profile branch: – "Biliary profile? elevated bili/alk phos" → two branches: • "Bilirubin +/- alk phos" → "Biliary imaging" → "No evidence of obstruction" → "See Pregnancy-related workup" • "Alk phos only" → "No further workup" # Layout : • The flowchart is organized as a top-down decision tree with two main branches (hepatocellular and biliary) diverging from the initial node. • The hepatocellular branch is on the left, the biliary branch is on the right. • The biliary branch further splits into two sub-branches based on the presence of bilirubin and/or alkaline phosphatase. # Analysis : • The flowchart provides a clear, stepwise approach for evaluating abnormal liver tests in pregnant women, emphasizing the importance of distinguishing between hepatocellular and biliary patterns. • It ensures that relevant infectious and non-infectious causes are considered and that unnecessary workup is avoided when only alkaline phosphatase is elevated. • The process directs clinicians to pregnancy-specific workup when indicated and highlights the need for biliary imaging if both bilirubin and alkaline phosphatase are elevated. • The chart also notes that other differential diagnoses (e.g., AIH, Wilson disease) should be considered if clinically appropriate.

Reading File
Reading File
Reading File
Reading File
Reading File
Reading File
Reading File
Reading File
Reading File
Loading Image
I now have comprehensive textbook content to write a thorough answer. Here is a complete guide to Liver Function Tests:

Liver Function Tests (LFTs)

Liver function tests (LFTs) are a panel of blood tests used to evaluate the health of the liver, detect liver injury, assess synthetic function, and monitor disease progression. They are more accurately described as "liver panels" because many components reflect liver injury rather than true function.

Overview of Hepatic Functions Being Assessed

The liver performs numerous roles that LFTs attempt to measure:
  • Synthesis: albumin, coagulation factors, carrier proteins
  • Metabolism/conjugation: bilirubin, drugs, lipids, amino acids
  • Bile production and excretion: bile acids, cholesterol, bilirubin
  • Detoxification: ammonia → urea
As noted in Harrison's Principles of Internal Medicine (22nd ed.), "measurement of these activities to assess liver function is complicated by the multiplicity and variability of these functions."

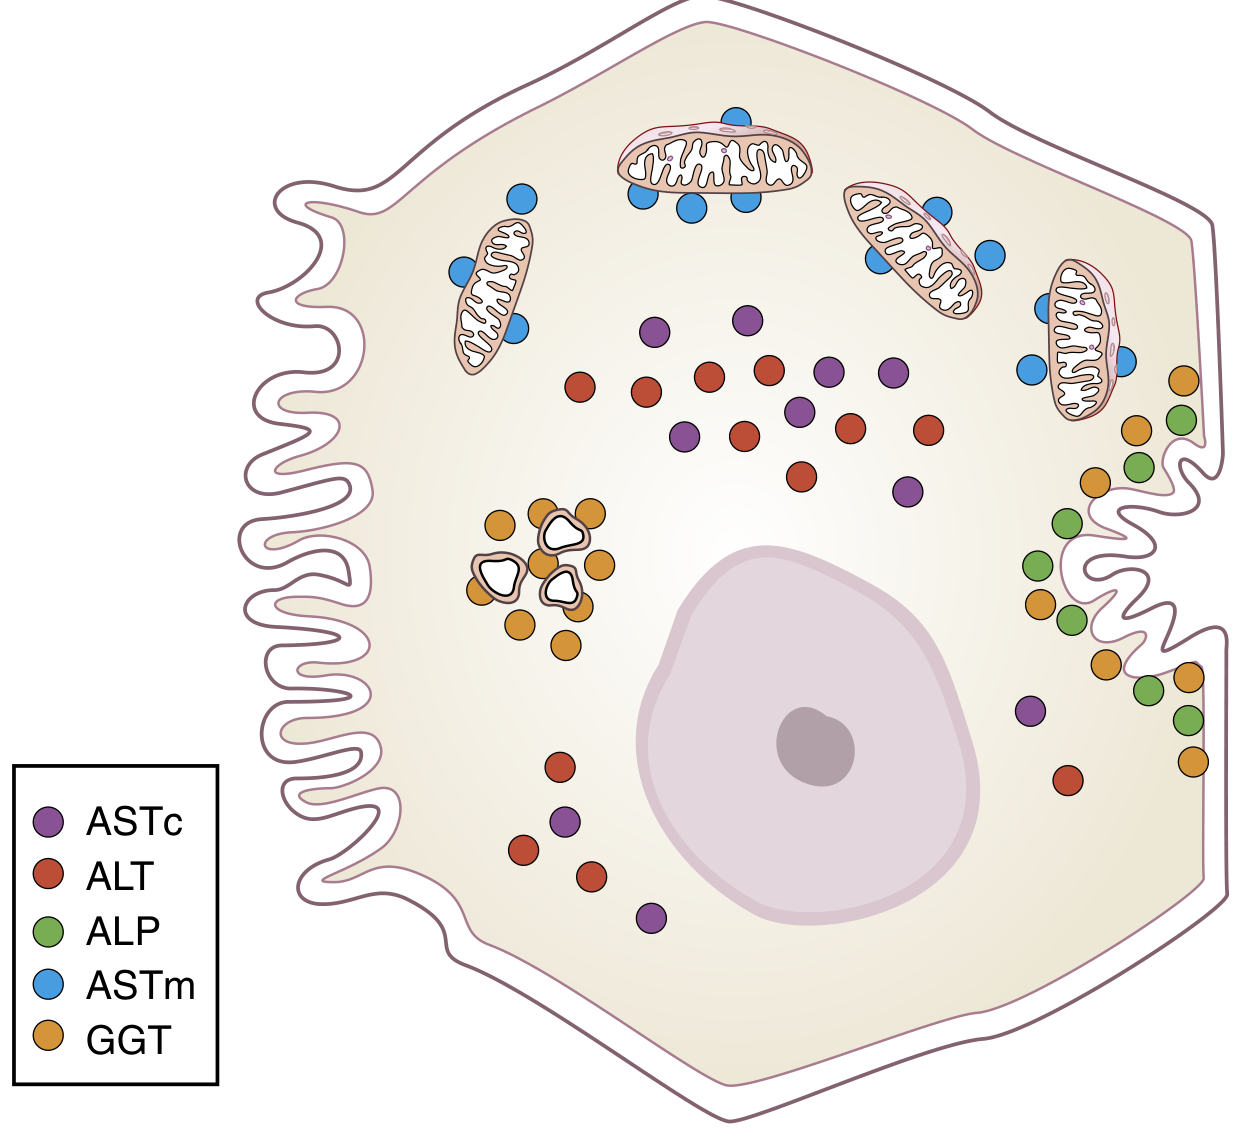
Intracellular Location of Key Enzymes

Understanding where each enzyme sits within the hepatocyte explains the pattern of elevation seen in different diseases.
Location of hepatocellular enzymes (Henry's Clinical Diagnosis)
EnzymeLocationReleased by
ALT (cytosolic)CytosolMembrane injury (viral/toxic hepatitis)
ASTc (cytosolic)CytosolMembrane injury
ASTm (mitochondrial)MitochondriaMitochondrial damage (e.g., alcohol)
ALP, GGTCanalicular surfaceBile acid accumulation in cholestasis; GGT also in microsomes

Components of a Standard LFT Panel

1. Bilirubin

Normal metabolism:
  • ~250-350 mg/day produced in healthy adults
  • ~85% derived from senescent red cell hemoglobin breakdown
  • Heme → biliverdin (via heme oxygenase) → bilirubin (via biliverdin reductase)
  • Unconjugated bilirubin is transported bound to albumin to the liver
  • In hepatocytes: conjugated with glucuronic acid → water-soluble conjugated (direct) bilirubin → excreted into bile
Measurement:
  • Total bilirubin: normal ~0.2-1.2 mg/dL
  • Direct (conjugated) bilirubin: normally 0-0.1 mg/dL (occasionally 0.2 mg/dL)
  • Indirect (unconjugated) bilirubin: total minus direct
  • Delta bilirubin: conjugated bilirubin covalently bound to albumin; seen in prolonged cholestasis
Reference range notes:
  • Values are higher in males than females at all ages
  • Peak values at ages 14-18, stable adult levels by age 25
  • Strenuous exercise raises bilirubin
  • African Americans have significantly lower baseline bilirubin
Clinical significance:
PatternCause
Raised unconjugated (indirect)Hemolysis, Gilbert syndrome, Crigler-Najjar
Raised conjugated (direct)Hepatocellular disease, cholestasis, biliary obstruction
Both raisedSevere hepatocellular failure, Dubin-Johnson syndrome

2. Aminotransferases (Transaminases)

AST (Aspartate Aminotransferase) - formerly SGOT ALT (Alanine Aminotransferase) - formerly SGPT
These enzymes catalyze reversible transfer of amino groups in intermediate metabolism. They are the primary markers of hepatocellular injury.
Key points:
  • ALT is more liver-specific (also found in skeletal muscle and heart at lower levels)
  • AST is found in liver, heart, skeletal muscle, kidney, brain, and red blood cells - less specific
  • Both are cytosolic; AST also has a mitochondrial isoform (ASTm)
Causes of elevated transaminases:
Degree of elevationCommon causes
Mild (< 3x ULN)NAFLD, alcohol, thyroid disease, celiac, medications
Moderate (3-20x ULN)Chronic viral hepatitis, autoimmune hepatitis
Severe (> 20x ULN)Acute viral hepatitis, ischemic hepatitis ("shock liver"), toxins
Very high (> 1000 IU/L)Viral hepatitis A, paracetamol toxicity, ischemic hepatitis
AST:ALT ratio:
  • Ratio > 2:1 (especially >3:1) strongly suggests alcoholic liver disease - alcohol preferentially damages mitochondria releasing ASTm
  • Ratio <1 more typical of viral hepatitis and NAFLD
  • Both enzymes may normalize even in advanced cirrhosis (burnt-out liver)

3. Alkaline Phosphatase (ALP)

  • Located on the canalicular surface of hepatocytes
  • Released when bile acids accumulate (cholestasis), dissolving membrane fragments
  • Also found in bone, placenta, intestine, kidney
Clinical significance:
  • Predominantly elevated → suggests bile duct injury, cholestasis, or cholangitis
  • Must confirm hepatic origin: ALP elevation + elevated GGT = hepatic source
  • If ALP elevated with normal GGT in a child/adolescent → likely bone (growth)
  • Causes include: biliary obstruction (stones, strictures, carcinoma), primary biliary cholangitis, primary sclerosing cholangitis, infiltrative liver disease (TB, sarcoidosis, amyloidosis), drug-induced cholestasis

4. Gamma-Glutamyl Transferase (GGT)

  • Located on both canalicular surface and microsomes
  • Sensitive but non-specific for liver disease
  • Microsomal enzyme-inducing drugs (phenobarbital, phenytoin, alcohol, carbamazepine) can raise GGT by increasing GGT synthesis
Uses:
  • Confirm hepatic origin of raised ALP
  • Sensitive marker for alcohol use (rises with chronic alcohol consumption)
  • Marker for microsomal enzyme induction from any cause
  • Normal GGT with raised ALP → bone disease (not liver)

5. Albumin

  • Synthesized exclusively by the liver
  • Half-life ~20 days → reflects chronic hepatic synthetic function (not acute failure)
  • Normal: 3.5-5.0 g/dL
Causes of low albumin:
  • Chronic liver disease/cirrhosis (reduced synthesis)
  • Nephrotic syndrome (urinary losses)
  • Malnutrition
  • Acute-phase response (negative acute-phase reactant)
  • Third-space losses (ascites, edema)
Note: Albumin is a lagging indicator - it will be normal in acute liver failure. It is most useful in chronic liver disease.

6. Prothrombin Time (PT) / INR

  • All coagulation factors except Factor VIII are synthesized by the liver
  • PT/INR measures acute hepatic synthetic function (because Factor VII has the shortest half-life, ~6 hours)
  • Elevated PT/INR = impaired synthetic function = severe liver disease
  • Also prolonged by: vitamin K deficiency, warfarin, DIC, malabsorption
Clinical use:
  • PT is one of the most sensitive indicators of acute liver failure
  • Appearance of hepatic encephalopathy + prolonged PT → definition of acute liver failure

7. Ammonia

  • Produced from amino acid and nucleic acid metabolism
  • Metabolized exclusively in the liver via the urea cycle (Krebs-Henseleit cycle)
  • Key enzyme: ornithine carbamoyltransferase (OCT) - unique to liver
  • Elevated in hepatic encephalopathy
  • Note: >80% of liver must be destroyed before ammonia metabolism fails significantly

Pattern Recognition in LFT Interpretation

This is how Tietz Textbook of Laboratory Medicine (7th ed.) summarizes pattern interpretation:
PatternPredominant abnormalitySuggests
HepatocellularALT and AST raisedParenchymal injury, hepatitis
CholestaticALP and GGT raisedBile duct injury, cholestasis, cholangitis
MixedBoth patternsDrug-induced, cholestatic hepatitis
Synthetic failureLow albumin, raised PT/INRChronic or severe acute liver disease
HyperbilirubinemiaRaised bilirubinCholestasis, hemolysis, hepatocellular dysfunction

Scoring Systems Using LFTs

Child-Pugh Score (Chronic liver disease/Cirrhosis)

Uses 5 parameters to assess severity:
Factor1 point2 points3 points
Serum bilirubin< 2.0 mg/dL2.0-3.0 mg/dL> 3.0 mg/dL
Serum albumin> 3.5 g/dL3.0-3.5 g/dL< 3.0 g/dL
PT (seconds prolonged)< 44-6> 6
AscitesNoneEasily controlledPoorly controlled
Hepatic encephalopathyNoneMinimalAdvanced
  • Class A (5-6): Compensated cirrhosis
  • Class B (7-9): Significant impairment
  • Class C (10-15): Decompensated (transplant listing threshold)

MELD Score

Based on: bilirubin, creatinine, and INR - used for liver transplant prioritization.

Key Non-Hepatic Causes of Abnormal LFTs

Many LFT components are not liver-specific:
TestNon-hepatic causes of elevation
ASTMyocardial infarction, hemolysis, skeletal muscle disease, thyroid disease
ALPBone disease (Paget's, fracture, metastases), pregnancy, growth in children
GGTAlcohol, anticonvulsants, pancreatitis, renal disease
BilirubinHemolysis, Gilbert syndrome, ineffective erythropoiesis
AlbuminNephrotic syndrome, malnutrition, inflammation
PTWarfarin, vitamin K deficiency, DIC

Liver Failure Pattern

In severe cirrhosis or fulminant hepatic failure, the combination of abnormalities includes:
  • Hyponatremia (ADH dominance) or hypernatremia (aldosterone dominance) from ascites/fluid shifts
  • Hepatorenal syndrome: elevated creatinine + BUN with urine osmolality/plasma osmolality ratio < 1.2
  • Coagulopathy: elevated PT/APTT ± DIC (check D-dimer to distinguish)
  • Low albumin, elevated immunoglobulins
  • Target cells on peripheral blood smear
  • Possible thrombocytopenia from splenomegaly (portal hypertension)

Quick Summary Reference

TestWhat it measuresRises inNormal range (approx.)
Total BilirubinConjugation & excretionHemolysis, hepatitis, cholestasis0.2-1.2 mg/dL
ALTHepatocellular injuryHepatitis, NAFLD, toxins7-56 U/L
ASTHepatocellular + other injuryHepatitis, alcohol, cardiac10-40 U/L
ALPCholestasis, boneBiliary obstruction, bone disease44-147 U/L
GGTCholestasis, alcohol, drugsAlcohol use, enzyme induction9-48 U/L
AlbuminChronic synthetic functionReduced in cirrhosis, malnutrition3.5-5.0 g/dL
PT/INRAcute synthetic functionLiver failure, anticoagulants, vit K defINR 0.8-1.2
AmmoniaUrea cycle functionHepatic encephalopathy15-45 µmol/L

Sources:
  • Harrison's Principles of Internal Medicine 22E (2025), Chapter 347: Liver Structure and Function
  • Henry's Clinical Diagnosis and Management by Laboratory Methods, Chapter 22: Liver Function
  • Tietz Textbook of Laboratory Medicine, 7th Edition: LFT Abnormalities section
This is a shared conversation. Sign in to Orris to start your own chat.